The traditional data platforms follow a standard paradigm—it takes data feeds from multiple sources, loads it into the staging area, transforms it, and loads it into the final results data warehouse for business intelligence tools.
In this chapter, I will explain how a big data platform using Hadoop can be developed by using a similar paradigm.
I will cover the full data life cycle of a project on a risk and regulatory big data platform:
- Data collection—data ingestion from multiple sources scheduled using Oozie or Informatica
- Data transformation—transform data using Hive, Pig, and Java MapReduce
- Data analysis—integration of BI tools with Hadoop
This chapter will again be a bit more technical with architecture, data flow diagrams, and a few sample code templates.
For this chapter, it will be very helpful if you are familiar with the Hadoop core ecosystem. I recommend you to refer to Apache websites on Hadoop, Oozie, Pig, and Hive at any point, if you need to know more.
Following the Lehman brothers' bankruptcy and the financial crisis in 2007, many other financial organizations have also gone bust, due to lack of good risk management. Profit margins are down, due to a poor economy and regulatory pressures.
Most large banks don't have a single cross-asset risk data store that can be used for risk data aggregation at the enterprise level. They also don't have a single trade and positions data store for consistent regulatory reports.
The data is replicated from one system to another, as every asset class trading department has their own data store. It results in duplicated and inconsistent data definitions and further operational and regulatory challenges. The key challenges they face now are:
- Point-to-point feed from the same source systems to different risk and regulatory data stores, leading to duplicate data, more testing cycles, and inefficient workflows
- Data scalability issues—the need to store all historical end-of-day risks and not just the latest end-of-day risk, makes the processing and storage more expensive for traditional databases
- Risk model development and testing on historical data is very computationally intensive and difficult to scale on traditional platforms
- Regulatory reporting, such as Volcker Metric and other stress test scenarios with heavy-duty data processing, is difficult to scale on traditional platforms
Most of these risk and regulatory requirements will require data from at least 7 years. Large banks have millions of trade and positions every day for commodities, credit, equities, fixed income, options and structured trading, rates, and other trading products. So we are already talking of billions of records to be processed, and computationally intensive calculation of the risk and regulatory metrics makes the problem even worse.
Given the requirements, these banks will have to build a shared enterprise-level cross-asset data store and make it massively scalable, using the Hadoop platform. If the bank has already started archiving their risk, trading, and position data to HDFS, they can be leveraged easily.
They should be able to store valuation/risk/explains, trades/positions, instruments, markets, counterparties, and sales data on this Hadoop Enterprise data platform, which will help them to:
- Eliminate many point-to-point feeds
- Reduce data redundancy
- Achieve a common data definition across the bank
- Retain historical data at a much lower cost
- Perform advanced data mining and statistical analysis on massive data sets
- Achieve consistent regulatory reports
As shown in the following figure, the data stores receive risk, trade, positions, and reference data from various source systems, and each system may cover more than one asset class (equities, fixed income, or money markets). Each asset class or group of asset classes has its own data store—collecting and transforming data by using its own custom transformations to calculate risk and regulatory metrics. These metrics are used by data consumers—front office, risk managers, and regulatory bodies:
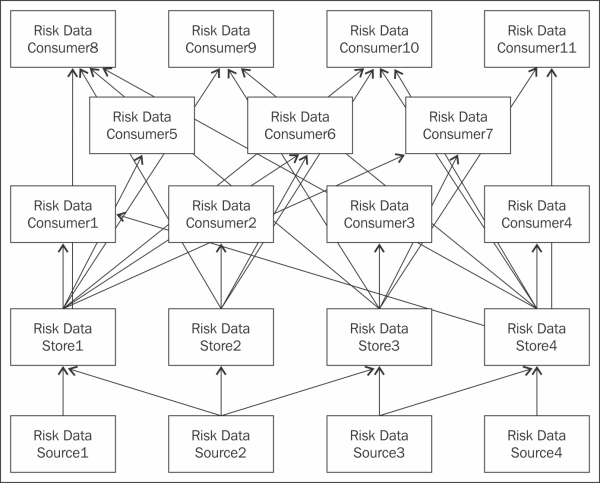
The data is distributed across many downstream data consumers and it takes a very long time to make the data available to all consumers. The problem is worse with failures at different stages of data movements. Also, they need a lot of operational staff to rerun the extract or load jobs every time they fail.
As shown in the following figure, they will implement a single Hadoop-based cross-asset enterprise data platform. The key design points are:
- The single cross-asset data store receives risk, trade, positions, and reference data from all source systems, covering all asset classes
- The data is transformed and analyzed on the Hadoop platform
- The front office, risk managers, and regulatory bodies—all data consumers can access the consistent data metrics directly from one shared data platform

For this project, I will briefly cover certain configurations and assumptions:
- Configure the input data location on Enterprise HDFS, where we will receive the data from source systems. It must have a standard naming convention as
<default_hdfs_directory>/data/input/<system_name>/<subject area>/<business date>/<file_name>. <system name>will be the data source system.<subject area>can either be the asset class or department; for example, FX, Equities, Risk, Regulatory, Volcker, and so on. You can choose to ignore<subject area>if the filename clearly identifies the subject area, for example,FX_Trade.txt. - Configure the target data location on Enterprise HDFS, where we will store the calculated metrics or other summarized results for downstream systems or business intelligence tools. It also needs to have a standard naming convention as
<default_hdfs_directory>/data/output/<system name>/<subject area>/<business date>/<file_name>. <system name>is a completely optional field and should be used only if the metrics are for a system.<subject area>can either be the asset class or department; for example, FX, Equities, Risk, Regulatory, Volcker, and so on. You can choose to ignore<subject area>if the file name clearly identifies the subject area, for example,Volcker_Inventory_Turnover.txt.<Business date>is again optional and can be a grouping of dates such as month, Q1, Q2, H1, or even yearly, depending on the metrics. - Configure the temporary data location on Enterprise HDFS, where we will store the intermediate results and calculated data during transformations. It also needs to follow the standard naming convention, as
<default_hdfs_directory>/data/temp/<system_name>/<subject area>/<business date>/<file_name>. - Configure the scripts' location on the Enterprise Hadoop application, where we store all the Pig, Hive, and Java code. It also needs to follow the standard naming convention, as
<default_application_directory>/<application_name>/<script>. <application_name>could be the project or application name. I recommend a common directory for all reusable code. Each script should have the recommended extension; for example, Pig scripts should have the.pigextension, Hive scripts should have the.hqlextension, and so on. - You need to use Putty or any other SSH client to connect to the data sources and application code on local directories or transformed data on HDFS.
We will be collecting data from various source systems and storing it directly on HDFS, using two options—one is for core Hadoopers with the Apache Oozie workflow, and another one is with industry tools.
I am assuming that you know how to write shell jobs to import data files into HDFS and write Sqoop jobs to import data directly from relational data sources. Once you have written your shell or Sqoop jobs to pull data from sources into the Enterprise HDFS platform, you can schedule the jobs by using Oozie. Not just shell or Sqoop, you can also schedule MapReduce, Java, Pig, and Hive scripts on Oozie.
Oozie can run workflows for dependent jobs and has two main components:
- The workflow engine, which stores and runs workflows of actions
- The coordinator engine, which schedules the workflow jobs based on periodic times or data readiness
As the trade, position, and risk data will be received from a number of source systems, we should not expect data providers to learn about it. So, the extraction responsibility will almost certainly fall within the receiving enterprise HDFS system's scope.
Here are a few basic steps to configure your jobs on Oozie, once you have completed the shell and Sqoop scripts to import data into HDFS:
- Configure Oozie to operate on the core Hadoop cluster.
- Start Oozie by using the following command:
oozie-start.sh - Check the status by using this command:
oozie admin -status - Configure the workflows, which are defined as XML. The logic is simple—the smallest units of action (such as a shell script; a Sqoop command; or a Pig, Hive, or MapReduce job) is an action and each action (node) begins with the
STARTnode, succeeds with theENDnode, and fails with theKILLnode. - The following is an example of a workflow definition of a shell script to copy data from the source directory to HDFS. Copy the shell script to the computing node's current working directory:
<workflow-app xmlns='uri:oozie:workflow:0.3' name= "[WF-DEF-NAME]">
<start to="[NODE-NAME]"/>
<action name="[NODE-NAME]">
<shell xmlns="uri:oozie:shell-action:0.1">
<job-tracker>${jobTracker}</job-tracker>
<name-node>${nameNode}</name-node>
<configuration>
<property><name>mapred.job.queue.name</name>
<value>${queueName}</value>
</property>
</configuration>
<exec>${EXEC}</exec>
<argument>A</argument>
<argument>B</argument><file>${EXEC}#${EXEC}</file>
</shell>
<ok to="end" />
<error to="fail" />
</action>
<kill name="fail">
<message>Script failed, error message[${wf:errorMessage(wf:lastErrorNode())}]
</message>
</kill>
<end name='end' />
</workflow-app>
Configure
WF-DEF-NAMEandNODE-NAME, as shown in the following commands. The shell action andNODE-NAMEwill be repeated for each data source with the shell script:[WF-DEF-NAME] = Risk Data Import Shell1 [NODE-NAME] = RiskDataImport-source1-shell
- Configure the properties file with the parameters used in the workflows that we saw earlier:
oozie.wf.application.path=hdfs://localhost:8020/user/<usernme>/workflows/script
EXEC=ImportRiskDataSource1script.sh
jobTracker=localhost:8021
nameNode=hdfs:/localhost:8020
queueName=default
- The following is an example of a workflow definition of a Sqoop script to import currency reference data from the source database directly to HDFS:
<workflow-app xmlns="uri:oozie:workflow:0.1" name"[WF-DEF-NAME]">
...
<action name"[NODE-NAME]">
<sqoop xmlns="uri:oozie:sqoop-action:0.2">
<job-tracker>${jobTracker}</job-tracker>
<name-node>${nameNode}</name-node>
<prepare>
<delete path="${jobOutput}"/>
</prepare>
<configuration>
<property><name>mapred.compress.map.output</name> <value>${queueName}</value>
</property>
</configuration>
<command>import --connect jdbc:StaticDBsqlserver --table Currency --target-dir hdfs:/localhost:8020/<default_hdfs_directory>/data/input/Reference/20150206/currency.txt</command>
</sqoop>
<ok to="myotherjob"/>
<error to="errorcleanup"/>
</action>
...
</workflow-app>
Configure
WF-DEF-NAMEandNODE-NAME, as shown in the following commands. The shell action andNODE-NAMEwill be repeated for each data source with the shell script.[WF-DEF-NAME] = RiskDBImport-wf [NODE-NAME] = SqoopReferenceDBSource1
- Configure the properties file with the parameters used in the workflows that we saw earlier with the filename
job.properties:oozie.wf.application.path= hdfs://localhost:8020/user/<usernme>/workflows/script jobTracker=localhost:8021 nameNode=hdfs:/localhost:8020 queueName=default
- Submit the workflow to Oozie by using the following command and then verify the execution:
Oozie job –config job.properties -run - Configure the Oozie coordination engine definition file,
coordinator.xml, and schedule by either time (periodic) or data availability (data received in the expected directory). The following example schedules the risk data import daily. Detailed information on the allowed configurations is available on the Apache Oozie website.<coordinator-app name="RiskDataImport-scheduler" xmlns="uri:oozie:coordinator:0.2" frequency="${coord:days(1)}" start="${startDay}" end= "${endDay}" timezone="America/New_York"><controls> <timeout>5</timeout> </controls> <action> <workflow> <app-path>${appPath}</app-path> </workflow> </action> </coordinator-app> - Configure the Oozie coordination properties by using
coordinator.propertieswith these parameters:nameNode=hdfs:/localhost.localdomain:8020 jobTracker=localhost.localdomain:8021 queueName=default oozie.libpath=${nameNode}/user/oozie/share/lib oozie.use.system.libpath=true oozie.wf.rerun.failnodes=true startDay=2014-07-30T16:05Z endDay=2015-07-30T16:05Z appPath=${nameNode}/user/${user.name}/RiskWorkflow oozie.coord.application.path=${appPath} optionFile=sqoop_param.txt DataPath=${nameNode}/user/${user.name}/RawData - Submit the workflow to Oozie by using the following command, which schedules the daily import:
Oozie job –config coordinator.properties -run - Monitor the running workflow(s) by using the web UI directly on the web console at
http:/<server name>:11000/oozie/.
ETL is a very generic term used for extraction, transformation, and loading of data. There are tools that perform ETL in a very easy-to-maintain graphical form—no hand coding of data integration modules, connects to almost any data source, transforms using drag and drop, and schedules jobs.
For large banks that have invested significantly in those ETL tools, they will stick to them, as long as it provides value. In the last few years, most of the leading ETL tools have developed adapters to Hadoop, which makes it a lot easier to move the data in or out of Hadoop.
Most of these tools allow existing developers to continue building new Hadoop solutions using their existing ETL skills. The best thing about it is no complicated code or scripts in Java, Python, or even Pig, or Hive.
There are new entrants in the ETL tool market with Hadoop integration—each with a rich user interface based on drag-and-drop jobs and workflows. They sometimes claim to have a better performance than the MapReduce code.
Top ETL products are (in no particular order and by no means complete):
- Informatica (V9.1 onwards)
- IBM Data Stage (V9 onwards)
- SQL Server Integration Services 2012
- Pentaho
- Talend (V5.3 onwards)
- Oracle Data Integrator (12c onwards)
- Syncsort DMX-h
- Datameer
According to the Gartner 2014 report on data integration tools, Informatica is the leader of the ETL tool market space. It is widely used within the financial sector and I will touch base this tool as an example to import and export data out of the Risk HDFS platform.
Please visit http://www.informatica.com for more details.
With the assumption that other ETL tools have similar functionalities, I will use Informatica Powercenter (PC) 9.5.1 and Power Exchange for Hadoop as a base to explain how ETL tools can be used to automate data ingestion.
Raw trade, position, and risk data files go through basic cleanup and transformations (trimming of extra spaces, consistent letter case, numeric and date formats) and can be loaded on the Risk HDFS platform, using Informatica.
The key steps are:
- Configure Informatica Powercenter Designer to connect to the development repository using the given hostname and ports.
- You will see a prepopulated folder with the entire ETL mapping to load Risk HDFS. Please ensure that you have the full read-write or development permissions on the folder.
- Configure the source definition—file, database, or any other supported format.
- Configure the HDFS target definition as defined in the manual.
- Connect to the Informatica workflow manager and create the workflow using the existing template with a new source definition. Reuse the existing preconfigured target HDFS connection.
- The Informatica workflow is now ready to extract data from the source system and load it into Risk HDFS. The workflow can be schedule directly using the Informatica scheduler or any other scheduler.
- Alternately, write a shell script to invoke the Informatica workflow and use Oozie to schedule it.
For this project, I will use ETL tools to move the data in and out of Hadoop. With an existing ETL team, it makes the enterprise adoption of Hadoop a bit easier, as existing IT data providers may be reluctant to learn Hadoop or write Sqoop or shell scripts.
However, if parts of your data transformation involve less data crunching, a mixed approach of using both ETL tools and Hadoop tools (Hive, Pig, and MapReduce) is also a good idea.
The most popular high-level Hadoop languages are Hive and Pig, and both have significantly fewer lines of coding, compared to Java MapReduce programs. And both can solve almost any data problem a Java MapReduce program can solve. If they can't, you can create a user-defined function (UDF) in Java and integrate with the Hadoop session or include that in the Hive/Pig libraries permanently.
Now, the question, is if you have to choose either Pig or Hive for all your transformation needs, which one will you choose? Generally speaking, if you are technically proficient across databases and programming languages, you can simply toss a coin and use either Pig or Hive.
The latest benchmark tests prove that Hive performs marginally better than Pig for very large data sets and is inconclusive for smaller data sets. But Pig is more popular and widely used compared to Hive, because it is a procedural language and slightly more flexible in the dynamic use of variables.
I will discuss different options to transform the incoming data into more useful data using Hive, Pig, or Java MapReduce. A detailed solution is not the purpose of this book – it is more about providing the readers with enough details to choose the correct direction. So, I will touch base on all the options with brief technical details and code templates.
We will use Hive for the transformation and to store the intermediate and final results, which will be used later by downstream risk and regulatory managers.
We will still follow a standard data-warehouse-type pattern—staging database, intermediate database, and results database. We can either create three Hive databases or just one database. However, the table names always need to have a good naming convention, such as attaching the prefix stg_ for stage, int_ for intermediate, and <business purpose>_ for the final output tables.
If the same Hive installation is shared across multiple teams, I would recommend limiting the number of databases, but it is completely up to the team developing the solution. In our example, we will create only one Hive database, using the following command:
CREATE DATABASE riskandregulatorywh COMMENT 'Risk and regulatory enterprise warehouse'
We will be receiving hundreds of trade, position, and risk data files— ranging from small to extremely large on a daily basis. The key requirement remains to store them for at least 7 years on HDFS.
All files are delimited files unless stated otherwise, and <Business date> is defined in YYYYMMDD format.
Let's first define an incoming directory for each source system:
<default_hdfs_directory>/data/input/<Trading_system1>/TRADE/20150702/Trade_details.txt<default_hdfs_directory>/data/input/<Trading_system1>/TRADE/20150702/Position_details.txt<default_hdfs_directory>/data/input/<Reference_system1>/REF/20150702/Business_Hierarchy.txt<default_hdfs_directory>/data/input/<Trading_system1>/TRADE/20150702/Trade_details.txt<default_hdfs_directory>/data/input/<Risk_FO_system1>/RISK/20150702/Risk_Sensistivity_details.txt
For each file definition, we must have a corresponding table defined within the Hive data warehouse.
Create the Hive external table by using the following code template (not all columns are included):
USE riskandregulatorywh;
CREATE EXTERNAL TABLE STG_SYSTEM1_TRADE_DETAILS (
BUSINESSAREA STRING COMMENT 'optional comments',
TRADEID STRING,
BOOKNAME STRING,
TRADEPRODUCTTYPE STRING,
TRADEPRODSUBTYPE STRING,
BOOKINGCOUNTERPARTYID STRING,
LEGALENTITYID STRING,
MATURITYDATE STRING,
TRADEDATE STRING,
................
................
TRADELEVELSTRESSEDRWA_USD FLOAT,
TRADELEVELCVSUNHEDGEDRWA_USD FLOAT,
TRADELEVELCVSHEDGEDRWA_USD FLOAT,
TOTALRWA_USD FLOAT,
NETIR01_USD FLOAT,
PV_USD FLOAT
)
PARTITIONED BY (VALUATIONDATE INT)
ROW FORMAT DELIMITED FIELDS TERMINATED BY '|';
As soon as the trade, position, or risk files are received on HDFS, they should be mapped to the appropriate partitions by using HiveQL scripts that use commands like the following:
ALTER TABLE STG_SYSTEM1_TRADE_DETAILS ADD PARTITION (VALUATIONDATE=<configured_business_date> LOCATION = '<default_hdfs_directory>/data/input/<Trading_system1>/TRADE/20150702/Trade_details.txt'
There is no reason why smaller reference tables cannot be stored on HDFS and accessed using Hive. We will now create a small reference table for the business hierarchy, to be used later for joins to trade and risk data. As the reference table is fairly static and Hive doesn't allow updates as of now (it may change in future releases), we will remap the table definition to the new data location.
Create the Hive external table, using the following code template (not all columns are included):
DROP TABLE IF EXISTS BUSINESS_HIERARCHY;
CREATE EXTERNAL TABLE BUSINESS_HIERARCHY
(
BUSINESSAREA STRING,
SUBPRODUCTNAME STRING,
..............
LEVEL6NAME STRING,
LEVEL7NAME STRING,
BOOKNAME STRING
)
ROW FORMA DELIMITED FIELDS TERMINATED BY ',' LOCATION = '<default_hdfs_directory>/data/input/<Reference_system1>/REF/<configured_business_date>/Business_Hierarchy.txt'
I recommend you to create Hive tables for all static tables like currency, instruments, and so on, if there is any need to join it with trade, position, events during data processing.
Hive allows the majority of SQL operations that can be done on traditional relational databases.
For example, we need trade details, but with additional business hierarchy details. We can simply create a view with a join between STG_SYSTEM1_TRADE_DETAILS and BUSINESS_HIERARCHY on the BUSINESS_AREA column. The view creation code should look as follows.
Create the view using the following code template (not all columns are included):
DROP TABLE IF EXISTS VW_TRADE_DENORMALIZED;
CREATE VIEW VW_TRADE_DENORMALIZED
AS
SELECT
STG_TD.TRADEID ,
STG_TD.BOOKNAME ,
STG_TD.TRADEPRODUCTTYPE ,
STG_TD.TRADEPRODSUBTYPE ,
STG_TD.BOOKINGCOUNTERPARTYID ,
STG_TD.LEGALENTITYID ,
STG_TD.MATURITYDATE ,
STG_TD.TRADEDATE ,
................
................
STG_TD.TRADELEVELSTRESSEDRWA_USD,
STG_TD.TRADELEVELCVSUNHEDGEDRWA_USD,
STG_TD.TRADELEVELCVSHEDGEDRWA_USD,
STG_TD.TOTALRWA_USD,
STG_TD.NETIR01_USD,
STG_TD.PV_USD,
BH.BUSINESSAREA,
BH.SUBPRODUCTNAME,
BH.LEVEL6NAME,
BH.LEVEL7NAME
FROM STG_SYSTEM1_TRADE_DETAILS STG_TD
LEFT OUTER JOIN BUSINESS_HIERARCHY BH
ON STG_TD.BUSINESSAREA = BH.BUSINESSAREA;
As of now, the view cannot be materialized like relational databases such as Oracle and MS SQL Server. As materialized view is nothing but a table, we can create a table in Hive if the materialized view is required.
We can persist the results of the query we just saw in a database table. Create a denormalized database table and load the data directly from SQL queries, using the following script templates:
CREATE TABLE TRADE_DFNORMALIZED .....; --We will leave this to readers imagination, as the structure will be same as above view
INSERT OVEWRITE TABLE TRADE_DFNORMALIZED
SELECT
STG_TD.TRADEID ,
STG_TD.BOOKNAME ,
STG_TD.TRADEPRODUCTTYPE ,
STG_TD.TRADEPRODSUBTYPE ,
STG_TD.BOOKINGCOUNTERPARTYID ,
STG_TD.LEGALENTITYID ,
STG_TD.MATURITYDATE ,
STG_TD.TRADEDATE ,
................
................
STG_TD.TRADELEVELSTRESSEDRWA_USD,
STG_TD.TRADELEVELCVSUNHEDGEDRWA_USD,
STG_TD.TRADELEVELCVSHEDGEDRWA_USD,
STG_TD.TOTALRWA_USD,
STG_TD.NETIR01_USD,
STG_TD.PV_USD,
BH.BUSINESSAREA,
BH.SUBPRODUCTNAME,
BH.LEVEL6NAME,
BH.LEVEL7NAME
FROM STG_SYSTEM1_TRADE_DETAILS STG_TD
LEFT OUTER JOIN BUSINESS_HIERARCHY BH
ON STG_TD.BUSINESSAREA = BH.BUSINESSAREA;
Similarly, we can create a whole new set of intermediate and final tables by using simple to complex joins, filters, groups, sort, and a majority of ANSI SQL.
The results written to the final Hive tables can be used by downstream streams for further analysis.
We will use Pig for the transformation and to store intermediate and final results, which can be used later by downstream risk and regulatory managers.
We will again follow the standard data-warehouse-type pattern—read the data from the staging directories, transform the data, and load results into intermediate and final output results directories.
If the same Pig installation is shared across multiple teams, I recommend using dedicated project directories for the scripts and intermediate or final transformed data.
Pig scripts can be stored at <default_application_directory>/EnterpriseHadoopPlatform/script/<business_transformation>.pig and the intermediate/final results can be stored on HDFS at <default_hdfs_directory>/data/output/<system name>/<subject area>/<business date>/<file_name>.
As you know, we will be receiving hundreds of trade, position, and risk data sets on HDFS and persisted for at least 7 years.
I will assume all files are delimited files unless stated otherwise, and <Business date> will be defined in YYYYMMDD format and received in the same input directories.
As soon as the trade, position, or risk files are received on HDFS, we will load the file into the staging variable for processing, as shown in the following code template:
STG_SYSTEM1_TRADE_DETAILS = LOAD '<default_hdfs_directory>/data/input/<Trading_system1>/TRADE/{$BUSINESS_DATE}'
USING PigStorage('|') AS
AS
BUSINESSAREA,
TRADEID ,
BOOKNAME ,
TRADEPRODUCTTYPE ,
TRADEPRODSUBTYPE ,
BOOKINGCOUNTERPARTYID ,
LEGALENTITYID ,
MATURITYDATE ,
TRADEDATE ,
................
................
TRADELEVELSTRESSEDRWA_USD ,
TRADELEVELCVSUNHEDGEDRWA_USD ,
TRADELEVELCVSHEDGEDRWA_USD ,
TOTALRWA_USD ,
NETIR01_USD ,
PV_USD
);
DESCRIBE STG_SYSTEM1_TRADE_DETAILS;
We will use Pig to load business hierarchy by using the following code template:
BUSINESS_HIERARCHY = LOAD '<default_hdfs_directory>/data/input/<Reference_system1>/REF/{$BUSINESS_DATE}'
USING PigStorage(',') AS
(
BUSINESSAREA,
SUBPRODUCTNAME,
..............
LEVEL6NAME,
LEVEL7NAME,
BOOKNAME
);
DESCRIBE BUSINESS_HIERARCHY;
I recommend that you to use static data like currency, instruments, and so on directly in Pig scripts if there is any need to join it with trade, position, events during data processing.
For example, if we need trade details with additional business hierarchy details, we can join both by using the following statements:
TRADE_DENORMALIZED = JOIN STG_SYSTEM1_TRADE_DETAILS BY BUSINESSAREA LEFT OUTER, BUSINESS_HIERARCHY BY BUSINESSAREA;
Just like Hive, we can persist the results of the preceding statements by using the following ones:
STORE TRADE_DENORMALIZED INTO <default_hdfs_directory>/data/output/<Trading_system1>/TRADE/{$BUSINESS_DATE}'
Pig allows the majority of data operations such as FILTER, JOIN, GROUP BY, COGROUP, and FOREACH, using which we can perform any simple to complex operations and write back the results to the output directories.
IR01 is a very important interest rate risk measure and captures the sensitivity to change in the interest rate yield curve. It is defined as the change in contract value for one basis point (0.01 percent) change.
We will calculate the total IR01 for derivative contracts grouped by certain columns very easily by using simple Pig statements.
- The assumption is that trade, event, and risk data is already collected and stored on HDFS daily business date directories
- Capture trade, event, and risk measure data using Pig, as shown in the following template (not all columns are shown here):
trades = load '<full input path>/Trade/$date' using PigStorage ('|') as (business_date, trade_id, ....);
riskmeasure = load '<full input path>/Risk/$date' using PigStorage ('|') as (business_date, trade_id, ....);
events = load '<full input path>/Event/$date' using PigStorage ('|') as (business_date, trade_id, ....);
- Filter the relevant records, using Pig as follows:
delta = filter riskmeasure by measure == 'IRDelta';
newevents = filter events by event_type == 'New'
- Join with new events by using this:
newtrades = join newevents by trade_id, trades by trade_id;
newdelta  = join newtrades by trade_id, delta by trade_id;
- Group IR01 values by required business columns, using the following:
irdeltagroup = group newdelta by (... group columns..);
newaggregatedelta  = foreach irdeltagroup generate group, sum(newdelta.value);
- Write back results to HDFS:
store newaggregatedelta into '<full output path> using PigStorage('|'), - The results are aggregated risk measures that can be viewed by risk managers
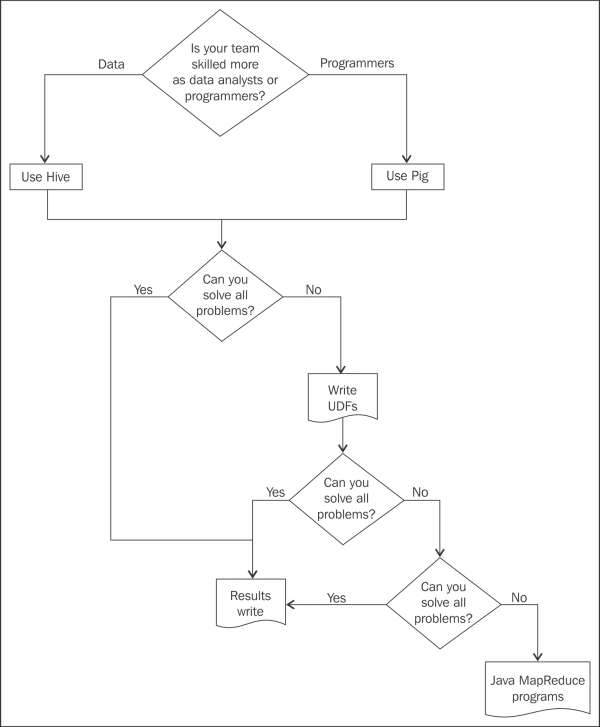
We can solve the majority of data transformation problems using Pig and Hive, with significantly lower code lines compared to Java MapReduce programs. For example, a simple word count program takes 63 code lines in Java, compared to 8 code lines in Hive. Why on earth would anyone would like to code MapReduce in Java? Well, there are a few reasons:
- If performance is the deal breaker, you will have slightly more flexibility to fine-tune the Map and Reduce programs.
- Very complex data operations with a crazy number of data sets, extreme level of loops, and tricky joins may confuse the explain plan of Pig and will be much slower than Java MapReduce. But again, this is related to performance.
- Unstructured and semistructured data, such as images, videos, audio, log data, and free-form XML, are not handled or poorly handled with Pig.
Let's take an example of creating a Java MapReduce job that we will use in the next chapter to build a fraud prediction model. Writing start-to-end working Java code is beyond the scope of this book, but we will create a template that can easily be filled up by a programmer.
A credit or debit card transaction generally has at least the following attributes:
- Transaction ID
- Customer ID
- Date and time of transaction
- Item type and description
- Vendor
- Amount
- Transaction location
We will create a Markov Chain Model that can detect abnormal or suspicious transactions:
- Each transaction row has some states—a combination of transaction amount (high/medium/low), expensive luxury category flag (yes/no), and time elapsed since last transaction (high/medium/low). We can have different variations of states and experiment to find the best combination. For our project, we will choose the three combinations of states that were mentioned a couple of lines back, which results in 3 X 2 X 3 = 18 types of transactions.
- We will analyze historical data and calculate the probability matrix of the transition from one type to another, which will give us a model of acceptable patterns for each customer.
- The first MapReduce program is to Map Phase—order transaction data (
customer id,transaction id, andtransaction type) by transaction sequence (recent first) and then Reduce phase—group by customer. The code template (developers have to fill in the specific details depending on their data specifications) follows:package org.fraud.mr; import <java libraries>; import <hadoop libraries>; public class TxnSequence { public static void main(String[] args) throws Exception { Job job = new Job(); job.setJobName("TxnSequence and grouping MR"); job.setJarByClass(TxnSequence.class); FileInputFormat.addInputPath(job, new Path(args[0])); FileOutputFormat.setOutputPath(job, new Path(args[1])); //group by job.setMapperClass(TxnSequence.TxnSequenceMapper.class); job.setReducerClass(TxnSequence.TxnSequenceReducer.class); job.setOutputKeyClass(Text.class); job.setOutputValueClass(IntWritable.class); System.exit(job.waitForCompletion(true) ? 0 : 1); } public static class TxnSequenceMapper extends Mapper<LongWritable, Text, Tuple, Text> { private Tuple outKey = new Tuple(); private Text outVal = new Text(); <…variables..> <Methods to set-up and retrieve configuration values> /* @see org.apache.hadoop.mapreduce.Mapper#map(KEYIN, VALUEIN, org.apache.hadoop.mapreduce.Mapper.Context) */ @Override protected void map(LongWritable key, Text value, Context context) throws IOException, InterruptedException { <Order by transaction sequence - OutKey, OutVal> context.write(outKey, outVal); } } public static class TxnSequenceReducer extends Reducer<Tuple, Text, NullWritable, Text> { private Text outVal = new Text(); <…variables..> <Methods to set-up and retrieve configuration values> protected void reduce(Tuple key, Iterable<Text> values, Context context) throws IOException, InterruptedException { <Group by customer id> context.write(NullWritable.get(), outVal); } } - The second MapReduce program is to calculate a probability matrix of transition from one transaction type to another transaction type. The code template (developers have to fill in the specific details depending on their requirements) follows:
package org.fraud.mr;
import <java libraries>;
import <hadoop libraries>;
import <customized utlities>
public class StateTransitionModel {

public static void main(String[] args) throws Exception {
Job job = new Job();
job.setJobName("Markov State Transition model");
job.setJarByClass(StateTransitionModel.class);
FileInputFormat.addInputPath(job, new Path(args[0]));
FileOutputFormat.setOutputPath(job, new Path(args[1]));
//group by
job.setMapperClass(StateTransitionModel.StateTransitionModelMapper.class);
job.setReducerClass(StateTransitionModel.StateTransitionModelReducer.class);
job.setCombinerClass(StateTransitionModel.StateTransitionModelCombiner.class); //readers need to explore what is a function of combiner
job.setMapOutputKeyClass(Tuple.class);
job.setMapOutputValueClass(IntWritable.class);
job.setOutputKeyClass(NullWritable.class);
job.setOutputValueClass(Text.class);
System.exit(job.waitForCompletion(true) ? 0 : 1);
}
public static class StateTransitionModelMapper extends Mapper<LongWritable, Text, Tuple, Text> {
private Tuple outKey = new Tuple();
private Text outVal = new Text();
<…variables..>
<Methods to set-up and retrieve configuration values>

@Override
protected void map(LongWritable key, Text value, Context context)
    throws IOException, InterruptedException {

<Calculate all iterations of state transition  - OutKey, OutVal>
items  =  value.toString().split(fieldDelimRegex);
        if (items.length >= (skipFieldCount + 2)) {
        for (int i = skipFieldCount + 1; i < items.length; ++i) {
        outKey.initialize();
        outKey.add(items[i-1], items[i]);
        context.write(outKey, outVal);
        }
        }
}
}
public static class StateTransitionModelReducer extends Reducer<Tuple, Text, NullWritable, Text> {
private Text outVal = new Text();
<…variables..>
<Methods to set-up and retrieve configuration values>

protected void reduce(Tuple key, Iterable<Text> values, Context context)
throws IOException, InterruptedException {
<count the total number of state transitions>
}
}
public static class StateTransitionModelCombiner extends Reducer<Tuple, IntWritable, Tuple, IntWritable> {
private int count;
private IntWritable outVal = new IntWritable();
protected void reduce(Tuple  key, Iterable<IntWritable> values, Context context)
        throws IOException, InterruptedException {
count = 0;
for (IntWritable value : values) {
count += value.get();
}
outVal.set(count);
context.write(key, outVal);
}
}
Once we have all the data into Hadoop HDFS or Hive, it can be accessed in a variety of ways by using shell commands, Hive, Pig, or business intelligence tools. As HDFS shell, Hive, and Pig have been covered already, I will touch base on the business intelligence tools.
Traditional BI tools, such as Cognos, work on the principle of aggregating data centrally into a denormalized relational data warehouse. Many of them have now developed connectors to Hive using ODBC or JDBC connections, which is some relief.
But they still fall short, compared to the new breed of BI tools such as QlikView, Tableau, Spotfire, and Revolution R, also known as big data analytics or data visualization tools. In addition to traditional BI functions, they also:
- Process data directly from Hadoop clusters, including in-memory analysis
- Are visually more appealing and easier to navigate
- Process external sources such as social media, including sentiment analysis
- Process OLTP, real-time feeds, as well as offline data
Traditional BI tools are still not able to cope up with large volumes of data. So, I advise summarizing the results on Hive and then connecting BI tools for visual representations.
Once the data has been transformed and is on Hive, dashboards and reports can be developed using BI tools.
I will demonstrate with screenshots how QlikView can connect to Hive by using an ODBC connection. If required, please visit http://www.qlik.com/ for more details.
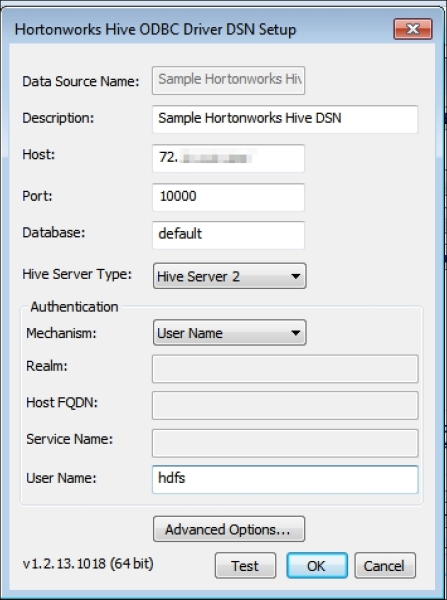
- Go to Administrative Tools and then click on Data Sources (ODBC). Choose the System DSN tab. Select Sample Hortonworks Hive DSN and then click on Configure.
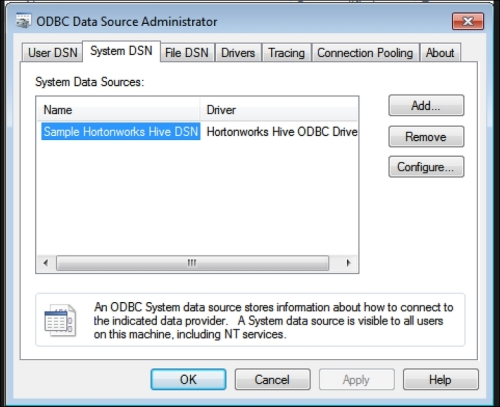
- In the Driver DNS setup window, assign your hostname and the Hive database you would like to connect.
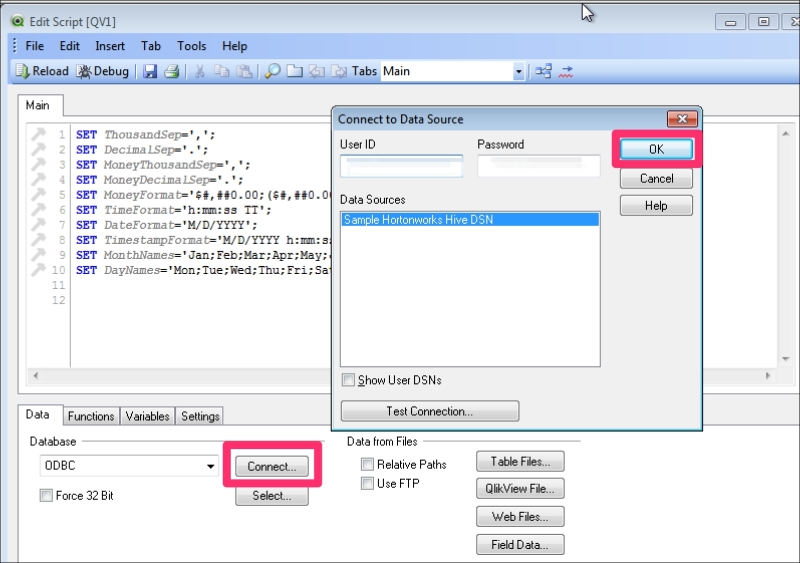
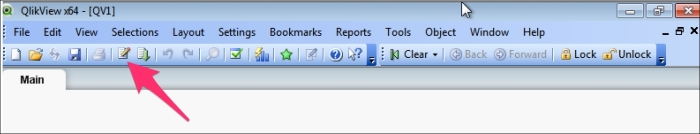
- Open QlikView and choose a new file and click on the script button:
- Under the Data tab in the script editor, choose ODBC and click on Connect. In the next window, type in your username and password and then choose the data source and click on OK. Congratulations, you are now connected to your Hive database.