
You can manage a Solr installation using any of the several system administration tools provided with Solr. The system administration tools include the Administration Console, the REST services, and the JMX API, with which you manage and monitor cores, hardware resources, runtime configuration, and the health of the Solr environment to ensure maximum availability and performance.
Although the topic of administration is usually outside the scope of a developer sphere, most probably you, as a provider of a solution based on Solr, will need to know something about it. Specifically, you need to know about a set of tools that let you monitor Solr, tune it, and investigate troubles.
Throughout this chapter, we will use a Solr instance preloaded with sample data. In order to have that up and running, you should check out the source code of the book, go to the ch5 folder, and run this (using Eclipse or from the command-line):
# mvn clean install cargo:run
This chapter will describe the most relevant sections of the Solr administration console. We will also explore the JMX API. Each time a hardware resource is involved, we will talk about it. Specifically, this chapter will cover the following topics:
- The Solr Administration Console
- Usage of hardware resources
- JConsole and JMX
The Administration Console is a web application that is part of Solr. You can access the Administration Console from any machine on the local network that can communicate with Solr, through a web browser.
Type http://127.0.0.1:8983/solr on the web browser's address bar. The first page that appears is the dashboard, as shown in the following screenshot:
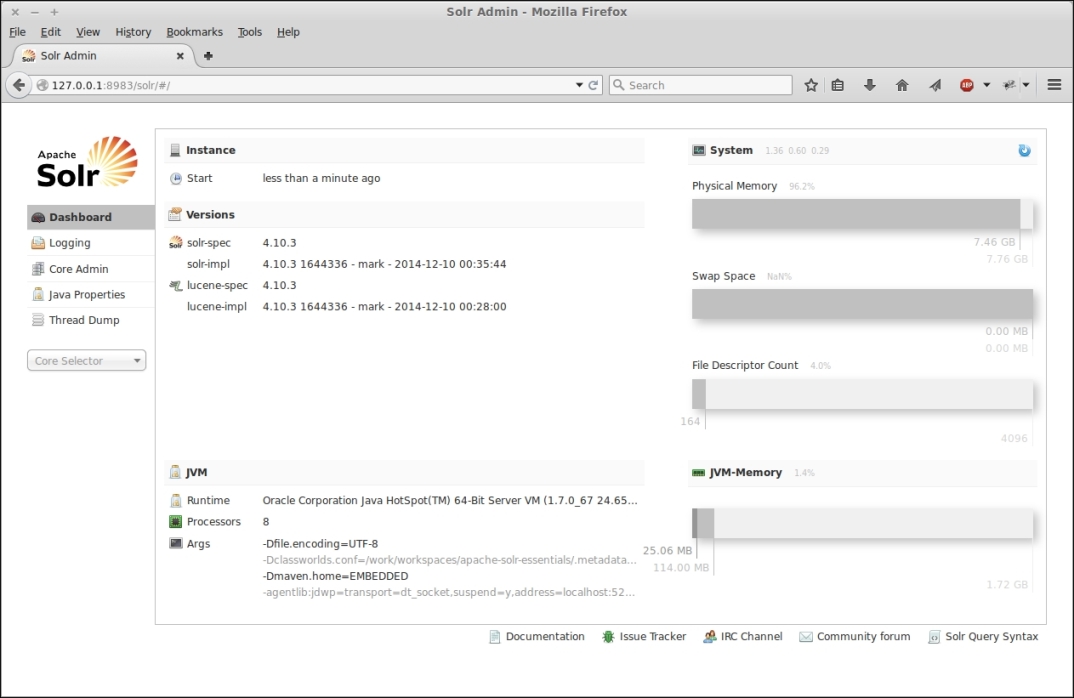
This is where you can see general information about Solr (for example, the version, startup time, and so on) and about its hosting environment (for example, JVM version, JVM args, processors, physical and JVM memory, and file descriptors).
The first and the last gray bars on the right side of the dashboard represent the physical and JVM memory, respectively. The first measure is the amount of the memory that is available in the hosting machine. The second measure is the amount assigned to the JVM at startup time by means of the –Xms and –Xmx options.
Tip
For a complete list of available JVM options, see https://docs.oracle.com/cd/E22289_01/html/821-1274/configuring-the-default-jvm-and-java-arguments.html.
Each bar reports both the available amount and used amount of memory. As you can imagine, memory is one of the crucial factors concerning Solr performance and response times.
When we think about a web application, we may consider it as a standalone container that, for example, reads data from an external database and shows some dynamic pages to the end users. Solr is not like that; it is a service. Despite its web-application-like nature, it makes extensive use of local hardware resources such as disk and memory.
Memory (here, I'm referring to the JVM memory) is used by Solr for a lot of things (for example, caches, sorting, faceting, and indexing) so understanding all those mechanisms is crucial to determine the right amount of memory one should assign to the JVM.
Note
There's a useful spreadsheet (although we already mentioned this in the first chapter) that you can find in the Solr source repository at https://svn.apache.org/repos/asf/lucene/dev/trunk/dev-tools/size-estimator-lucene-solr.xls. It is a good starting point from which to estimate RAM and disk space requirements.
However, a resource that is often considered as external to the Solr domain is the system memory, that is, the remaining memory available for the operating system once the JVM memory has been deducted.
In an optimal situation, that kind of memory should be enough to:
- Let the operating system manage its resources.
- Accommodate the Solr index. Ideally, if it is able to contain the whole index, there won't be any disk seek.
The first point is quite obvious; an operating system needs a given amount of memory to manage its ordinary tasks.
The second point has to do with the so-called (OS) filesystem cache. The JVM works directly with the memory that we made available in the startup command-line by means of the –Xms and –Xmx options. This is the memory we are using in our Java application to load object instances, implement application-level caches, and so on.
However, applications such as Solr that widely use filesystem resources (to load and write index files) also rely on another important part of the memory that is available for the operating system and is used to cache files. Once a file is loaded, its content is kept in memory until the system requires that space for other purposes. Data in this filesystem cache provides quick access, without requiring disk accesses and seeks.
As you can imagine, this aspect can dramatically improve overall performance in both index (writes) and query (reads) phases. In those cases where it's not possible to fit all of the index in the filesystem cache (the index can easily reach a size that is relatively small in terms of disk space but definitely huge in terms of memory), the system memory should be enough to allow efficient load and unload management of that filesystem cache.
The dashboard page reports information about the swap space, but it says nothing about disk usage. This is because that kind of information is reported in a dedicated section for every managed core. Unfortunately, there isn't a central point where it's possible to see the total disk space used by the instance.
As described in the previous section, the disk is a resource widely used by Solr, and its role is fundamental for getting optimal performance. Here, we can add additional information by mentioning Solid State Disks (SSD), which are usually a very good choice for getting fast reads and writes. But again, the most critical factor is understanding and tuning the filesystem cache; in the most extreme cases, this entirely avoids disk seeks at all. To put it in a nutshell SSDs are fast, but memory is better.
The third bar (shown in the previous screenshot) shows the maximum number (light gray) and the effective opened (dark gray) file descriptors associated with the Java process that runs Solr (that is, the Java process of your servlet container).
A Solr index can be composed of a lot of files that need to be opened at least once. Especially if you have many cores, frequent changes, commits, and optimizes, the incremental nature of a Solr index can lead to exhaustion of all the available file descriptors. This is usually the case where you get an IOException (too many open files).
The first place where you can manage and limit the number of files used by Solr is Solr itself. Within the solrconfig.xml file, you'll find a <mergeFactor> parameter in the <indexConfig> section. This parameter decides how many segments will be merged at a time.
The Solr/Lucene index is composed of multiple subindexes called segments. Each segment is an independent index composed of several files. When documents are added, updated, or deleted, Solr asynchronously persists those changes by creating new segments or merging existing segments. This is the reason the total number of files compounding the index will necessarily change (it changes gradually, following a reasonable amount of changes applied to your dataset). Hence, it needs to be monitored.
With a mergeFactor value set to 10 (the default value) there will be no more than nine segments at a given moment. When update thresholds (the maxBufferedDocs or ramBufferSize parameters) are reached, a new segment will be created. If the total number of segments is equal to the configured mergeFactor, Solr will attempt to merge all existing segments into a new segment.
Another parameter in the solrconfig.xml file that has an impact on the number of open files is <useCompoundFile>. If this is set to true (note that it defaults to false), Solr will combine the files that make up a segment into a single file. While that may produce a benefit in terms of open file descriptors, it may also lead to some performance issues because of the monolithic nature of the compound file.
On top of that, there are scenarios where a lot of files are the natural consequence of your infrastructure. Think of a system with several cores, for example. The previous settings are specific to a single core, but what if you have a lot of them?
Tip
When I use Solr for library search services, I usually create at least six cores: one for the main index, one that holds the headings used for the autocompletion feature, and one for each alphabetical index (for example, authors, titles, subjects, and publishers). There are some customers who require up to 50 alphabetical indexes (which means up to 50 cores).
In such cases, after checking out your application and seeing that it effectively requires more file descriptors than the default (usually 1024), you may want to increase that limit by using the ulimit command, as follows:
# ulimit –n 5000
Here, 5000 is the new limit. Note that this command requires root privileges and it applies that limit only to the current session. If you want it to be permanent, that value has to be configured in the /etc/security/limits.conf configuration file.