
You might have used tools such as Valgrind for memory debugging. LLVM also provides us with tools for memory debugging, such as the address sanitizer, memory sanitizer, and so on. These tools are very fast compared to Valgrind, even though they are not as mature as Valgrind. Most of these tools are in their experimental stage, so if you want, you can contribute to the open source development of these tools.
To make use of these sanitizers, we need to check out the code for compiler-rt from the LLVM SVN:
cd llvm/projects
svn co http://llvm.org/svn/llvm-project/compiler-rt/trunk compiler-rt
Build LLVM as we did in Chapter 1, LLVM Design and Use. By doing so, we get the runtime libraries required.
Now, we will test the address sanitizer on a test code.
- Write a test case to check the address sanitizer:
$ cat asan.c
int main() {
int a[5];
int index = 6;
int retval = a[index];
return retval;
}
- Compile the test code using the
fsanitize=addresscommand-line argumentfor using the address sanitizer:$ clang -fsanitize=address asan.c - Generate the output of running the address sanitizer using the following command:
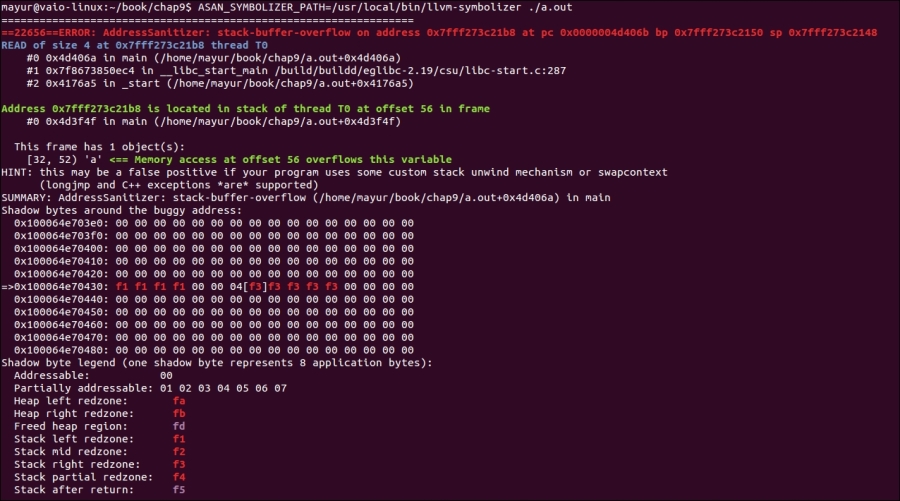
$ ASAN_SYMBOLIZER_PATH=/usr/local/bin/llvm-symbolizer ./a.outHere's the output:
The LLVM address sanitizer works on the principle of code instrumentation. The tool consists of a compiler instrumentation module and a runtime library. The code instrumentation part is done by the pass of LLVM, which runs on passing the fsanitize=address command-line argument, as is done in the preceding example. The runtime library replaces the malloc and free functions in the code with custom-made code. Before we go ahead and discuss the details of how code instrumentation is done, here we must know that the virtual address space is divided into two disjointed classes: the main application memory, which is used by the regular application code; and the shadow memory, which contains the shadow values (or metadata).
The shadow memory and the main application memory are linked to each other. Poisoning a byte in the main memory means writing a special value into the corresponding shadow memory.
Let's come back to the address sanitizer; the memory around the regions allocated by the malloc function is poisoned. The memory freed by the free function is placed in quarantine and is also poisoned. Every memory access in the program is transformed by the compiler in the following way.
At first, it is like this:
*address = ...;
After transformation, it becomes the following:
if (IsPoisoned(address)) {
  ReportError(address, kAccessSize, kIsWrite);
}
*address = ...;
This means that if it finds any invalid access to this memory, it reports an error.
In the preceding example, we wrote a piece of code for a buffer overrun, accessing an array that is out of bounds. Here, the instrumentation of code is done on the address just before and after the array. So, when we access the array beyond its upper bound, we try accessing the red zone. Hence, the address sanitizer gives us a stack buffer overflow report.
- You can check out the documentation page at http://clang.llvm.org/docs/AddressSanitizer.html for more information.
- You can also check out the other sanitizers in LLVM using the following links:
http://clang.llvm.org/docs/MemorySanitizer.html
http://clang.llvm.org/docs/ThreadSanitizer.html
https://code.google.com/p/address-sanitizer/wiki/LeakSanitizer