
The LLVM IR control flow graph can be visualized using the GraphViz tool. It gives a visual depiction of the nodes formed and how the code flow follows in the IR generated. Since the important data structures in LLVM are graphs, this can be a very useful way to understand the IR flow when writing a custom pass or studying the behavior of the IR pattern.
- To install
graphvizon Ubuntu, first add itspparepository:$ sudo apt-add-repository ppa:dperry/ppa-graphviz-test - Update the package repository:
$ sudo apt-get update - Install
graphviz:$ sudo apt-get install graphviz
- Once the IR has been converted to DAG, it can be viewed in different phases. Create a test.ll file with the following code:
$ cat test.ll
define i32 @test(i32 %a, i32 %b, i32 %c) {
  %add = add nsw i32 %a, %b
  %div = sdiv i32 %add, %c
  ret i32 %div
}
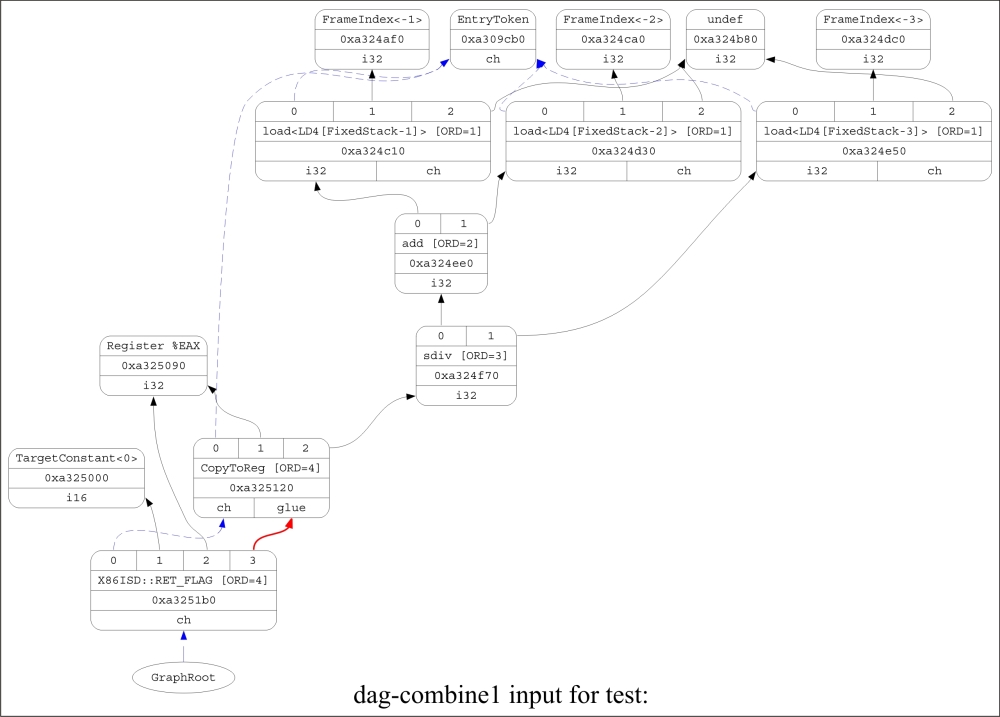
- To display the DAG after it is built, before the first optimization pass, enter the following command:
$ llc -view-dag-combine1-dags test.llThe following diagram shows the DAG before the first optimization pass:
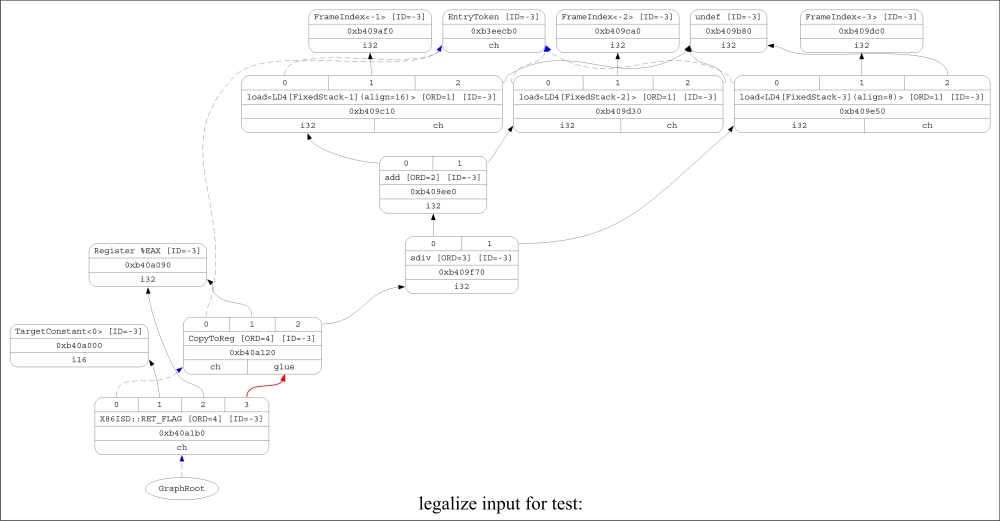
- To display the DAG before legalization, run this command:
$ llc -view-legalize-dags test.llHere is a diagram that shows the DAG before the legalization phase:
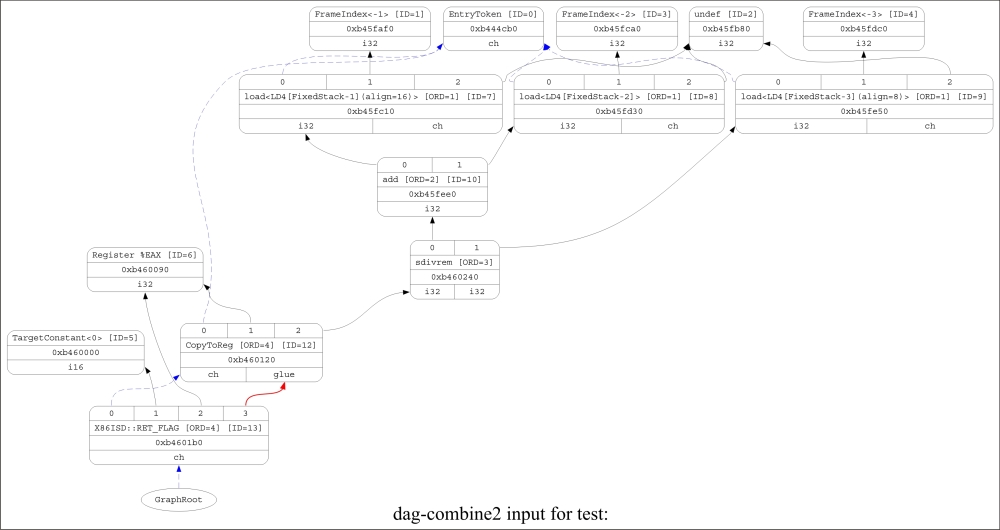
- To display the DAG before the second optimization pass, run the following command:
$ llc -view-dag-combine2-dags test.llThe following diagram shows the DAG before the second optimization pass:
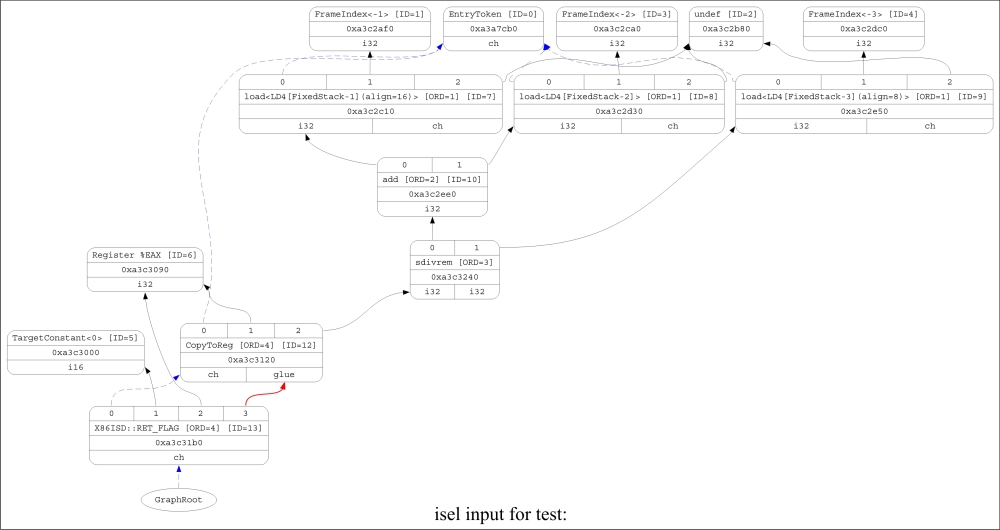
- To display the DAG before the selection phase, enter this command:
$ llc -view-isel-dags test.llHere is a diagram that shows the DAG before the selection phase:
- To display the DAG before scheduling, run the following command:
$ llc -view-sched-dags test.llThe following diagram shows the DAG before the scheduling phase:
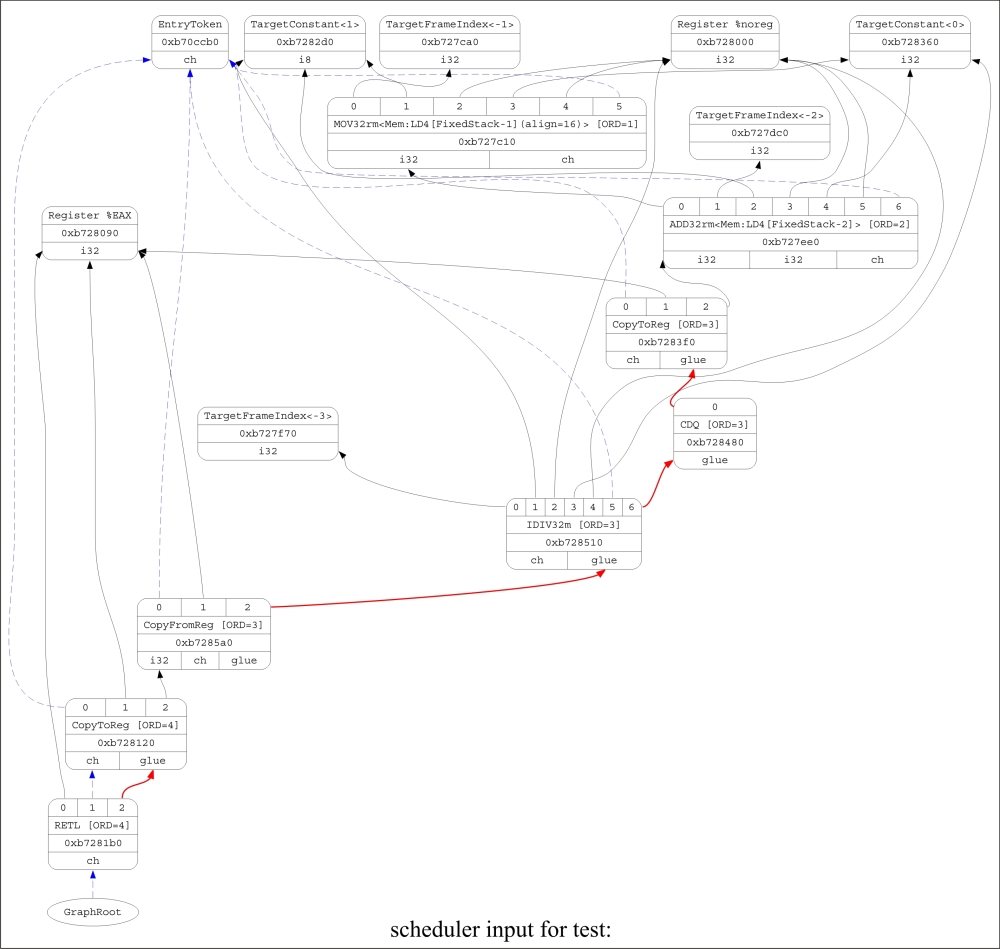
- To display the scheduler's dependency graph, run this command:
$ llc -view-sunit-dags test.llThis diagram shows the scheduler's dependency graph:
Notice the difference in the DAG before and after the legalize phase. The sdiv node has been converted into an sdivrem node. The x86 target doesn't support the sdiv node but supports the sdivrem instruction. In a way, the sdiv instruction is illegal for the x86 target. The legalize phase converted it into an sdivrem instruction, which is supported by the x86 target.
Also note the difference in the DAG before and after the instruction selection (ISel) phase. Target-machine-independent instructions such as Load are converted into the MOV32rm machine code (which means, move 32-bit data from the memory to the register). The ISel phase is an important phase that will be described in later recipes.
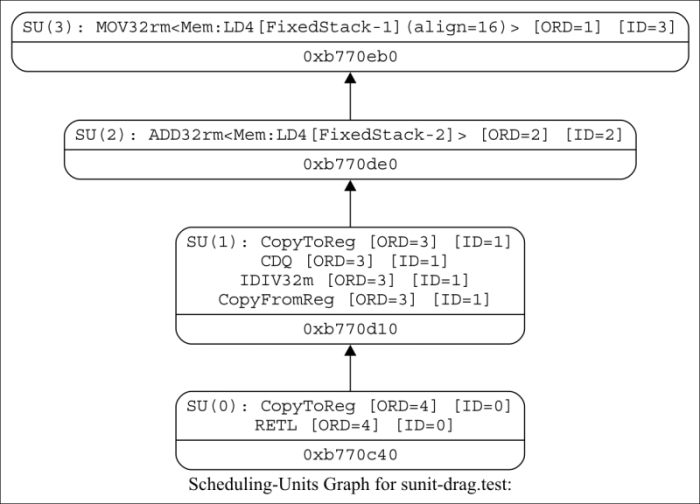
Observe the scheduling units for the DAG. Each unit is linked to other units, which shows the dependency between them. This dependency information is very important for deciding scheduling algorithms. In the preceding case, scheduling unit 0 (SU0) is dependent on scheduling unit 1 (SU1). So, the instructions in SU0 cannot be scheduled before the instructions in SU1. SU1 is dependent on SU2, and so is SU2 on SU3.
- For more details on how to view graphs in debug mode, go to http://llvm.org/docs/ProgrammersManual.html#viewing-graphs-while-debugging-code