
23
The Correlation Between Oxygen Consumption and Excretion of Carbon Dioxide in the Human Respiratory Cycle
General anesthesia and lung damage treatment in novel coronavirus infection and other diseases with mechanical ventilation often require strict monitoring of oxygen delivery (DO2) and consumption (VO2), as well as CO2 exhalation rate (VCO2). Oxygen transport consistency can be easily monitored in real time by means of percutaneous pulse oximetry via the level of blood oxygen saturation in pulsatile flow (SpO2). The method is based on the difference of absorbed light wavelength by the blood in red and infrared parts of the spectrum, dependent on the number of O2 molecules captured by hemoglobin. The control of the O2 content in the inhaled and exhaled air, and the respiratory removal of CO2 can be carried out using paramagnetic or fuel cell and infrared absorption sensors, respectively. Acoustic, thermal, magnetic, ionization and other types of gas analyzers based on the change in the relevant properties of the measured gases, depending on their concentration in the mixture, are also used. The algorithm for real-time VO2 and VCO2 measurements includes the numerical integration of dVO2/dt and dVCO2/dt instantaneous values during respiratory cycle, derived from the product of certain gas concentration and total flow instantaneous values. The report discusses such an approach, emphasizing (i) precision gas concentration and flow signal synchronization and (ii) taking into account air humidification in the respiratory tract.
23.1. Introduction
Artificial lung ventilation (ALV) – a method aimed at maintaining gas exchange between the external environment and the body (external respiration), when the body on its own cannot provide this process – is reasonably effective. An example is the use of this technique during general anesthesia, as well as in the treatment of respiratory distress, which is a complication of many diseases, including the infamous coronavirus infection. The probability of developing hypoxia decreases, and the gas composition of the blood is normalized, with the timely start of respiratory support (Vasilev et al. 2015).
The state of the body systems responsible for gas exchange can vary as a result of the dynamics of the pathological process and as a result of changes in physiological parameters. So, it means that for an effective management of patients on ALV, constant monitoring of the functions of external respiration is required (Petrova et al. 2014).
Of the main parameters registered for respiratory monitoring, the capnogram can be highlighted, which allows us to estimate the partial pressure of carbon dioxide in the respiratory mixture, as well as the flow graph, which shows the rate of flow change and is measured in liters per minute (Vasilev et al. 2015).
There are many parameters that can be used to assess the interaction between the ventilator and the patient, including data on flow, pressure, breathing volume and frequency, the ratio of inhalation and exhalation, etc. So far, however, until now, in the ordinary arsenal of a doctor’s practice, there are no parameters that allow us to sufficiently assess the effectiveness of external respiration on the monitor. This assessment requires data on the amount of oxygen uptaking and emitted carbon dioxide. Nonetheless, the possibilities of obtaining the necessary data exist. The use of a metabolograph could be taken as an example. A metabolograph is a module that integrates an artificial lung ventilation machine and allows you to calculate the amount of energy consumed by the patient, which makes it possible to select the daily kcal intake. Operation principle is based on the calculation of indirect calorimetry, for which the data of carbon dioxide emission and oxygen absorption are required, which is implemented in this device (Petrova et al. 2014). Therefore, this device can be used to configure an artificial lung ventilation machine and select the best values that ensure maximum gas exchange efficiency (Mihnevich and Kursov 2008).
Since the device was not originally intended for adjusting the parameters of artificial respiration, its vitals do not meet all the necessary requirements; in particular, the indicators of gas emission and absorption are averaged and have a display delay. These features strongly limit the use of this device by physicians when setting up an artificial lung ventilation machine. The efficiency of external respiration is an important task that is proposed to be solved by monitoring in real time the concentration of oxygen and carbon dioxide in the inhaled and exhaled gas mixtures (Naumenko et al. 2018).
23.2. Respiratory function physiology: ventilation–perfusion ratio
To obtain a sufficient amount of energy, the cells need oxygen, which they receive from the blood, and it enters the blood from the external environment. In the process of obtaining energy, carbon dioxide is formed, which must be removed from the body (Gabdulkhakova et al. 2016). The process of exchange of gas molecules between the external environment and the body is called external respiration, in which the lungs play the main role, which are located in a sealed pleural cavity. The lungs provide contact between the blood and a mixture of gas from the external environment in special alveolar sacs, which have an extremely thin wall. The gas mixture enters the alveoli through the air-conducting system – the bronchi and bronchioles. Blood flows through the arteries, which are divided into capillaries at the alveoli and then collected into the veins (Figure 23.1).
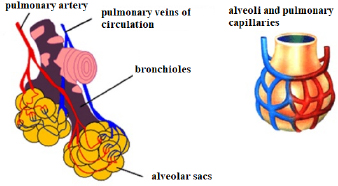
Figure 23.1. The structure of the human bronchus. Source: https://cinetoday.ru/breast/dyhatelnaya-sistema-cheloveka-ege-chelovek-organy-sistemy-organov. For a color version of this figure, see www.iste.co.uk/zafeiris/data1.zip
The mechanics of breathing are provided by the breathing movements of the thorax and diaphragm. The volume of the thorax increases with inspiration, due to the contraction of the intercostal muscles and the flattening of the diaphragm. Due to this, pleural pressure is reduced. The atmospheric pressure in the alveoli stretches the lungs; as a result, the pressure in the lungs begins to drop below atmospheric pressure. This difference ensures the flow of air into the lungs – inhalation. Exhalation occurs according to similar mechanisms, but in the opposite direction. The main difference is that when inhaling, the driving force is muscle contraction, and when exhaling, it is the stored elastic traction in the fibers of the lungs and thorax. As soon as the muscles relax, the lungs and thorax, like a spring, decrease in volume, which leads to an increase in pleural and alveolar pressures and the pressure rises above atmospheric, and the resulting flow is directed outward (Gutsol et al. 2014).
This breathing mechanics ensures a constant renewal of the composition of the gas mixture in the alveoli. But for effective gas exchange, it is also necessary to constantly renew the composition of its second component – blood. The flow of blood within an organ is called perfusion.
Each alveolus has its own characteristics of ventilation and perfusion; therefore, the ratio of ventilation and perfusion may be different in different parts of the lungs. This may lead to the conclusion that even in a normal state, the ventilation of the lungs may have some unevenness. With the pathology of the respiratory system, for example, in inflammatory processes, the degree of ventilation inequalities of different alveoli increases. It is necessary to constantly maintain an effective ratio of ventilation and perfusion in the lungs in order to ensure effective gas exchange. The structure of the respiratory system is aimed at maintaining the required ratio of ventilation and perfusion, if there are no pathologies
23.3. The basic principle of operation of artificial lung ventilation devices: patient monitoring parameters
Artificial lung ventilation (ALV) – a piece of equipment that simulates external respiration – forcibly delivers a gas mixture to the alveoli and removes the used gas from the lungs (Chursin 2008).
As mentioned earlier, the natural mechanism of human breathing is based on the difference in pressure and muscle contraction. That is, autonomous breathing is NPV (negative pressure ventilation), since during inhalation, the pressure in the lungs is below atmospheric. Artificial ventilation devices based on the NPV principle exist, but their designs are rather cumbersome, although physiological.
The devices used in intensive care and in resuscitation rooms are implemented on the principle of PPV (positive pressure ventilation), i.e. the pressure of the gas mixture in the lungs during inhalation is higher than the atmospheric pressure.
Ventilation techniques can vary in end-expiratory pressure:
- 1) ZEEP (zero end expiratory pressure) – at the end of exhalation, the pressure drops to atmospheric;
- 2) PEEP (positive end expiratory pressure) – at the end of exhalation, the pressure does not drop to atmospheric (Goryachev and Savin 2019).
3) Also, ventilators can differ in the principle of switching from inhalation to exhalation and back:
- 1) Ventilation devices or modes with tidal volume control – the device controls the time of the phases of the respiratory cycle – inspiration and expiration (“in frequency”), while within the estimated time for inspiration, the equipment calculates the speed with which it is necessary to deliver a given tidal volume to the patient’s lungs.
- 2) Ventilation devices or modes with pressure control during inspiration – the device also works “in frequency”, but in this case, the equipment is at a certain speed and before reaching the set pressure in the lungs injects the tidal volume, measuring its value.
It is necessary to select certain parameters when connecting a patient to a ventilator.
On the equipment, the doctor needs to configure parameters:
- –the value of the tidal volume;
- –respiratory rate;
- –concentration of oxygen in the gas mixture;
- –ensuring control of the pressure value at the inspiratory height (Goryachev and Savin 2019).
Further, the physician must maintain strict control over the delivery of oxygen, its consumption and the carbon emissions.
Oxygen transfer can be monitored in real time by using percutaneous pulse oximetry.
Pulse oximetry is based on two phenomena:
- 1) Oximetry – hemoglobin absorbs a specific wavelength of light differently when passing through tissues, depending on the grade of oxygenation.
- 2) Pulse wave – the pulsation of the arteries and arterioles corresponds to the stroke volume of the heart.
The principle of oximetry is based on the fact that oxygenated hemoglobin and deoxyhemoglobin absorb the red and infrared (IR) parts of the spectrum differently. Oxyhemoglobin absorbs IR radiation well, while deoxyhemoglobin absorbs red light intensively. Saturation (SO2) is the grade of oxygen saturation of the blood, determined by the ratio of red and IR streams that have come from the source to the photodetector through a tissue site. The pulse wave can be used to determine the heart rate and assess the quality of peripheral blood flow (Lapitsky 2015).
Gas exchange can be monitored using data from gas analyzers which uses different types of sensors: paramagnetic, fuel cells, IR absorption sensors, etc. The indirect calorimetry, which was carried out by the metabalograph, has its own difficulties for continuous gas analysis. Data on oxygen consumption and carbon dioxide emission by the body are not registered in real time, but it is necessary to control these parameters.
23.4. The algorithm for monitoring the carbon emissions and oxygen consumption
Treatment of lung damage in coronavirus infection with the use of artificial ventilation and surgery under general anesthesia requires strictly monitoring of the consumption and transport of O2, as well as the excretion of CO2 in the patients’ respiratory cycle. Oxygen transport can be easily monitored in real time by means of percutaneously pulse oximetry based on the level of arterial oxygen saturation.
The control of the O2 content in the inhaled and exhaled air, and the respiratory removal of CO2 can be carried out using inertial mechanical gas analyzers based on the separation of a component from the gas mixture by special absorbers and measuring changes in the sample volume at constant pressure, or pressure at a constant volume of the measuring chamber.
So, the data from the metabolograph cannot be used for continuous monitoring of oxygen consumption and carbon dioxide emission in real time. This means that the task arises of implementing an algorithm that will allow solving this problem.
Operations research of synchronous data of current monitoring: indicators of air flow velocity in the patient respiratory cycle and time capnogram for measuring the partial pressure of CO2 released by the body in the exhaled air mixture are more adequate to the clinical conditions of intensive care units. Based on this data, it is possible to create an algorithm and code that allows us to realize real-time control of oxygen consumption by the body and the removal of carbon dioxide by it.
The capnogram shows the partial pressure of carbon dioxide over time, but for further calculations of volumes, we need to know the concentration of carbon dioxide. To find it, it is worth referring to the definition of partial pressure and the formula for calculating it.
Partial pressure is the pressure that would be produced by a gas that is part of a mixture of gases if it alone at a given temperature occupies a volume filled with the entire mixture of gases.
If the gas content in parts or percent and the total pressure of the mixture are known, then the partial pressure of the gas entering the gas mixture can be determined.
The equation for calculating the partial pressure is as follows:
where p1 is the partial pressure of a gas, а is the gas content of the mixture in % and Pgeneral is the gas mixture pressure.
This equation can be used to find an array of values for the amount of carbon dioxide in a mixture in parts:
where PrCO2 is the instantaneous values of the amount of carbon dioxide in parts, CO2 is the instantaneous values of the partial pressure of carbon dioxide and Pair is the gas mixture pressure equal to atmospheric.
In addition, we need Dalton’s law.
According to this law, the total pressure of a mixture of gases is equal to the sum of the partial pressures of the mixture.
Based on this, we can find the partial pressure of nitrogen, provided that the initial data on the partial pressures of oxygen and carbon dioxide of the supplied gas mixture are known:
where O2(1) and CO2(1) are the values of the partial pressure of oxygen and carbon dioxide in the mixture, respectively, and N is the partial pressure of nitrogen (Petrovsky 1988).
Also, using the equation for partial pressure, you can find the amount of nitrogen in parts:
where PrN is the amount of nitrogen in parts and N is the partial pressure of nitrogen.
And taking advantage of the fact that there are only three gases in the mixture, find through the difference an array of instantaneous values for the amount of oxygen in parts:
where PrO2 is the instantaneous values of the amount of oxygen in parts, PrCO2 is the instantaneous values of the amount of carbon dioxide in parts and PrN is the amount of nitrogen in parts.
The algorithm for real-time VO2 and VCO2 measurements includes the numerical integration of dVO2/dt and dVCO2/dt instantaneous values during respiratory cycle, derived from the product of a certain gas concentration and total flow instantaneous values.
To implement the work function, it is necessary to synchronize the data of the capnogram and the flow graph.
The initial data were presented graphically (Figure 23.2).
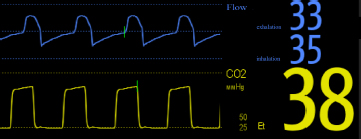
Figure 23.2. Graph of flow and capnogram. For a color version of this figure, see www.iste.co.uk/zafeiris/data1.zip
Accordingly, the data was digitized and brought to a form with which it was possible to work further.
23.5. Results
The results of the implementation of this algorithm are two integrated quantities, as well as their graphs.
The result of the first integration (Int1) is the difference between the volume of the inhaled and exhaled oxygen. That is, the amount of oxygen decreased in the exhaled air in comparison with the inhaled air by 11.3957 ml according to the calculations.
The result of the second integration (Int2) is the difference between the volume of the inhaled and exhaled carbon dioxide, and the volume of carbon dioxide increased in the exhaled air relative to that inhaled by 8.5367 ml.
In addition to calculating the amount of oxygen consumed and carbon dioxide emitted, this code plots the flow of oxygen and carbon dioxide during the inhalation–exhalation cycle (Figures 23.3 and 23.4).
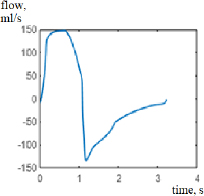
Figure 23.3. Oxygen flow graph
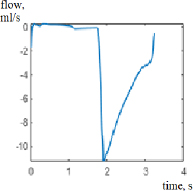
Figure 23.4. Carbon dioxide flow graph
23.6. Conclusion
The main conclusions of this work are as follows:
- 1) There is a need to develop an algorithm for gas analysis using continuous monitoring of oxygen consumption and carbon dioxide emitted in real time.
- 2) The algorithm developed on the basis of the analysis of the synchronous data of the capnogram and the flow of the gas mixture makes it possible to assess whether the input parameters of the mechanical ventilator were correctly selected and, in the case of deviation of the analyzed values, to correct these parameters and find the optimal values for a particular patient so that the ratio of ventilation and perfusion was corresponding to the norm.
23.7. References
Chursin, V.V. (2008). Artificial Lung Ventilation. Tutorial, Almaty.
Gabdulkhakova, I.R., Shamratova, A.R., Insarova, G.E. (2016). Respiratory physiology. Tutorial, Federal State Budgetary Educational Institution of Higher Education Bashkir State Medical University, Ufa.
Goryachev, A.S. and Savin, I.A. (2019). The basics of artificial lung ventilation, Guide for doctors. N.N. BURDENKO National Scientific and Practical Center for Neurosurgery of the Ministry of Healthcare of the Russian Federation, Moscow.
Gutsol, L.O., Nepomnyashchikh, S.F., Korytov, L.I. (2014). Physiological and pathophysiological aspects of external respiration. Tutorial, Federal State Budgetary Educational Institution of Higher Education Irkutsk State Medical University, Irkutsk.
Lapitsky, D.V. (2015). Diagnostic capabilities of non-invasive monitoring of arterial blood hemoglobin saturation with oxygen in the clinic of internal diseases. Tutorial, Belarusian State Medical University, Minsk.
Mihnevich, K.G. and Kursov, S.V. (2008). Acute respiratory failure, methodical instructions. Kharkiv National Medical University, Kharkov.
Naumenko, Z.K., Chernyak, A.V., Neklyudova, G.V., Chuchalin, A.G. (2018). Ventilation/perfusion ratio. Practical Pulmonology, 4, 86–90.
Petrova, M.V., Butrov, A.V., Bikharri, S.D., Storchay, M.N. (2014). Monitoring of metabolism in patients with critical conditions, effective pharmacotherapy. Anesthesiology and Resuscitation, 2, 8–12.
Petrovsky, B.V. (1988). Big Medical Encyclopedia, 3rd edition. Soviet Encyclopedia, Moscow.
Vasilev, D.V., Baklakov, A.A., Kim, V.A., Kozhakhmetov, B.A., Loshik, R.V., Sklyarov, V.V. (2015). Monitoring of ventilation function of the lungs in patients in intensive care. Medicine and Ecology, 4, 80–82.
Chapter written by Anatoly KOVALENKO, Konstantin LEBEDINSKII, and Verangelina MOLOSHNEVA.