
Okay, we've coded up a command with a circuit breaker, and given it a fallback command in the event the remote service is down. But how can we monitor it? Simply put--how can we detect if the circuit is open or closed?
Introducing the Hystrix Dashboard. With just a smidgeon of code, we can have another Spring Boot application provide us with a graphical view of things. And from there, we can test out what happens if we put the system under load, and then break the system.
To build the app, we first need to visit http://start.spring.io, and select Hystrix Dashboard and Turbine. If we also select Gradle and Spring Boot 2.0.0, and enter in our similar artifact details, we can produce another app. (Notice how handy it is to simply let everything be a Spring Boot app?)
The build file is the same except for these dependency settings:
    buildscript {
      ext {
        springBootVersion = '2.0.0.M5'
        springCloudVersion = 'Finchley.M3'
      }
      ...
    }
    ...
    dependencies {
      compile('org.springframework.cloud:spring-cloud-starter-
       hystrix-dashboard')
    }

    dependencyManagement {
      imports {
        mavenBom "org.springframework.cloud:spring-cloud-
         dependencies:${springCloudVersion}"
      }
    }
We can explain this preceding build file as follows:
- We pick up spring-cloud-starter-hystrix-dashboard to build a UI for monitoring circuits
- Again, we select Spring Cloud's Finchley BOM release with the dependencyManagement settings
To display the Hystrix dashboard, this is all we need:
    @SpringBootApplication
    @EnableHystrixDashboard
    public class LearningSpringBootHystrixDashboard {

      public static void main(String[] args) {
        SpringApplication.run(
          LearningSpringBootHystrixDashboard.class);
      }
    }
This previous tiny application can be described as such:
- @SpringBootApplication declares this to be a Spring Boot application. We don't need @SpringCloudApplication, because we don't intend to hook into Eureka, nor institute any circuit breakers.
- @EnableHystrixDashboard will start up a UI that we'll explore further in this section.
- The class public static void main is used to launch this class.
To configure this service, we need the following settings:
    server:
      port: 7979
Hystrix Dashboard is usually run on port 7979.
With this in place, let's launch the application and take a peek. To see the dashboard, we must navigate to http://localhost:7979/hystrix:

Here we have a pretty simple interface, as seen in the preceding screenshot. It tells us we have options regarding what we want to view. The simplest variant is to have the dashboard look at one microservice's collection of circuits. This preceding screenshot shows the URL for the images service, the one we wrote a @HystrixCommand for.
Since each microservice that has @EnableCircuitBreaker (pulled in via @SpringCloudApplication) has a /hystrix.stream endpoint outputting circuit metrics, we can enter that service's URL.
After clicking Monitor Stream, we can see this nice visual display of our single circuit:
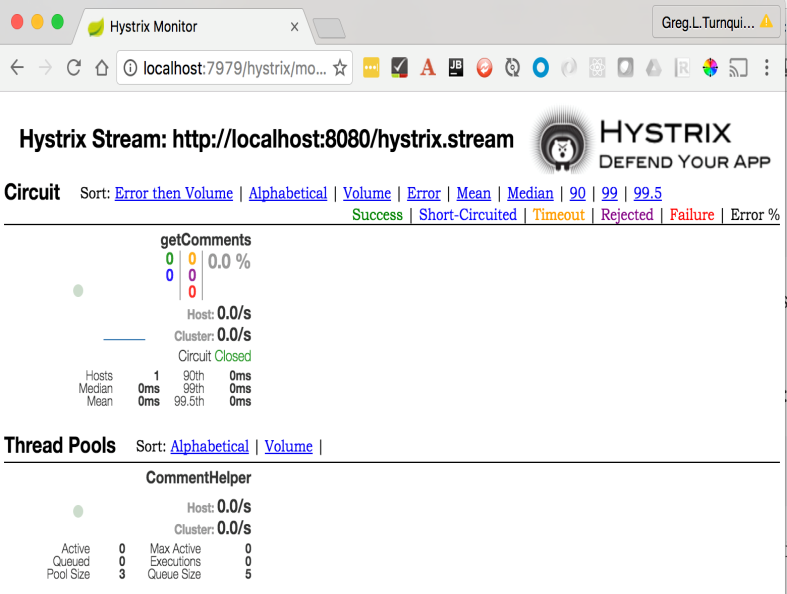
There's a lot on the preceding screen, so let's break it down:
- Across the top is the ability to sort various circuits based on different criteria. We only have one circuit, so it's not that important.
- getComments is shown underneath Circuit. The color coding of the numbers runs across the top, from Success to Failure, with everything currently showing 0.
- There is an overall failure percentage (also at 0%).
- There is a rate of activity for the host and for the cluster (also at 0/second).
- It may be hard to spot, but there's a flat horizontal line just left of Cluster. This will actually update based on traffic, showing spikes.
- Finally, it tracks the cost of making remote calls, and includes some statistics such as Mean, Median, 90 percentile, 95 percentile, and 99.5 percentile.
- The Thread Pools section can show how taxed the system is from a threading perspective. This can help us tune @HystrixCommand if we need to adjust thread-pool settings.
With circuit monitoring set up, why don't we institute a failure, and watch the whole thing go down and then recover?
To do that, we need to update our simulator that we created earlier in this book:
    @Profile("simulator")
    @Component
    public class CommentSimulator {

      private final HomeController homeController;
      private final CommentController commentController;
      private final ImageRepository repository;

      private final AtomicInteger counter;

      public CommentSimulator(HomeController homeController,
       CommentController commentController,
       ImageRepository repository) {
         this.homeController = homeController;
         this.commentController = commentController;
         this.repository = repository;
         this.counter = new AtomicInteger(1);
      }

      @EventListener
      public void simulateComments(ApplicationReadyEvent event) {
        Flux
         .interval(Duration.ofMillis(1000))
         .flatMap(tick -> repository.findAll())
         .map(image -> {
           Comment comment = new Comment();
           comment.setImageId(image.getId());
           comment.setComment(
             "Comment #" + counter.getAndIncrement());
              return Mono.just(comment);
           })
           .flatMap(newComment ->
            Mono.defer(() ->
             commentController.addComment(newComment)))
             .subscribe();
      }

      @EventListener
      public void simulateUsersClicking(ApplicationReadyEvent event) {
        Flux
          .interval(Duration.ofMillis(500))
          .flatMap(tick ->
           Mono.defer(() ->
            homeController.index(new BindingAwareModelMap())))
            .subscribe();
      }
    }
The following are some key points to note about this preceding code:
- The @Profile annotation indicates that this component is only active when spring.profiles.active=simulator is set in the environment variables.
- By constructor injection, it gets copies of both, CommentController and HomeController.
- simulateActivity() is triggered when Spring Boot generates an ApplicationReadyEvent.
- The Flux generates a tick every 1000 ms. This tick is transformed into a request for all images, and then a new comment is created against each one, simulating user activity.
- simulateUsersClicking() is also triggered by the same ApplicationReadyEvent. It has a different Flux that simulates a user loading the home page every 500 ms.
In both of these simulation flows, the downstream activity needs to be wrapped in a Mono.defer in order to provide a target Mono for the downstream provider to subscribe to.
Finally, both of these Reactor flows must be subscribed to, or they will never run.
If we relaunch the images service, and watch the Hystrix Dashboard, we get a nice, rosy picture:

The bubble on the left of the preceding screenshot is green, and the green 60 at the top indicates that the volume of traffic for its window of monitoring shows 60 successful hits. Looking at the rate (6.0/s), we can deduce this is a 10-second window.
Let's switch over to our IDE, and kill the comments microservice:

If we jump back to the dashboard, things look very different:

The 10 second window shows 6 successful calls, 30 failed calls, and 24 short circuited calls. The horizontal status line takes a precipitous drop, and the green bubble has now turned red. Additionally, the circuit is now Open.
If we follow this outage a little longer, things migrate all the way to 100% failure:

Now there are only two failures with 58 short-circuited calls. In essence, with the circuit Open, there is no point in trying to make remote calls and wasting resources. Instead, we use the fallback method without question. We can also see the graph has flatlined at the bottom.
We can simulate our ops team rushing in and fixing things by restarting the comments service:

With a little bit of time, this service will come back up and re-register with Eureka, making it available. After that, the circuit breaker must wait a minimum amount of time before a remote call will even be attempted.
Hystrix's default setting is 50% failure or higher to open the circuit. Another subtle property is that a minimum number of requests must be made to possibly open the circuit. The default is 20, meaning that 19 failures in a row would not open it. When the circuit is opened, Hystrix keeps the circuit open a minimum amount of time before looking at the rolling window (default: 5000 ms). Hystrix maintains a rolling window, by default, 10 seconds split up into 10 buckets. As a new bucket of metrics is gathered, the oldest is dropped. This collection of buckets is what is examined when deciding whether or not to open the circuit.
When we make a remote call, the circuit is immediately closed:

Successful calls climbs to 57, and the number of short-circuited and failed calls clears out in a few seconds time. The graph turns around and climbs back up, showing a nice recovery.
This nice little scenario shows how we can keep a visual eye on microservice-to-microservice operations.