
In this section, we will discuss profilers and take a deep look at the modules in the Python standard library, which provides support for deterministic profiling. We will also look at third-party libraries that provide support for profiling such as line_profiler and memory_profiler.
Deterministic profiling means that all function calls, function returns, and exception events are monitored, and precise timings are made for the intervals between these events. Another type of profiling, namely statistical profiling, randomly samples the instruction pointer and deduces where time is being spent—but this may not be very accurate.
Python, being an interpreted language, already has a certain overhead in terms of metadata kept by the interpreter. Most deterministic profiling tools make use of this information and hence only add very little extra processing overhead for most applications. Hence deterministic profiling in Python is not a very expensive operation.
The profile and cProfile modules provide support for deterministic profiling in the Python standard library. The profile module is purely written in Python. The cProfile module is a C extension that mimics the interface of the profile module but adds lesser overhead to it when compared to profile.
Both modules report statistics that are converted into reportable results using the pstats module.
We will use the following code, which is a prime number iterator, in order to show our examples using the profile modules:
class Prime(object):
    """ A prime number iterator for first 'n' primes """

    def __init__(self, n):
        self.n = n
        self.count = 0
        self.value = 0

    def __iter__(self):
        return self

    def __next__(self):
        """ Return next item in iterator """

        if self.count == self.n:
            raise StopIteration("end of iteration")
        return self.compute()

    def is_prime(self):
        """ Whether current value is prime ? """

        vroot = int(self.value ** 0.5) + 1
        for i in range(3, vroot):
            if self.value % i == 0:
                return False
        return True

    def compute(self):
        """ Compute next prime """

        # Second time, reset value
        if self.count == 1:
            self.value = 1

        while True:
            self.value += 2

            if self.is_prime():
                self.count += 1
                break

        return self.value
The prime number iterator generates the first n prime numbers given the value of n:
>>> for p in Prime(5):
... print(p)
...
2
3
5
7
11
To profile this code, we just need to pass the code to be executed as a string to the run method of profile or cProfile module. In the following examples, we will be using the cProfile module:
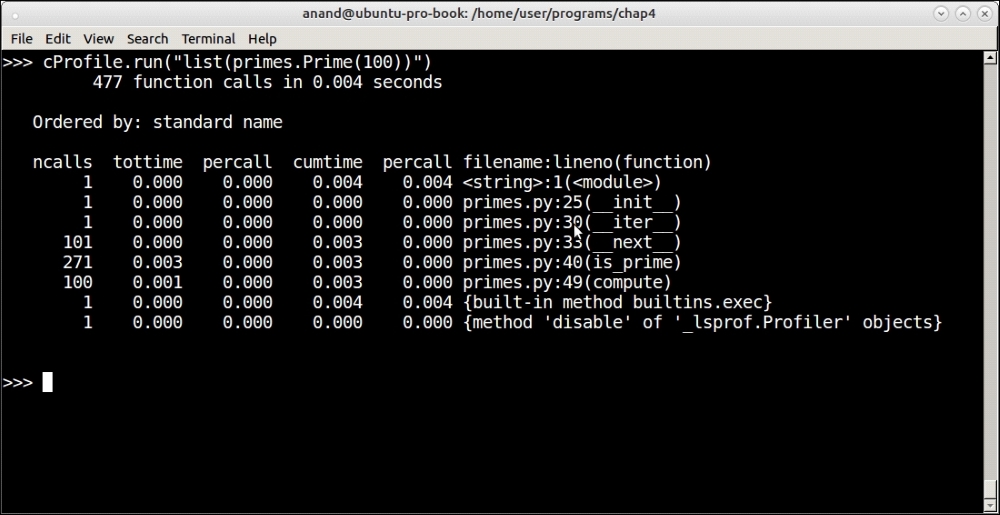
Profiling output of the prime iterator function for the first 100 primes
See how the profiler reports its output. The output is ordered into six columns as follows:
ncalls: The number of calls per functiontottime: The total time spent in the callpercall: Thepercalltime (quotient oftottime/ncalls)cumtime: The cumulative time in this function plus any child functionpercall: Anotherpercallcolumn (the quotient ofcumtime/number of primitive calls)filename: lineno(function): The filename and line number of the function call
In this case, our function took 4 microseconds to complete with most of that time (3 microseconds) being spent inside the is_prime method, which also dominates the number of calls at 271.
Here are the outputs of the profiler at n = 1000 and 10000 respectively:

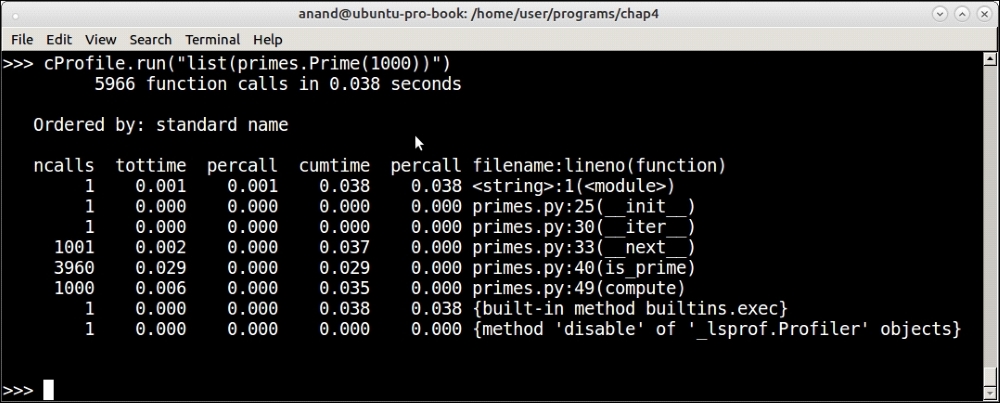
Profiling output of the prime iterator function for the first 1,000 primes
Take a look at the following additional output:
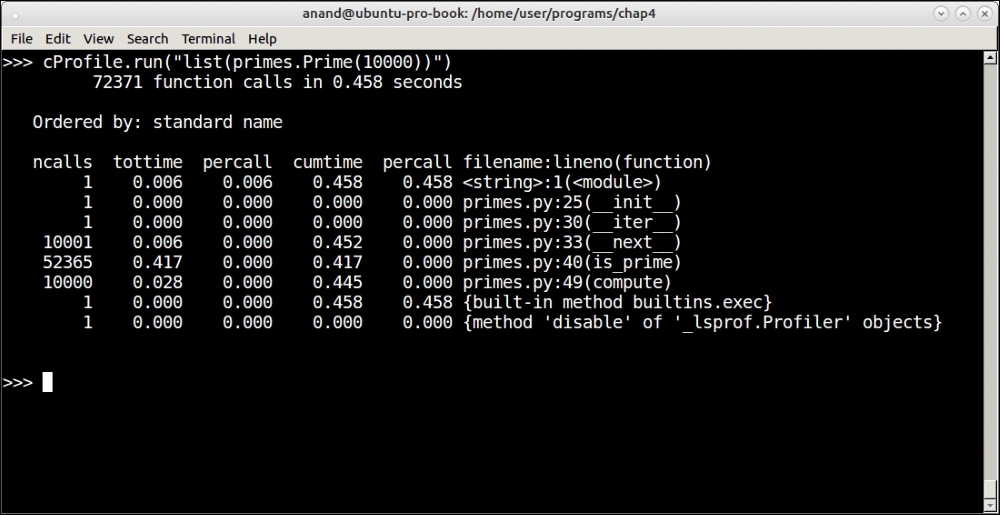
Profiling output of the Prime iterator function for the first 10,000 primes
As you can see, at n=1000 it took about 0.043 seconds (43 microseconds) and at n=10000 it took 0.458 seconds (458 microseconds). Our Prime iterator seems to be performing at an order close to O(n).
As usual, most of that time is spent in is_primes. Is there a way to reduce that time?
At this point, let us analyze the code.
A quick analysis of the code tells us that inside is_prime we are dividing the value by every number in the range from 3 to the successor of the square root of the value.
This contains many even numbers as well—we are doing unnecessary computation, which we can avoid by dividing only by the odd numbers.
The modified is_prime method is as follows:
    def is_prime(self):
        """ Whether current value is prime ? """

        vroot = int(self.value ** 0.5) + 1
        for i in range(3, vroot, 2):
            if self.value % i == 0:
                return False
        return True
With this, the profile for n=1000 and n=10000 looks as follows.
The following is the output of the profiler for n = 1000:
Profiling output of the Prime iterator function for the first 1,000 primes with tweaked code
The following is the output of the profiler for n = 10000:
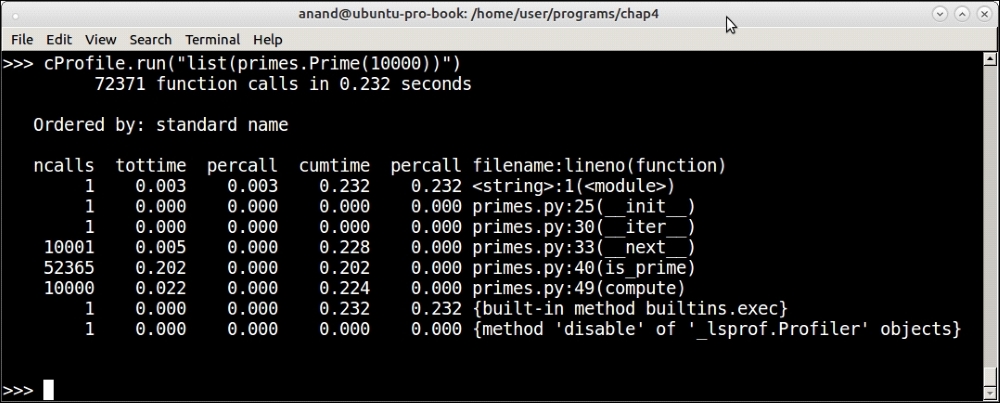
Profiling output of the Prime iterator function for the first 10,000 primes with tweaked code
You can see that, at 1000, the time has dropped a bit (43 microseconds to 38 microseconds) but at 10000, there is nearly a 50% drop from 458 microseconds to 232 microseconds. At this point, the function is performing better than O(n).
The way we used cProfile in the example earlier, it ran and reported the statistics directly. Another way to use the module is to pass a filename argument to which it writes the statistics, which can later be loaded and interpreted by the pstats module.
We modify the code as follows:
>>> cProfile.run("list(primes.Prime(100))", filename='prime.stats')By doing this, the stats, instead of getting printed out, are saved to the file named prime.stats.
Here is how to parse the statistics using the pstats module and print the results ordered by the number of calls:
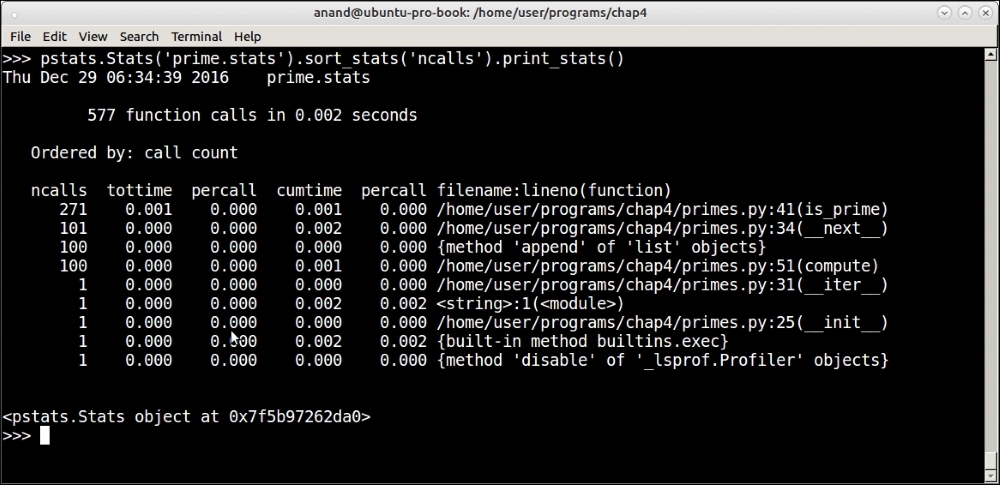
Parsing and printing saved profile results using the pstats module
The pstats module allows sorting the profile results by a number of headers such as total time (tottime), number of primitive calls (pcalls), cumulative time (cumtime), and so on. You can see from the output of pstats again that most of the processing in terms of number of calls are being spent in the is_prime method, as we are sorting the output by 'ncalls' or the number of function calls.
The Stats class of the pstats module returns a reference to itself after every operation. This is a very useful aspect of some Python classes and allows us to write compact one-line code by chaining method calls.
Another useful method of the Stats object is to find out the callee/caller relationship. This can be done by using the print_callers method instead of print_stats. Here is the output from our current statistics:
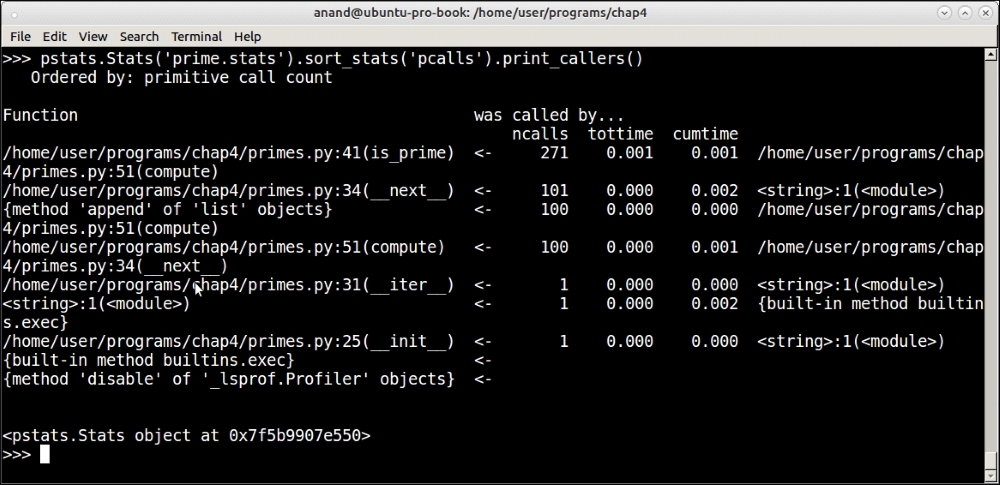
Printing callee/caller relationships ordered by primitive calls using the pstats module
The Python ecosystem comes with a plethora of third-party modules for solving most problems. This is true in the case of profilers as well. In this section, we will take a quick look at a few popular third-party profiler applications contributed by developers in the Python community.
Line profiler is a profiler application developed by Robert Kern for performing line-by-line profiling of Python applications. It is written in Cython, an optimizing static compiler for Python that reduces the overhead of profiling.
Line profiler can be installed via pip as follows:
$ pip3 install line_profiler
As opposed to the profiling modules in Python, which profile functions, line profiler is able to profile code line by line, thus providing more granular statistics.
Line profiler comes with a script called kernprof.py that makes it easy to profile code using line profiler. One needs only to decorate the functions that need to be profiled with the @profile decorator when using kernprof.
For example, we realized that most of the time in our prime number iterator was being spent in the is_prime method. However, line profiler allows us to go into more detail and find which lines of those functions take the most time.
To do this, just decorate the method with the @profile decorator:
    @profile
    def is_prime(self):
        """ Whether current value is prime ? """

        vroot = int(self.value ** 0.5) + 1
        for i in range(3, vroot, 2):
            if self.value % i == 0:
                return False
        return True
Since kernprof accepts a script as an argument, we need to add some code to invoke the prime number iterator. To do that, we can append the following at the end of the primes.py module:
# Invoke the code.
if __name__ == "__main__":
    l=list(Prime(1000))
Now, run it with line profiler as follows:
$ kernprof -l -v primes.py
By passing -v to the kernprof script, we tell it to display the profile results in addition to saving them.
Here is the output:
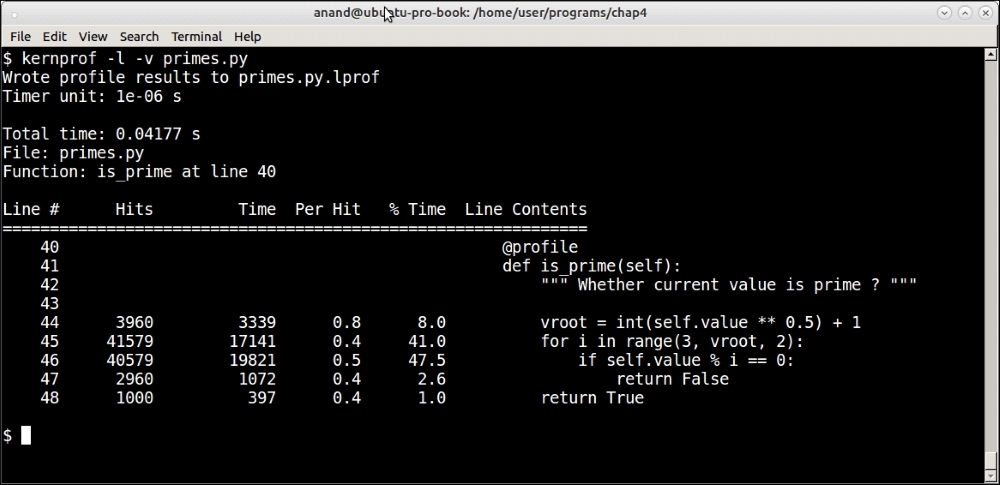
Line profiler results from profiling the is_prime method using n = 1000
Line profiler tells us that the majority of the time—close to 90% of the total time spent in the method—is spent in the first two lines: the for loop and the reminder check.
This tells us that, if ever we want to optimize this method, we need to concentrate on these two aspects.
Memory profiler is a profiler similar to line profiler in that it profiles Python code line by line. However, instead of profiling the time taken in each line of code, it profiles lines by memory consumption.
Memory profiler can be installed the same way as line profiler:
$ pip3 install memory_profiler
Once installed, memory for lines can be printed by decorating the function with the @profile decorator in a similar way to line profiler.
Here is a simple example:
# mem_profile_example.py
@profile
def squares(n):
    return [x*x for x in range(1, n+1)]

squares(1000)
Here's how to run this:

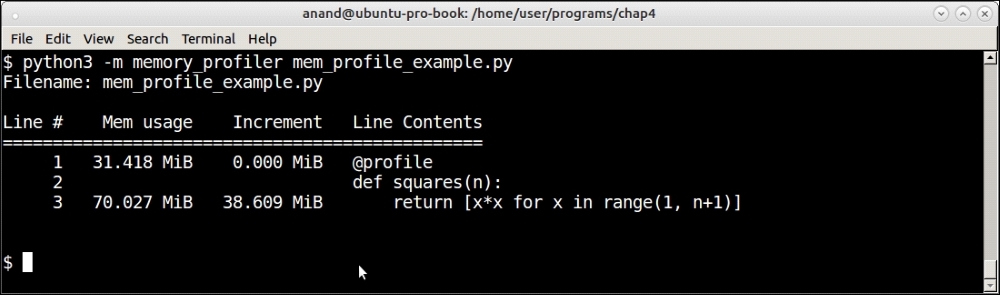
Memory profiler profiling a list comprehension of squares of the first 1,000 numbers
Memory profiler shows memory increments line by line. In this case, there is almost no increment for the line containing the number of squares (the list comprehension) as the numbers are rather small. The total memory usage remains what it was at the beginning: about 32 MB.
What happens if we change the value of n to 1,000,000? This can be done by rewriting the last line of the code as follows:
squares(100000)
Memory profiler profiling a list comprehension of squares of the first 1,000,000 numbers
Now you can see that there is a clear memory increment of about 39 MB for the list comprehension calculating the squares, with a total final memory usage of about 70 MB.
To demonstrate the real usefulness of memory profiler, let us look at another example.
This involves finding the strings from a sequence that are subsequences of any of the strings present in another sequence, generally containing larger strings.
Let us say you have a sequence containing the following strings:
>>> seq1 = ["capital","wisdom","material","category","wonder"]
And say there is another sequence as follows:
>>> seq2 = ["cap","mat","go","won","to","man"]
The problem is to find the strings in seq2 that are substrings—as is found anywhere contiguously in any of the strings in seq1:
In this case, the answer is as follows:
>>> sub=["cap","mat","go","won"]
This can be solved using a brute-force search—checking for each string one by one in each of the parent strings as follows:
def sub_string_brute(seq1, seq2):
    """ Sub-string by brute force """

    subs = []
    for item in seq2:
        for parent in seq1:
            if item in parent:
                subs.append(item)

    return subs
However, a quick analysis will tell you that the time complexity of this function scales rather badly as the size of the sequences increase. Since every step needs iteration through two sequences and then a search in each string in the first sequence, the average performance would be O(n1*n2), where n1, n2 are the sizes of the sequences respectively.
Here are the results of some tests of this function with input sizes (both sequences of the same size) of random strings varying from length 2 to 10:
|
Input size |
Time taken |
|---|---|
|
100 |
450 usec |
|
1000 |
52 microseconds |
|
10000 |
5.4 seconds |
Table 2: Input size versus time taken for subsequence solution via brute force
The results indicate the performance is almost exactly O(n2).
Is there a way to rewrite the function to be more performance-efficient? This approach is captured in the following sub_string function:
def slices(s, n):
    return map(''.join, zip(*(s[i:] for i in range(n))))

def sub_string(seq1, seq2):
    """ Return sub-strings from seq2 which are part of strings in seq1 """

    # Create all slices of lengths in a given range
    min_l, max_l = min(map(len, seq2)), max(map(len, seq2))
    sequences = {}

    for i in range(min_l, max_l+1):
        for string in seq1:
	      # Create all sub sequences of given length i
         sequences.update({}.fromkeys(slices(string, i)))

    subs = []
    for item in seq2:
        if item in sequences:
            subs.append(item)

    return subs
In this approach, we pre-compute all the substrings of a size range from the strings in seq1 and store it in a dictionary. Then it is a matter of going through the strings in seq2 and checking if they are in this dictionary and if so adding them to a list.
To optimize the calculation, we only compute strings whose size is in the range of the minimum and maximum length of the strings in seq2.
As with almost all solutions to performance issues, this one trades space for time. By pre-computing all the substrings, we are expending more space in memory but this eases the computation time.
The test code looks like this:
import random
import string

seq1, seq2 = [], []

def random_strings(n, N):
     """ Create N random strings in range of 4..n and append
     to global sequences seq1, seq2 """

    global seq1, seq2
    for i in range(N):
        seq1.append(''.join(random.sample(string.ascii_lowercase,
                             random.randrange(4, n))))

    for i in range(N):
        seq2.append(''.join(random.sample(string.ascii_lowercase,
                             random.randrange(2, n/2))))

def test(N):
    random_strings(10, N)
    subs=sub_string(seq1, seq2)

def test2():
    # random_strings has to be called before this
    subs=sub_string(seq1, seq2)
Here are the timing results of this function using the timeit module:
>>> t=timeit.Timer('test2()',setup='from sub_string import test2, random_
strings;random_strings(10, 100)')
>>> 1000000*t.timeit(number=10000)/10000.0
1081.6103347984608
>>> t=timeit.Timer('test2()',setup='from sub_string import test2, random_
strings;random_strings(10, 1000)')
>>> 1000000*t.timeit(number=1000)/1000.0
11974.320339999394
>>> t=timeit.Timer('test2()',setup='from sub_string import test2, random_
strings;random_strings(10, 10000)')
>>> 1000000*t.timeit(number=100)/100.0124718.30968977883
124718.30968977883
>>> t=timeit.Timer('test2()',setup='from sub_string import test2, random_
strings;random_strings(10, 100000)')
>>> 1000000*t.timeit(number=100)/100.0
1261111.164370086
Here are the summarized results for this test:
|
Input size |
Time taken |
|---|---|
|
100 |
1.08 microseconds |
|
1000 |
11.97 microseconds |
|
10000 |
0.12 microseconds |
|
100000 |
1.26 seconds |
Table 3: Input size versus time taken for optimized sub-sequence solution using pre-computed strings
A quick calculation tells us that the algorithm is now performing at O(n). Pretty good!
But this is at the expense of memory in terms of the pre-computed strings. We can get an estimate of this by invoking memory profiler.
Here is the decorated function for doing this:
@profile
def sub_string(seq1, seq2):
    """ Return sub-strings from seq2 which are part of strings in seq1 """

    # Create all slices of lengths in a given range
    min_l, max_l = min(map(len, seq2)), max(map(len, seq2))
    sequences = {}

    for i in range(min_l, max_l+1):
        for string in seq1:
            sequences.update({}.fromkeys(slices(string, i)))

    subs = []
    for item in seq2:
        if item in sequences:
            subs.append(item)
The test function would now be as follows:
def test(N):
    random_strings(10, N)
    subs = sub_string(seq1, seq2)
Let's test this for the sequence of sizes 1,000 and 10,000 respectively.
Here is the result for an input size of 1,000:
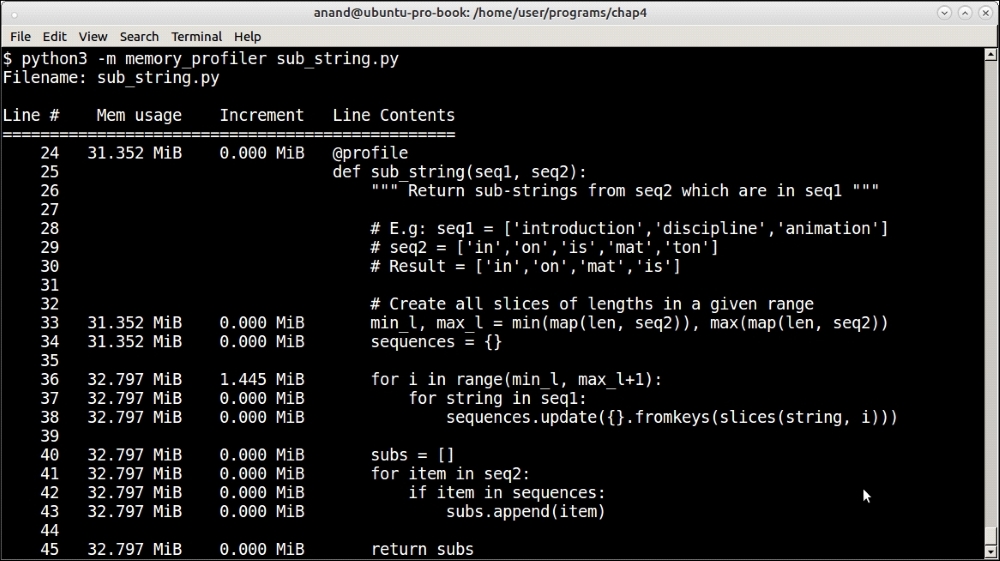
Memory profiler results for testing sub-strings of sequences of size 1,000
And here is the result for an input size of 10,000:
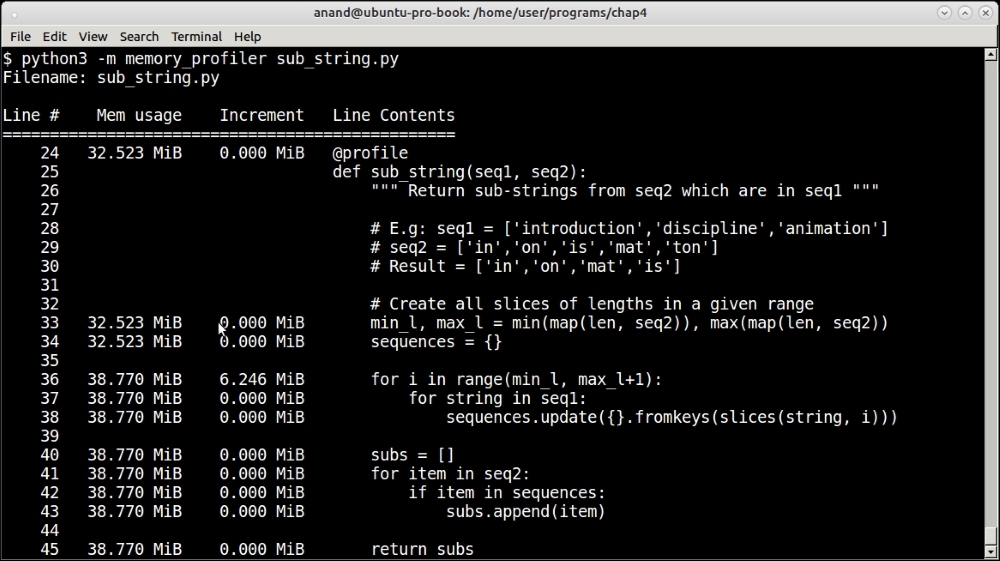
Memory profiler results for testing sub-strings of sequences of size 10,000
For the sequence of size of 1,000, the memory usage increased by a paltry 1.4 MB. For the sequence of size 10,000 it increased by 6.2 MB. Clearly, these are not very significant numbers.
So the test with memory profiler makes it clear that our algorithm, while being efficient on time performance, is also memory-efficient.