In this section, we will discuss a few more tools that will aid the programmer in debugging memory leaks and also enable them to visualize their objects and their relations.
objgraph (object graph) is a Python object visualization tool that makes use of the graphviz package to draw object reference graphs.
It is not a profiling or instrumentation tool but can be used along with such tools to visualize object trees and references in complex programs while hunting for elusive memory leaks. It allows you to find out references to objects to figure out what references are keeping an object alive.
As with almost everything in the Python world, it is installable via pip:
$ pip3 install objgraph
However objgraph is really useful only if it can generate graphs. Hence we need to install the graphviz package and the xdot tool.
In a Debian/Ubuntu system, you will install this as follows:
$ sudo apt install graphviz xdot -y
Let's look at a simple example of using objgraph to find out hidden references:
import objgraph

class MyRefClass(object):
    pass

ref=MyRefClass()
class C(object):pass

c_objects=[]
for i in range(100):
    c=C()
    c.ref=ref
    c_objects.append(c)

import pdb; pdb.set_trace()
We have a class named MyRefClass with a single instances ref that is referred to by 100 instances of the class C created in a for loop. These are references that may cause memory leaks. Let us see how objgraph allows us to identify them.
When this piece of code is executed, it stops at the debugger (pdb):
$ python3 objgraph_example.py
--Return--
[0] > /home/user/programs/chap4/objgraph_example.py(15)<module>()->None
-> import pdb; pdb.set_trace()
(Pdb++) objgraph.show_backrefs(ref, max_depth=2, too_many=2, filename='refs.png')
Graph written to /tmp/objgraph-xxhaqwxl.dot (6 nodes)
Image generated as refs.png
Next is the diagram generated by objgraph:
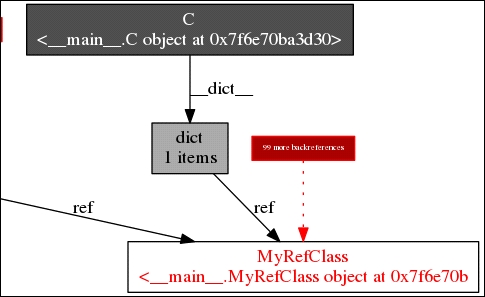
objgraph back references visualization for the object ref
The red box in the preceding diagram says 99 more references, which means that it is showing one instance of class C and informing us there are 99 more like it—totaling to 100 instances of C, that refer to the single object ref.
In a complex program where we are unable to track object references that cause memory leaks, such reference graphs can be put to good use by the programmer.
Pympler is a tool that can be used to monitor and measure the memory usage of objects in a Python application. It works on both Python 2.x and 3.x. It can be installed using pip as follows:
$ pip3 install pympler
The documentation of pympler is rather lacking. However, it's well-known use is to track objects and print their actual memory usage via its asizeof module.
The following is our sub_string function modified to print the memory usage of the sequences dictionary (where it stores all the generated substrings):
from pympler import asizeof
def sub_string(seq1, seq2):
""" Return sub-strings from seq2 which are part of strings in seq1 """
# Create all slices of lengths in a given range
min_l, max_l = min(map(len, seq2)), max(map(len, seq2))
sequences = {}
for i in range(min_l, max_l+1):
for string in seq1:
sequences.update({}.fromkeys(slices(string, i)))
subs = []
for item in seq2:
if item in sequences:
subs.append(item)
print('Memory usage',asizeof.asized(sequences).format())
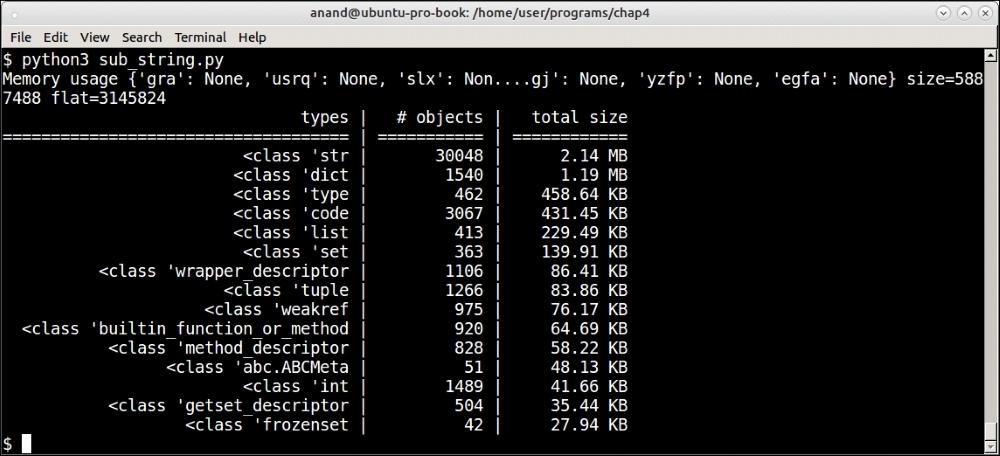
return subsWhen running this for a sequence size of 10,000:
$ python3 sub_string.py
Memory usage {'awg': None, 'qlbo': None, 'gvap': No....te':
                           None, 'luwr':
                           None, 'ipat': None}
size=5874384
flat=3145824
The memory size of 5870408 bytes (or around 5.6 MB) is in line with what memory profiler reported (around 6 MB)
Pympler also comes with a package called muppy which allows us to keep track of all objects in a program. This can be summarized with the summary package to print out the summary of memory usage of all objects (classified according to their types) in an application.
Here is a report of our sub_string module run with n =10,000. To do this, the execution part has to be modified as follows:
if __name__ == "__main__":
    from pympler import summary
    from pympler import muppy
    test(10000)
    all_objects = muppy.get_objects()
    sum1 = summary.summarize(all_objects)
    summary.print_(sum1)
The following shows the output that
pympler summarizes at the end of the program:
Summary of memory usage classified by object type by pympler