Most programmers tend to think of debugging as something that they ought to do with a debugger. In this chapter, we have so far seen that, more than an exact science, debugging is an art, which can be done using a lot of tricks and techniques rather than directly jumping to a debugger. However, sooner or later, we expected to encounter the debugger in this chapter—and here we are!
The Python Debugger, or pdb as it is known, is part of the Python runtime.
Pdb can be invoked when running a script from the beginning as follows:
$ python3 -m pdb script.py
However, the most common way in which programmers invoke pdb is to insert the following line at a place in the code where you want to enter the debugger:
import pdb; pdb.set_trace()
Let's use this, and try to debug an instance of the first example in this chapter, that is, the sum of the max subarray. We will debug the O(n) version of the code as an example:
def max_subarray(sequence):
    """ Maximum subarray - optimized version """

    max_ending_here = max_so_far = 0
    for x in sequence:
        # Enter the debugger
        import pdb; pdb.set_trace()
        max_ending_here = max(0, max_ending_here + x)
        max_so_far = max(max_so_far, max_ending_here)

return max_so_farThe debugger is entered in the very first loop immediately after the program is run:
>>> max_subarray([20, -5, -10, 30, 10])
> /home/user/programs/maxsubarray.py(8)max_subarray()
-> max_ending_here = max(0, max_ending_here + x)
-> for x in sequence:
(Pdb) max_so_far
20
You can stop the execution using s. Pdb will execute the current line, and stop:
> /home/user/programs/maxsubarray.py(7)max_subarray()
-> max_ending_here = max(0, max_ending_here + x)
You can inspect the variables by simply typing them and pressing Enter:
(Pdb) max_so_far
20
The current stack trace can be printed using w or where. An arrow (→) indicates the current stack frame:
(Pdb) w
  <stdin>(1)<module>()
> /home/user/programs/maxsubarray.py(7)max_subarray()
-> max_ending_here = max(0, max_ending_here + x)
The execution can be continued until the next breakpoint by using c or continue:
> /home/user/programs/maxsubarray.py(6)max_subarray()
-> for x in sequence:
(Pdb) max_so_far
20
(Pdb) c
> /home/user/programs/maxsubarray.py(6)max_subarray()
-> for x in sequence:
(Pdb) max_so_far
20
(Pdb) c
> /home/user/programs/maxsubarray.py(6)max_subarray()
-> for x in sequence:
(Pdb) max_so_far
35
(Pdb) max_ending_here
35
In the preceding code, we continued three iterations of the for loop until the max value changed from 20 to 35. Let's inspect where we are in the sequence:
(Pdb) x
30
We have one more item to go in the list, namely, the last one. Let's inspect the source code at this point using the l or the list command:
(Pdb) l
  1
  2     def max_subarray(sequence):
  3         """ Maximum subarray - optimized version """
  4
  5         max_ending_here = max_so_far = 0
  6  ->     for x in sequence:
  7             max_ending_here = max(0, max_ending_here + x)
  8             max_so_far = max(max_so_far, max_ending_here)
  9             import pdb; pdb.set_trace()
 10
 11         return max_so_far
One can traverse up and down the stack frames by using the u or up and d or down commands, respectively:
(Pdb) up
> <stdin>(1)<module>()
(Pdb) up
*** Oldest frame
(Pdb) list
[EOF]
(Pdb) d
> /home/user/programs/maxsubarray.py(6)max_subarray()
-> for x in sequence:
Let's now return from the function:
(Pdb) r
> /home/user/programs/maxsubarray.py(6)max_subarray()
-> for x in sequence:
(Pdb) r
--Return--
> /home/user/programs/maxsubarray.py(11)max_subarray()->45
-> return max_so_far
The return value of the function is 45.
Pdb has a lot of other commands than what we covered here. However, we don't intend for this session to be a fully fledged pdb tutorial. Interested programmers can refer to the documentation on the web to learn more.
The Python community has built a number of useful tools that build on top of Pdb, but add more useful functionality, developer's ease-of-use, or both.
Basically, iPdb is iPython-enabled pdb. It exports functions to access the iPython debugger. It also has tab completion, syntax highlighting, and better traceback, and introspection methods.
iPdb can be installed with pip.
The following screenshot shows a session of debugging using iPdb, the same function as we did with pdb before. Observe the syntax highlighting that iPdb provides:

iPdb in action, showing syntax highlighting
Also note that iPdb provides a fuller stack trace as opposed to Pdb:
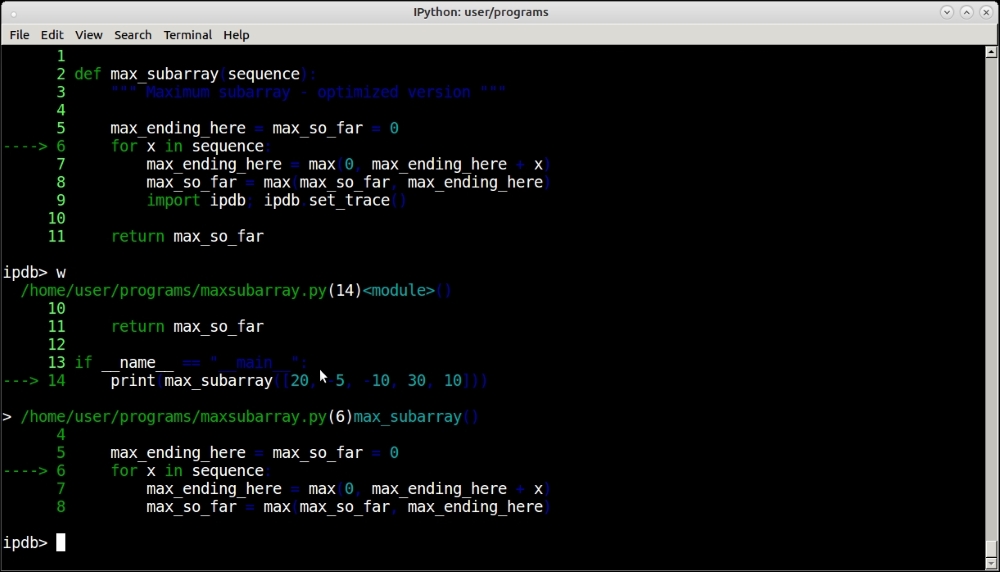
iPdb in action, showing a fuller stack trace than pdb
Note that iPdb uses iPython as the default runtime instead of Python.
Pdb++ is a drop-in replacement for pdb with features similar to iPdb, but it works on the default Python runtime instead of requiring iPython. Pdb++ is also installable via pip.
Once pdb++ is installed, it takes over at all places that import Pdb, so no code change is required at all.
Pdb++ does smart command parsing. For example, if there are variable names conflicting with the standard Pdb commands, Pdb will give preference to the command over displaying the variable contents. Pdb++ figures this out intelligently.
Here is a screenshot showing Pdb++ in action, including syntax highlighting, tab completion, and smart command parsing:
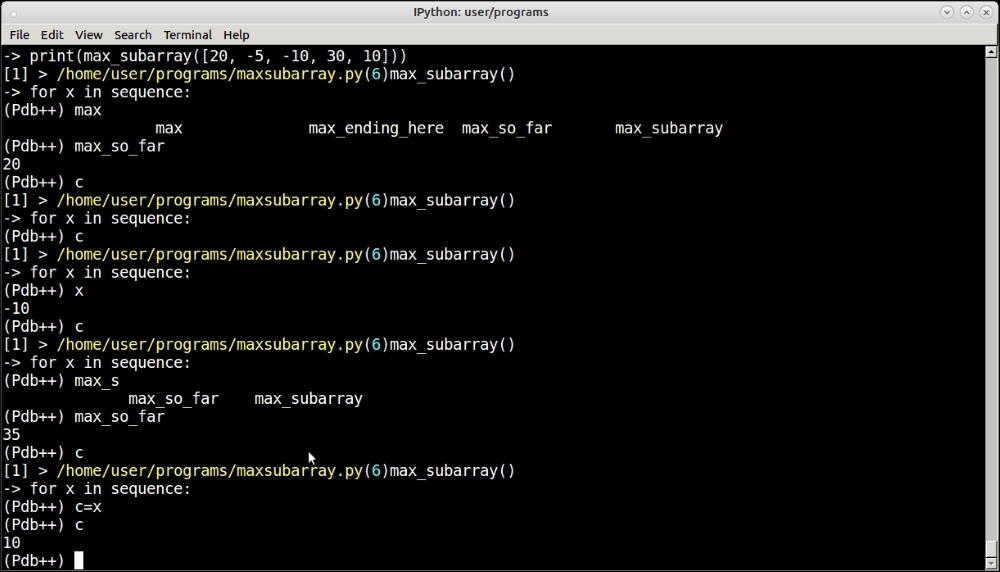
Pdb++ in action—Note the smart command parsing, where the c variable is interpreted correctly