
The following examples show how to integrate Prometheus into Java EE. This is one possible monitoring solution and aims to give the readers an idea of how to slimly integrate business-related metrics.
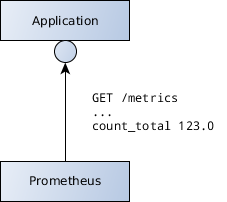
The application will emit the gathered metrics in the Prometheus output format. The Prometheus instances scrape and store this information, as demonstrated in the following diagram:
Developers can implement custom functionality to collect and emit information, or use Prometheus' Client API which already ships with several metric types.
There are multiple Prometheus metric types as follows:
- The one mostly used is a counter which represents an increasing numeric value. It counts the occurred events.
- A gauge is a numeric value that goes up and down. It can be used for measuring values such as conversion rates, temperatures, or turnover.
- Histograms and summaries are more complex metric types used to sample observations in buckets. They typically observe metrics distribution. For example, how long does it take to create a car, how much do these values vary, and how are they distributed?
A Prometheus metric has a name and labels, which are sets of key-value pairs. A time series is identified by the metric's name and a set of labels. The label can be seen as parameters, sharding the overall amount of information.
An example of a counter metric representation using labels is cars_manufactured_total{color="RED", engine="DIESEL"}. The cars_manufactured_total counter includes the total number of manufactured cars that are specified by their color and engine type. The collected metrics can be queried for the provided label information later on.