Looking further into backend performance, we would also need to understand the performance of our databases. Relational databases are not as easy to scale horizontally. Scaling a database usually entails the following:
- Vertical scaling: Resizing the instance type to get more memory, CPU, and network performance
- Adding a read replica (or replicas): Distributing the read operations on the read replicas and offloading our master database
- Increasing the size of the volume when space is low
To detect the need to scale or optimize the performance of our database, we can use CloudWatch. The RDS overview in the CloudWatch management console gives us a good, quick look at the operation of our databases, but, as with the EC2 service, it can get crowded when running a lot of RDS services.
The default overview, however, does give us a good insight into the operational statistics, as can be seen in the following screenshot:

But, of course, the way we use RDS is going to be very application-specific, and if we want to get the most out of the CloudWatch service, we will create a dashboard that will give us an overview of the metrics that matter. For example, a dashboard with the number of queries, the relevant database latencies, and throughput can easily be created by selecting the correct metrics. A custom RDS dashboard might look something like the following screenshot:

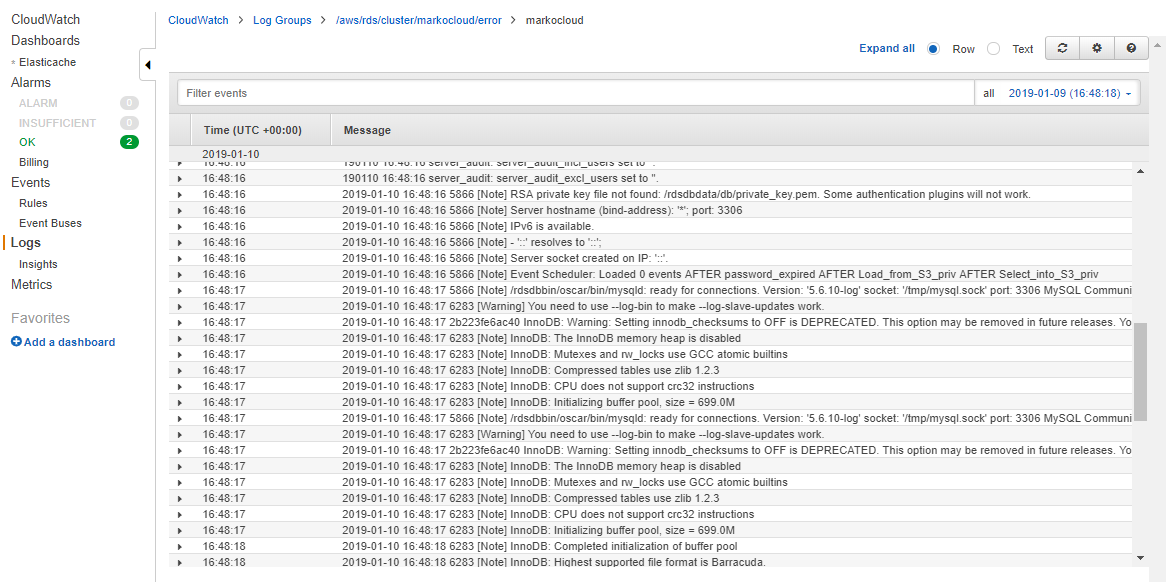
A big benefit of the CloudWatch service is that it also collects the logs from our RDS database. We can simply select Logs from the CloudWatch management console, followed by Log groups, and then the group name that starts with /aws/rds/.... In the following screenshot, we can see the error log that is being collected for the markocloud database cluster: