
To continue with project development, we can again utilize the Watson Analytics Explore feature. If you don't quite remember how to do this, from the Welcome page you can click on Explore and then select the dataset to be explored, which in our case is the data we just finished filtering (using Refine) in the previous section.
Watson Analytics will present you with various starting points:

IBM Watson Analytics uses questions rather than SQL commands to generate the list of starting points that you can use to create visualizations that meet your needs.
Not surprisingly, we are interested most in the Dollar Amount Sold, and particularly the relationship between Dollar Amount and Dollar Amount Sold.
These data points in our file constitute the average amount (in dollars) that a user has in their online shopping cart, compared to the average amount they actually spend.
The following is an interesting Watson Analytics visualization showing how various advertisements a user views on the website may (or may not) affect this relationship:
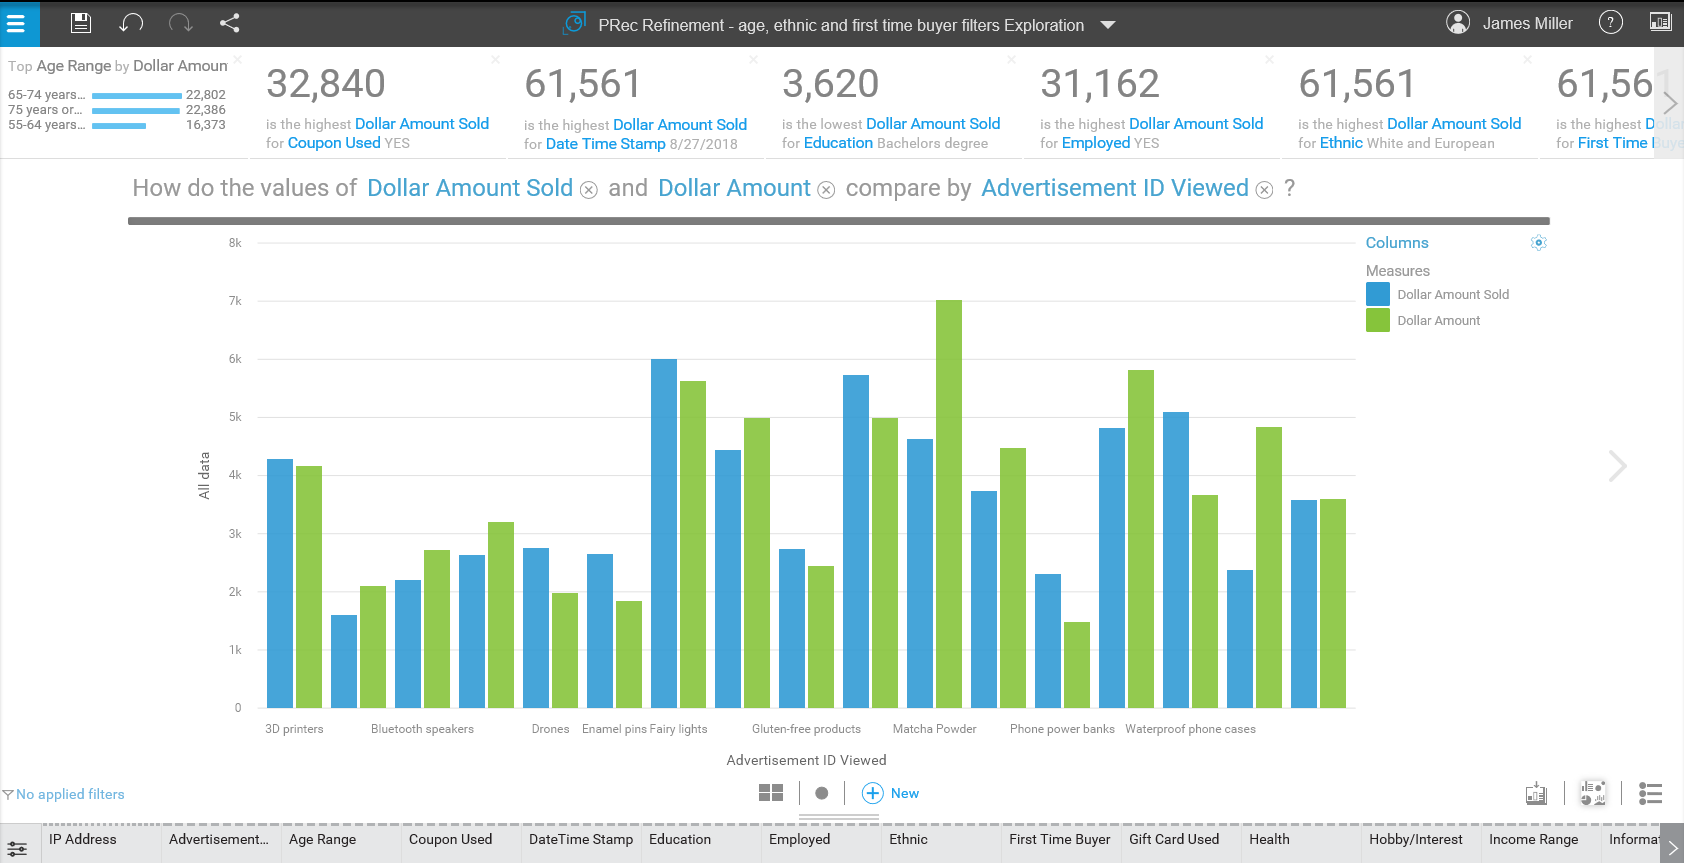
Searching for other predictors, we might alter the previous visualization to look at the effects of the user's education:

Or, We could look at age (range):

Of course, as an alternative to reviewing insights that Watson created for us, you can always start a related exploration by clicking on +New at the bottom of an insight or visualization page. When you click +New, Watson Analytics directs you back to the Starting Point page where you can again select one of the starting points provided, or enter your own new keywords and then click on one of the new starting points that will appear.
Using this approach, we can have Watson Analytics create a rich visualization to answer this query: how might the amount sold break down by education and whether the user was using a mobile device.
The following is Watson's answer expressed in a rich, easily understood visualization:

Married Status and Education also produce thought-provoking visualizations:

After we have done some proper exploration on our data, we may find that we have many pages of different visualizations created. At the bottom of each page, you will see that the current page is indicated by a solid circle icon. To move to another page, you can click a different circle. There is one circle for each page:

You can also view all pages at the same time, making it easier to select the one page or visualization that you want. To see all of the pages in a tiled format (shown as follows), you can click on the tile icon:

The yield from performing a Watson Analytics Exploration on a dataset should be the identification of the data points within the data that are of interest to your project's objectives. After an Exploration, you should have a reasonable idea of what to create a prediction on (what to predict) and, possibly, what the best or strongest predictors might be.
During an exploration, you should create many visualizations using a natural language, rather than program code or SQL commands, to enter questions that find various starting points for exploring your data. You also can use keywords along with column headings and data values found in your dataset to build your questions.
For example, in one of our previous questions, what is the breakdown of dollar amount and dollar amount sold by age range?, breakdown is a keyword, age is a column heading, and Dollar Amount Sold is a data value.
IBM Watson Analytics makes it very easy to quickly create and compare multiple visualizations during an exploration by using bar charts, bubble charts, tree maps, and other visualization types, which you can then reuse and share later. You can set aside these visualizations to use in dashboards and infographics using Watson Assemble. You can also share those visualizations with others by emailing the visualizations as an image, presentation, and Adobe PDF files. We'll try sharing our insights in the next section of this chapter.