
Once again, with the objective of becoming more intimate with our data, we can use the Explore feature in Watson Analytics to have Watson suggest to us various interesting starting points:

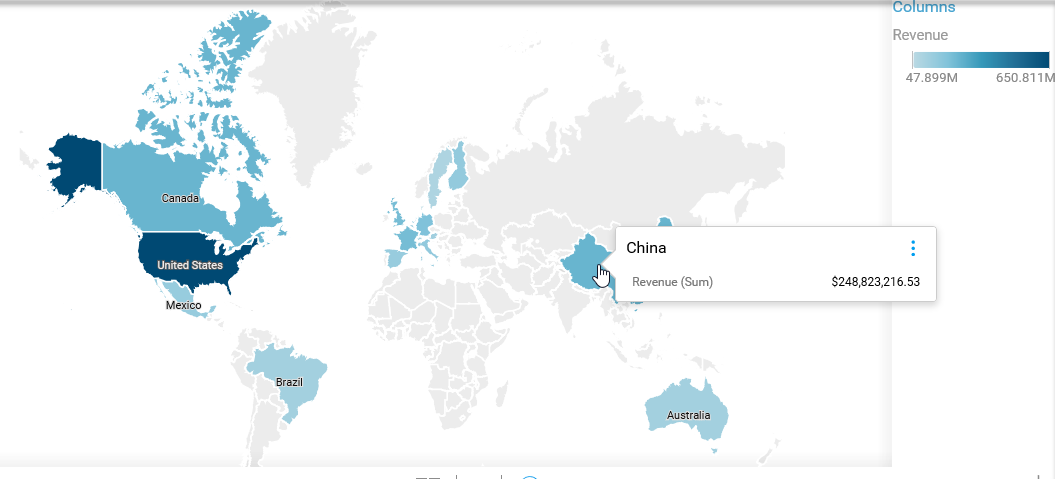
Although Planning Analytics provides us with a way to view Revenue by Retailer Country, it requires us to create a report (or view) of the data using the cube viewer and is in a common row and column format. We could also experiment with the charting feature, but here we can see that Watson Analytics automatically generated a neat, easy-to-comprehend visualization on the data automatically:

Keep in mind that the Watson Analytics visualizations are dynamic, drillable, and provide out of the box context sensitivity:
The other report view that we created earlier in this chapter (using the Planning Analytics cube viewer) was the Revenue by Product Line view over quarters.
The following screenshot shows that same information, which was created by Watson Analytics automatically for us:

As we continue to explore our data using Watson Analytics, we can again go to the insights provided across the top of each page for more knowledge.
For example, Watson Analytics provides our Top Product Type by Revenue:

Clicking on that insight and selecting + New Page, we will see the following visualization generated for us on a new page:

Based upon revenues, it would seem that Eyewear is the Top Product Type.
I wonder—how (what order method) do we sell the most of this type of product? To answer that question, we can click on the visualization and select Show by and Order method type:

Watson Analytics automatically shows us that online purchases (the web) is the most common method of purchasing our Eyewear product type (during this time period):

Note that for the preceding visualization, I have used the Visualization Types icon (as shown in the following screenshot) to change the visualization type to a bubble Chart:

To change the type, you can choose from a list of Watson Analytics recommended visualizations, or you can choose one of the other types. In this way, Watson makes sure that you use the visualization type that will be the most comprehensive, based upon the data question you have selected or created. If you choose to experiment, keep in mind that, depending on the visualization type that you choose, the visualization might be empty because there are required data items that are undefined.