
When you review a Watson Analytics prediction, you first see a summary of the most important insights Watson found within your data set. You also have the ability to easily explore specific fields in detail.
When you create your prediction, IBM Watson Analytics runs some analyses based on the data in your data set. The analyses focus on the targets that you set when you created the prediction.
There is a visualization for each key predictor, giving you information about what drives each behavior and outcome. If you tap one of the predictors (or hover over it), you see some details about it.
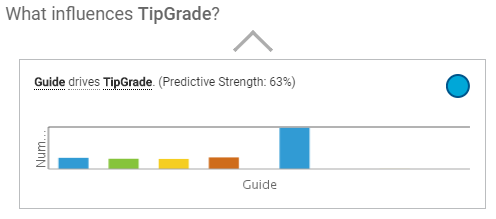
For example, the spiral visualization in our prediction visualization shows Guide just outside the center, which is the target for this prediction. The top predictor is represented in color. The strongest predictor (Guide) is indicated by the blue circle, and it is closest to the center of the spiral. The information box shows that Guide is the strongest predictor of TipGrade, with a 62.5% Predictive Strength:

Each predictor that Watson Analytics found will have a corresponding snapshot visualization that contains information about the predictor and how it affects the target. The color of the circle in the spiral visualization is also found in the corresponding detailed visualization. In this example, the blue circle in the spiral visualization for the Guide predictor is included in the corresponding detailed visualization for Guide:
If you click on the visualization, you can see it in more detail on the Main Insight page:

You can view more details about predictive insights that are hidden in the data. In the prediction scenario selector, you can specify how many fields you want to view that act as predictors for your target. For example, vehicle type and drop-off location, when combined, might be a predictor of TipGrade:

If you select Two Fields, you see a new set of visualizations and see how two variables might influence your target. If you select Combination, the visualizations provide a much deeper and more predictive analysis of your data by showing how a combination of variables influences your target.