When predictions for one of the classes are of particular interest, precision and recall curves visualize the trade-off between these error metrics for different thresholds. Both measures evaluate the quality of predictions for a particular class. The following list shows how they are applied to the positive class:
- Recall measures the share of actual positive class members that a classifier predicts as positive for a given threshold. It originates in information retrieval and measures the share of relevant documents successfully identified by a search algorithm.
- Precision, in contrast, measures the share of positive predictions that are correct.
Recall typically increases with a lower threshold, but precision may decrease. Precision-recall curves visualize the attainable combinations and allow for the optimization of the threshold given the costs and benefits of missing a lot of relevant cases or producing lower-quality predictions.
The F1 score is a harmonic mean of precision and recall for a given threshold and can be used to numerically optimize the threshold while taking into account the relative weights that these two metrics should assume.
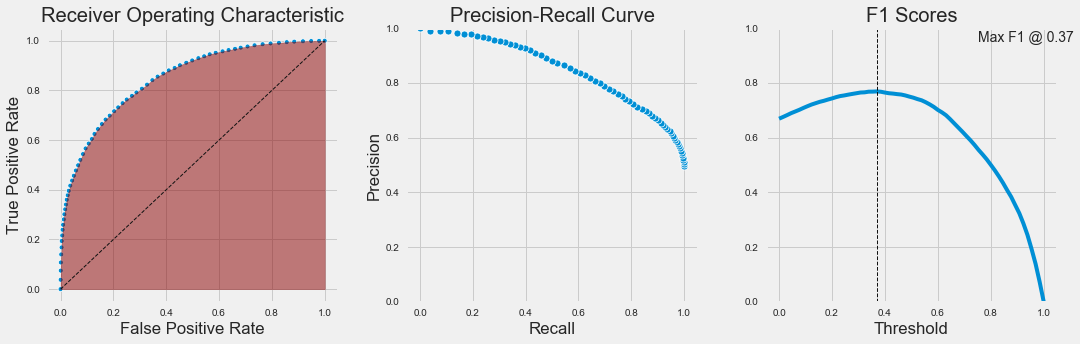
The following chart illustrates the ROC curve and corresponding AUC alongside the precision-recall curve and the F1 score that, using equal weights for precision and recall, yields an optimal threshold of 0.37. The chart is taken from the accompanying notebook where you can find the code for the KNN classifier that operates on binarized housing prices: