
We use statsmodels to estimate a multiple regression model that accurately reflects the data generating process as follows:
from statsmodels.api import
X_ols = add_constant(X)
model = OLS(y, X_ols).fit()
model.summary()
This yields the following OLS Regression Results summary:
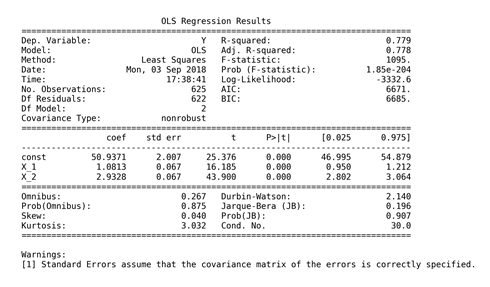
The upper part of the summary displays the dataset characteristics, namely the estimation method, the number of observations and parameters, and indicates that standard error estimates do not account for heteroskedasticity. The middle panel shows the coefficient values that closely reflect the artificial data generating process. We can confirm that the estimates displayed in the middle of the summary result can be obtained using the OLS formula derived previously:
beta = np.linalg.inv(X_ols.T.dot(X_ols)).dot(X_ols.T.dot(y))
pd.Series(beta, index=X_ols.columns)

const   50.94
X_1      1.08
X_2      2.93
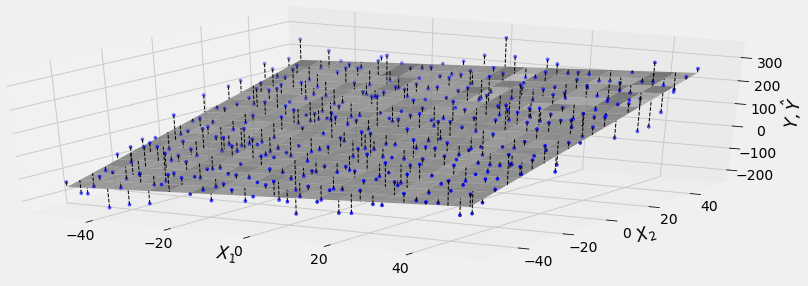
The following diagram illustrates the hyperplane fitted by the model to the randomly generated data points:
The upper right part of the panel displays the goodness-of-fit measures just discussed, alongside the F-test that rejects the hypothesis that all coefficients are zero and irrelevant. Similarly, the t-statistics indicate that intercept and both slope coefficients are, unsurprisingly, highly significant.
The bottom part of the summary contains the residual diagnostics. The left panel displays skew and kurtosis that are used to test the normality hypothesis. Both the Omnibus and the Jarque—Bera test fails to reject the null hypothesis that the residuals are normally distributed. The Durbin—Watson statistic tests for serial correlation in the residuals and has a value near 2 which, given 2 parameters and 625 observations, fails to reject the hypothesis of no serial correlation.
Lastly, the condition number provides evidence about multicollinearity: it is the ratio of the square roots of the largest and the smallest eigenvalue of the design matrix that contains the input data. A value above 30 suggests that the regression may have significant multicollinearity.
statsmodels includes additional diagnostic tests that are linked in the notebook.