You can visualize the tree using the graphviz library (see GitHub for installation instructions) because sklearn can output a description of the tree using the .dot language used by that library. You can configure the output to include feature and class labels and limit the number of levels to keep the chart readable, as follows:
dot_data = export_graphviz(classifier,
                           out_file=None, # opt. save to file and convert to png
                           feature_names=X.columns,
                           class_names=['Down', 'Up'],
                           max_depth=3,
                           filled=True,
                           rounded=True,
                           special_characters=True)

graphviz.Source(dot_data)
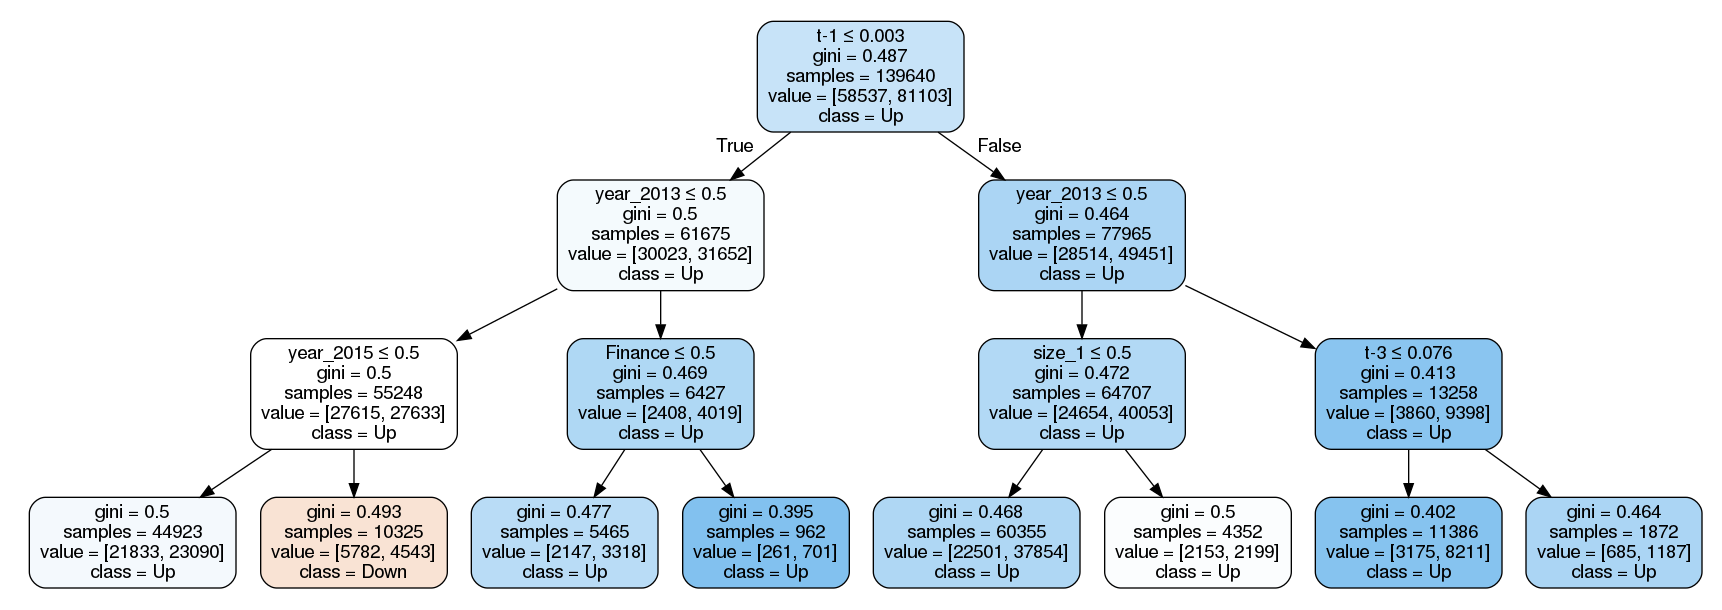
The result shows that the model uses a variety of different features and indicates the split rules for both continuous and categorical (dummy) variables. The chart displays, under the label value, the number of samples from each class and, under the label class, the most common class (there were more up months during the sample period):