
When comparing average cross-validation AUC across the four test runs with the three libraries, we find that CatBoost produces a slightly higher AUC score for the top-performing model, while also producing the widest dispersion of outcomes, as shown in the following graph:

The top-performing CatBoost model uses the following parameters (see notebook for detail):
- max_depth of 12 and max_bin of 128
- max_ctr_complexity of 2, which limits the number of combinations of categorical features
- one_hot_max_size of 2, which excludes binary features from the assignment of numerical variables
- random_strength different from 0 to randomize the evaluation of splits
Training is a bit slower compared to LightGBM and XGBoost (all use the GPU) at an average of 230 seconds per model.
A more detailed look at the top-performing models for the LightGBM and XGBoost models shows that the LightGBM Factors model achieves nearly as good a performance as the other two models with much lower model complexity. It only consists on average of 41 trees up to three levels deep with no more than eight leaves each, while also using regularization in the form of min_gain_to_split. It overfits significantly less on the training set, with a train AUC only slightly above the validation AUC. It also trains much faster, taking only 18 seconds per model because of its lower complexity. In practice, this model would be preferable since it is more likely to produce good out-of-sample performance. The details are shown in the following table:
|
|
LightGBM dummies |
XGBoost dummies |
LightGBM factors |
|
Validation AUC |
68.57% |
68.36% |
68.32% |
|
Train AUC |
82.35% |
79.81% |
72.12% |
|
learning_rate |
0.1 |
0.1 |
0.3 |
|
max_depth |
13 |
9 |
3 |
|
num_leaves |
8192 |
|
8 |
|
colsample_bytree |
0.8 |
1 |
1 |
|
min_gain_to_split |
0 |
1 |
0 |
|
Rounds |
44.42 |
59.17 |
41.00 |
|
Time |
86.55 |
85.37 |
18.78 |
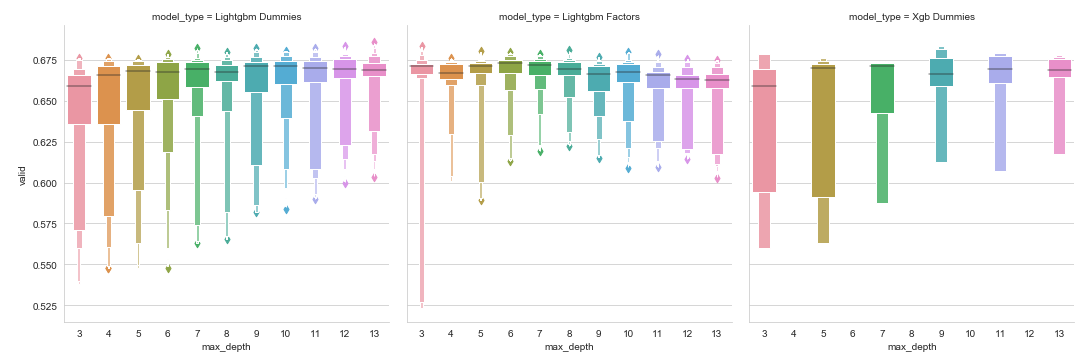
The following plot shows the effect of different max_depth settings on the validation score for the LightGBM and XGBoost models: shallower trees produce a wider range of outcomes and need to be combined with appropriate learning rates and regularization settings to produce the strong result shown in the preceding table:
Instead of a DecisionTreeRegressor as shown previously, we can also use linear regression to evaluate the statistical significance of different features concerning the validation AUC score. For the LightGBM Dummy model, where the regression explains 68% of the variation in outcomes, we find that only the min_gain_to_split regularization parameter was not significant, as shown in the following screenshot:

In practice, gaining deeper insights into how the models arrive at predictions is extremely important, in particular for investment strategies where decision makers often require plausible explanations.