
Similar to the mean reversion strategy we explored, we can build a trend-following strategy that uses the APO trading signal. The only difference here is that we enter long positions when the APO is above a certain value, expecting price moves to continue in that direction, and we enter short positions when the APO is below a certain value, expecting price moves to continue going down.
In effect, this is the exact opposite trading strategy with some differences in position management. One might expect this trading strategy to be exactly opposite in performance but, as we will see, that is not the case, that is, both trend-following and mean reversion strategies can be profitable in the same market conditions:
- First, we define the APO values we will use to enter long/short positions. In this case, the buy entry APO threshold is positive and the sell entry APO threshold is negative:
# Constants that define strategy behavior/thresholds
APO_VALUE_FOR_BUY_ENTRY = 10 # APO trading signal value above which to enter buy-orders/long-position
APO_VALUE_FOR_SELL_ENTRY = -10 # APO trading signal value below which to enter sell-orders/short-position
- Next, let's look at the core trading logic that enters and exits positions.
First, look at the signal and position management code that leads to sell trades:
  # This section checks trading signal against trading parameters/thresholds and positions, to trade.
# We will perform a sell trade at close_price if the following conditions are met:
  # 1. The APO trading signal value is below Sell-Entry threshold and the difference between last trade-price and current-price is different enough.
  # 2. We are long( positive position ) and either APO trading signal value is at or below 0 or current position is profitable enough to lock profit.
  if ((apo < APO_VALUE_FOR_SELL_ENTRY and abs(close_price - last_sell_price) > MIN_PRICE_MOVE_FROM_LAST_TRADE) # APO above sell entry threshold, we should sell
    or
    (position > 0 and (apo <= 0 or open_pnl > MIN_PROFIT_TO_CLOSE))): # long from positive APO and APO has gone negative or position is profitable, sell to close position
    orders.append(-1) # mark the sell trade
    last_sell_price = close_price
    position -= NUM_SHARES_PER_TRADE # reduce position by the size of this trade
    sell_sum_price_qty += (close_price*NUM_SHARES_PER_TRADE) # update vwap sell-price
    sell_sum_qty += NUM_SHARES_PER_TRADE
    print( "Sell ", NUM_SHARES_PER_TRADE, " @ ", close_price, "Position: ", position )
Now, let's look at the signal and position management code that leads to buy trades:
  # We will perform a buy trade at close_price if the following conditions are met:
  # 1. The APO trading signal value is above Buy-Entry threshold and the difference between last trade-price and current-price is different enough.
  # 2. We are short( negative position ) and either APO trading signal value is at or above 0 or current position is profitable enough to lock profit.
  elif ((apo > APO_VALUE_FOR_BUY_ENTRY and abs(close_price - last_buy_price) > MIN_PRICE_MOVE_FROM_LAST_TRADE) # APO above buy entry threshold, we should buy
    or
    (position < 0 and (apo >= 0 or open_pnl > MIN_PROFIT_TO_CLOSE))): # short from negative APO and APO has gone positive or position is profitable, buy to close position
    orders.append(+1) # mark the buy trade
    last_buy_price = close_price
    position += NUM_SHARES_PER_TRADE # increase position by the size of this trade
    buy_sum_price_qty += (close_price*NUM_SHARES_PER_TRADE) # update the vwap buy-price
    buy_sum_qty += NUM_SHARES_PER_TRADE
    print( "Buy ", NUM_SHARES_PER_TRADE, " @ ", close_price, "Position: ", position )
  else:
    # No trade since none of the conditions were met to buy or sell
    orders.append(0)
The code to generate the visualization plots remains the same, so we've skipped it here. Let's look at trend-following trading strategy performance:

The plot shows at what prices the buy and sell trades are made throughout the lifetime of the trading strategy applied to Google stock data. The trading strategy behavior will make more sense when we inspect the APO signal values to go along with the actual trade prices. Let's look at that in the next plot:

By the definition of a trend-following strategy using the APO trading signal values, intuitively we expect buy trades when APO signal values are positive and sell trades when APO signal values are negative. There are also some buy trades when APO signal values are negative and some sell trades when APO signal values are positive, which might seem counterintuitive, but these are trades made to close out profitable positions, similar to the mean reversion strategy. Now, let's look at the evolution of positions through the course of this trading strategy:

Here, compared to the mean reversion trading strategy, there are more long positions than short positions, and the positions are usually small and closed quickly and a new position (likely long) is initiated shortly after. This observation is consistent with the fact that this is a trend-following strategy applied to a strongly upward-trending trading instrument such as the Google stock. Since Google stocks have been steadily trending upward over the course of this trading strategy, it makes sense that most of the positions are long and also makes sense that most of the long positions end up being profitable and are flattened shortly after being initiated. Finally, let's observe the evolution of PnL for this trading strategy:
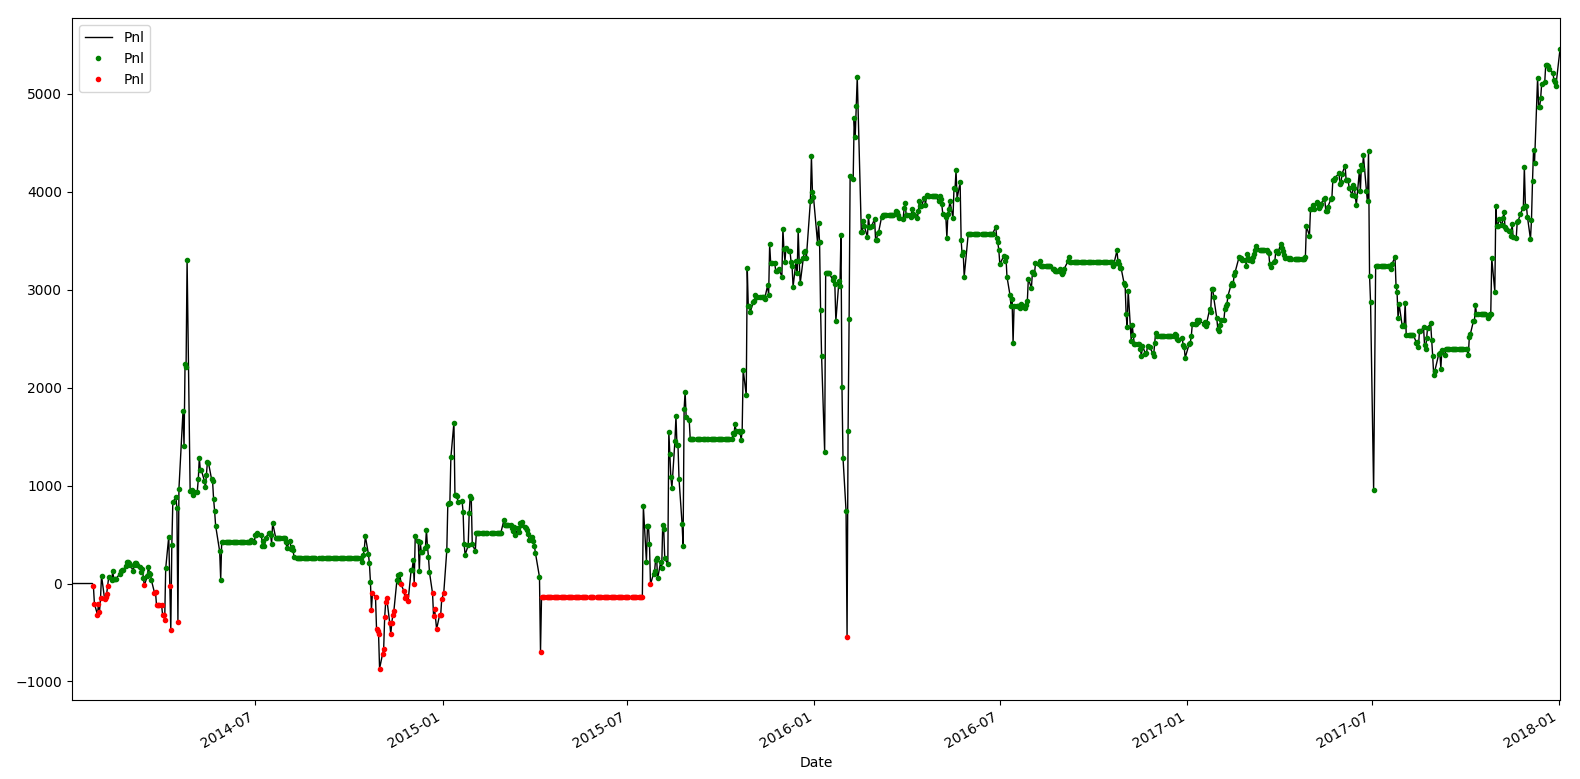
So, for this case, the trend-following strategy makes a third of the money that the mean reversion strategy makes; however, the trend-following strategy also makes money for the same market conditions by entering and exiting positions at different price points.