Position limits are also quite straightforward and intuitive to understand. It is simply the maximum position, long or short, that the strategy should have at any point in its trading lifetime. It is possible to have two different position limits, one for the maximum long position and another for the maximum short position, which can be useful, for instance, where shorting stocks have different rules/risks associated with them than being long on stocks does. Every unit of open position has a risk associated with it. Generally, the larger the position a strategy puts on, the larger the risk associated with it. So, the best strategies are the ones that can make money while getting into as small a position as possible. In either case, before a strategy is deployed to production, it is important to quantify and estimate what the maximum positions the strategy can get into, based on historical performance, so that we can find out when a strategy is within its normal behavior parameters and when it is outside of historical norms.
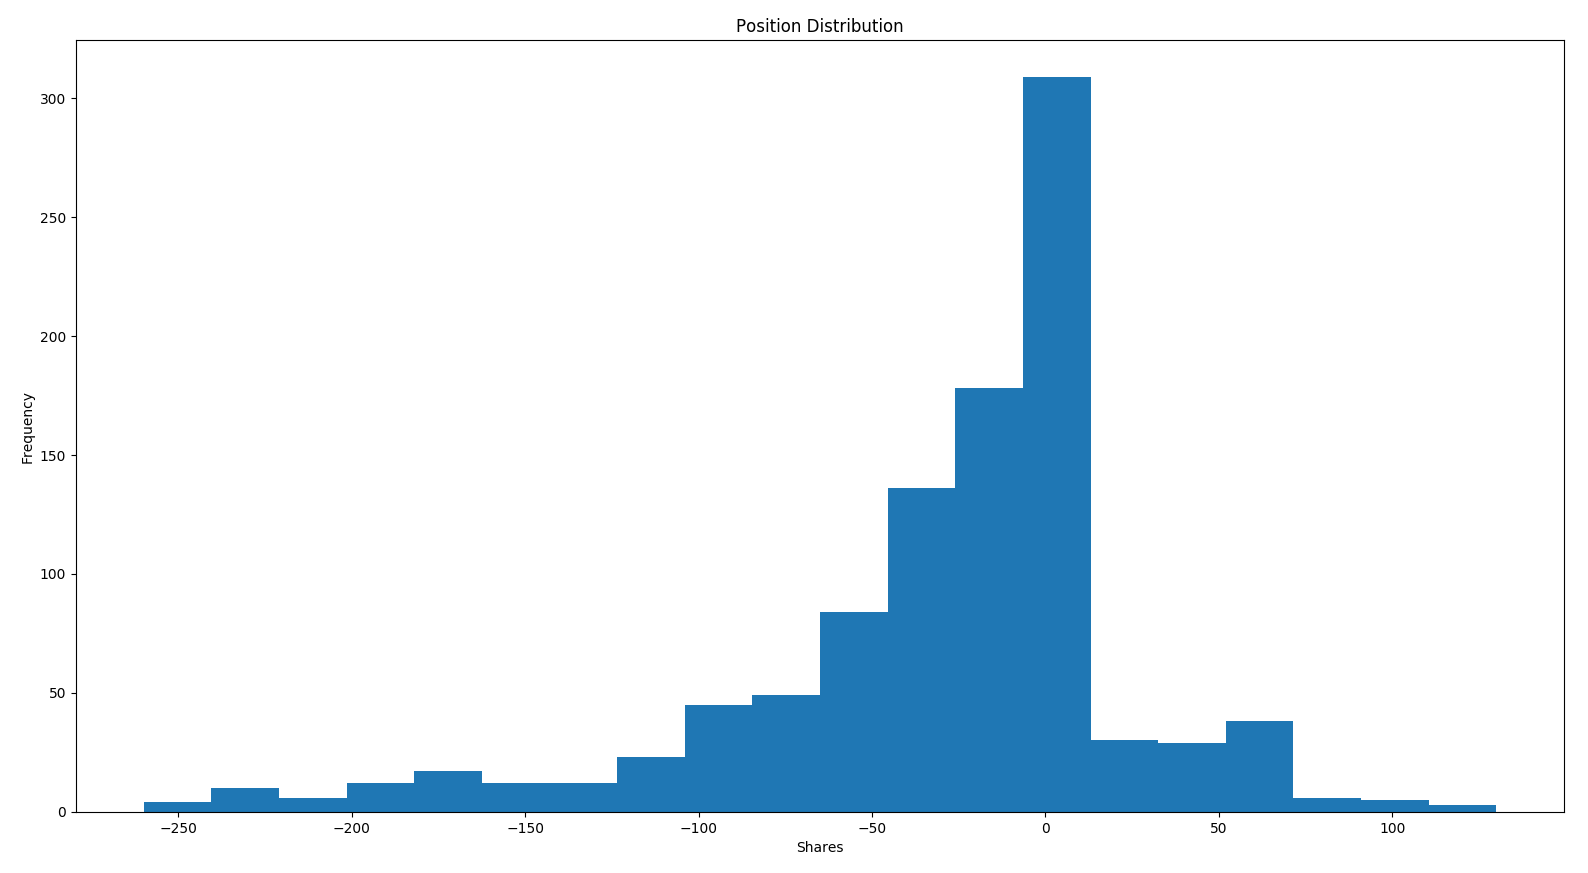
Finding the maximum position is straightforward. Let's find a quick distribution of the positions with the help of the following code:
position = results['Position']
plt.hist(position, 20)
plt.gca().set(title='Position Distribution', xlabel='Shares', ylabel='Frequency')
plt.show()
The preceding code will generate the following output. Let's have a look at the position distribution chart:

We can see the following from the preceding chart:
- For this trading strategy, which has been applied to Google stock data, the strategy is unlikely to have a position exceeding 200 shares and has never had a position exceeding 250.
- If it gets into position levels exceeding 250, we should be careful that the trading strategy is still performing as expected.
