
In the risk management system we built in the previous section, we used static risk limits that we used for the duration of the strategy's lifetime. In practice, however, this is never the case. When a new algorithmic trading strategy is built and deployed, it is first deployed with very low-risk limits—usually the least amount of risk possible. This is for a variety of reasons, the first one being to make tests and work out software implementation bugs, if there are any. The larger the amount of new code being deployed to live markets, the greater the risk. The other reason is to make sure strategy behavior is consistent with what is expected based on historical performance analysis. It is usually monitored very closely by multiple people to make sure nothing unexpected happens. Then, after a couple of days or weeks, when initial bugs have been worked out and strategy performance is in line with simulation performance, it is slowly scaled up to take more risks in order to generate more profits.
Conversely, after a strategy goes through a bad patch of losses, it is often reevaluated at reduced risk limits to check whether the trading strategy's performance has degraded from historical expectations and if it is no longer profitable to deploy it in live markets anymore. The obvious objective is to make as much money as possible, but achieving that requires not only a good risk check system but also a good system to adjust risk through different PnL profiles in the lifetime of the strategy.
A simple intuitive approach to adjusting risk in trading can be to start with low risk, increase the risk slightly after a good performance, and reduce the risk slightly after a poor performance. This is generally the approach that's followed by most participants: the challenges are to quantify good/poor performance in order to increase/decrease risk and to quantify the amount by which to increase/decrease risk.
Let's look at a practical implementation using our previous volatility adjusted mean reversion strategy with risk checks. We will increase the trade size and risk after a good month and reduce the trade size and risk after a bad month by a small increment. Let's get started:
- First, we will define the limits of how small a trade size can be and what the maximum allowed trade size can be over the course of the strategy's lifetime. For this implementation, we allow no less than 1 share per trade and no more than 50 per trade. Every time we have a good/bad month, we will increase/decrease the trade size by 2 shares. We will start very small, as we discussed previously, and increment slowly if we continue to do well. Let's have a look at the code:
MIN_NUM_SHARES_PER_TRADE = 1
MAX_NUM_SHARES_PER_TRADE = 50
INCREMENT_NUM_SHARES_PER_TRADE = 2
num_shares_per_trade = MIN_NUM_SHARES_PER_TRADE # Beginning number of shares to buy/sell on every trade
num_shares_history = [] # history of num-shares
abs_position_history = [] # history of absolute-position
- Next, we will define similar minimum, maximum, and increment values for the different risk limits. As the strategy trade size evolves over time, the risk limits will also have to be adjusted to accommodate the increased trading size:
# Risk limits and increments to risk limits when we have good/bad months
risk_limit_weekly_stop_loss = -6000
INCREMENT_RISK_LIMIT_WEEKLY_STOP_LOSS = -12000
risk_limit_monthly_stop_loss = -15000
INCREMENT_RISK_LIMIT_MONTHLY_STOP_LOSS = -30000
risk_limit_max_position = 5
INCREMENT_RISK_LIMIT_MAX_POSITION = 3
max_position_history = [] # history of max-trade-size
RISK_LIMIT_MAX_POSITION_HOLDING_TIME_DAYS = 120 * 5
risk_limit_max_trade_size = 5
INCREMENT_RISK_LIMIT_MAX_TRADE_SIZE = 2
max_trade_size_history = [] # history of max-trade-size

last_risk_change_index = 0
- Now, let's look at the main loop trading section. We will only look at the sections that are different from the previous strategy, along with risk checks. Now, the minimum profit to close is no longer a constant but is a function of the number of shares per trade, which varies over time:
MIN_PROFIT_TO_CLOSE = num_shares_per_trade * 10
- Let's have a look at the main trading section. It will require some changes so that it adapts to the changing trade sizes. Let's look at the sell trade logic first:
  if (not risk_violated and
      ((apo > APO_VALUE_FOR_SELL_ENTRY * stdev_factor and abs(close_price - last_sell_price) > MIN_PRICE_MOVE_FROM_LAST_TRADE * stdev_factor) # APO above sell entry threshold, we should sell
       or
       (position > 0 and (apo >= 0 or open_pnl > MIN_PROFIT_TO_CLOSE / stdev_factor)))): # long from -ve APO and APO has gone positive or position is profitable, sell to close position
    orders.append(-1) # mark the sell trade
    last_sell_price = close_price
    if position == 0: # opening a new entry position
      position -= num_shares_per_trade # reduce position by the size of this trade
      sell_sum_price_qty += (close_price * num_shares_per_trade) # update vwap sell-price
      sell_sum_qty += num_shares_per_trade
      traded_volume += num_shares_per_trade
      print("Sell ", num_shares_per_trade, " @ ", close_price, "Position: ", position)
    else: # closing an existing position
      sell_sum_price_qty += (close_price * abs(position)) # update vwap sell-price
      sell_sum_qty += abs(position)
      traded_volume += abs(position)
      print("Sell ", abs(position), " @ ", close_price, "Position: ", position)
      position = 0 # reduce position by the size of this trade
Finally, let's look at the buy trade logic:
  elif (not risk_violated and
        ((apo < APO_VALUE_FOR_BUY_ENTRY * stdev_factor and abs(close_price - last_buy_price) > MIN_PRICE_MOVE_FROM_LAST_TRADE * stdev_factor) # APO below buy entry threshold, we should buy
         or
         (position < 0 and (apo <= 0 or open_pnl > MIN_PROFIT_TO_CLOSE / stdev_factor)))): # short from +ve APO and APO has gone negative or position is profitable, buy to close position
    orders.append(+1) # mark the buy trade
    last_buy_price = close_price
    if position == 0: # opening a new entry position
      position += num_shares_per_trade # increase position by the size of this trade
      buy_sum_price_qty += (close_price * num_shares_per_trade) # update the vwap buy-price
      buy_sum_qty += num_shares_per_trade
      traded_volume += num_shares_per_trade
      print("Buy ", num_shares_per_trade, " @ ", close_price, "Position: ", position)
    else: # closing an existing position
      buy_sum_price_qty += (close_price * abs(position)) # update the vwap buy-price
      buy_sum_qty += abs(position)
      traded_volume += abs(position)
      print("Buy ", abs(position), " @ ", close_price, "Position: ", position)
      position = 0 # increase position by the size of this trade
  else:
    # No trade since none of the conditions were met to buy or sell
    orders.append(0)

  positions.append(position)
- After adjusting the PnLs, as shown in the preceding code, we will add an implementation to analyze monthly performance and increase trade size and risk limits if we had a good month and decrease trade size and risk limits if we had a bad month. First, we will look at the logic to increase the trading risk after a good month of performance:
  if len(pnls) > 20:
    monthly_pnls = pnls[-1] - pnls[-20]

    if len(pnls) - last_risk_change_index > 20:
      if monthly_pnls > 0:
        num_shares_per_trade += INCREMENT_NUM_SHARES_PER_TRADE
        if num_shares_per_trade <= MAX_NUM_SHARES_PER_TRADE:
          print('Increasing trade-size and risk')
          risk_limit_weekly_stop_loss += INCREMENT_RISK_LIMIT_WEEKLY_STOP_LOSS
          risk_limit_monthly_stop_loss += INCREMENT_RISK_LIMIT_MONTHLY_STOP_LOSS
          risk_limit_max_position += INCREMENT_RISK_LIMIT_MAX_POSITION
          risk_limit_max_trade_size += INCREMENT_RISK_LIMIT_MAX_TRADE_SIZE
        else:
          num_shares_per_trade = MAX_NUM_SHARES_PER_TRADE
- Now, let's look at some similar logic, but which reduces risk after a month of poor performance:
      elif monthly_pnls < 0:
        num_shares_per_trade -= INCREMENT_NUM_SHARES_PER_TRADE
        if num_shares_per_trade >= MIN_NUM_SHARES_PER_TRADE:
          print('Decreasing trade-size and risk')
          risk_limit_weekly_stop_loss -= INCREMENT_RISK_LIMIT_WEEKLY_STOP_LOSS
          risk_limit_monthly_stop_loss -= INCREMENT_RISK_LIMIT_MONTHLY_STOP_LOSS
          risk_limit_max_position -= INCREMENT_RISK_LIMIT_MAX_POSITION
          risk_limit_max_trade_size -= INCREMENT_RISK_LIMIT_MAX_TRADE_SIZE
        else:
          num_shares_per_trade = MIN_NUM_SHARES_PER_TRADE

      last_risk_change_index = len(pnls)
- Now, we need to look at the code to track the risk exposure evolution over time:
  # Track trade-sizes/positions and risk limits as they evolve over time
  num_shares_history.append(num_shares_per_trade)
  abs_position_history.append(abs(position))
  max_trade_size_history.append(risk_limit_max_trade_size)
  max_position_history.append(risk_limit_max_position)
- Finally, let's visualize the performance and the evolution of trade sizes and risk limits over time:
data = data.assign(NumShares=pd.Series(num_shares_history, index=data.index))
data = data.assign(MaxTradeSize=pd.Series(max_trade_size_history, index=data.index))
data = data.assign(AbsPosition=pd.Series(abs_position_history, index=data.index))
data = data.assign(MaxPosition=pd.Series(max_position_history, index=data.index))

data['NumShares'].plot(color='b', lw=3., legend=True)
data['MaxTradeSize'].plot(color='g', lw=1., legend=True)
plt.legend()
plt.show()

data['AbsPosition'].plot(color='b', lw=1., legend=True)
data['MaxPosition'].plot(color='g', lw=1., legend=True)
plt.legend()
plt.show()
The following plots are the output of the preceding code. Let's have a look at the visualizations that we are already familiar with:
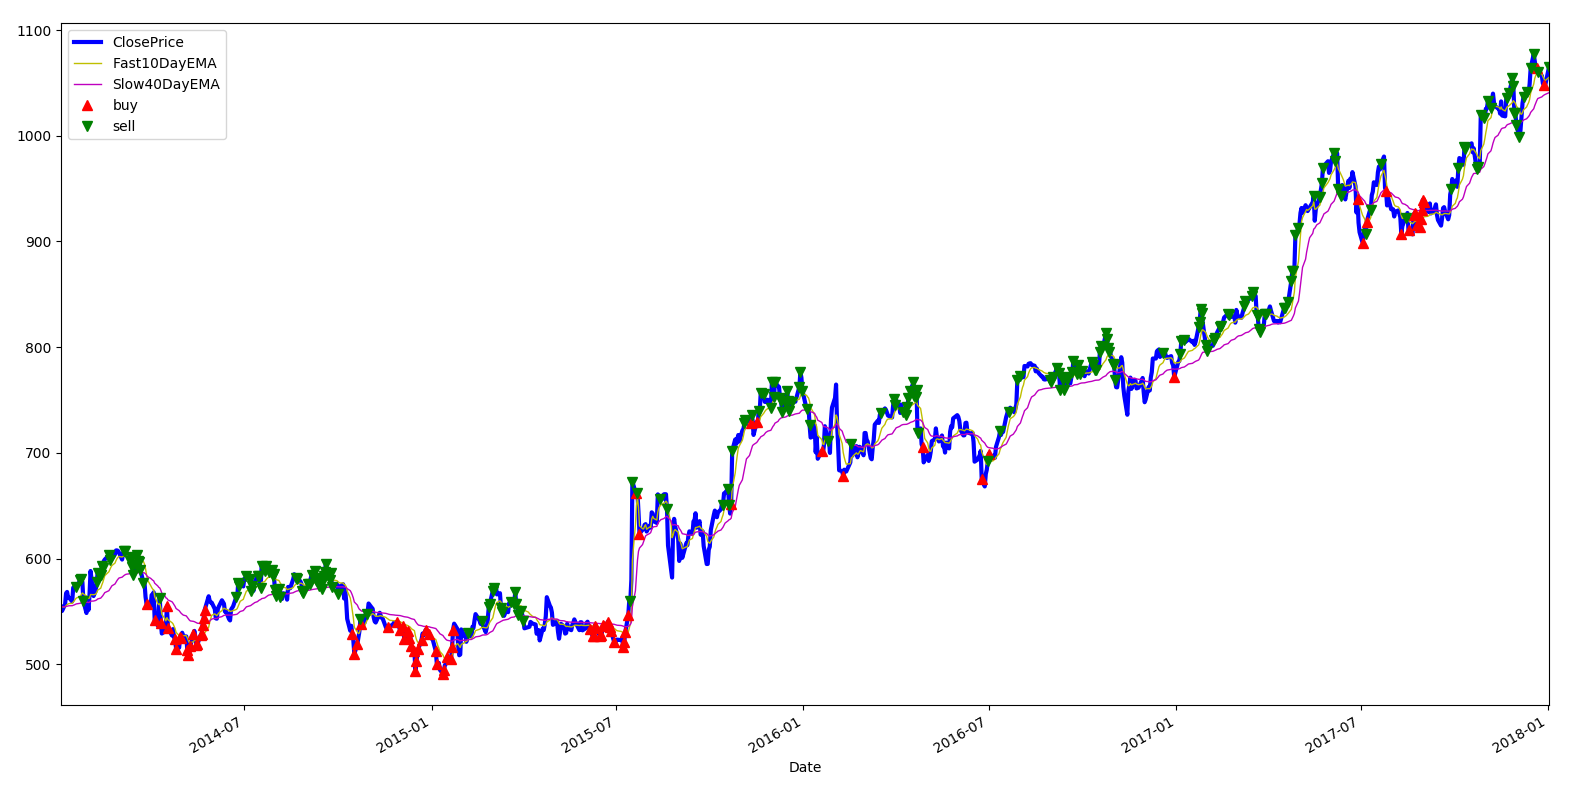
The plot that shows buy and sell trades overlaid on Google stock prices still stay consistent with what we've seen in the past, which shows that strategy behavior remains mostly unchanged as it goes through phases of risk increases and decreases:
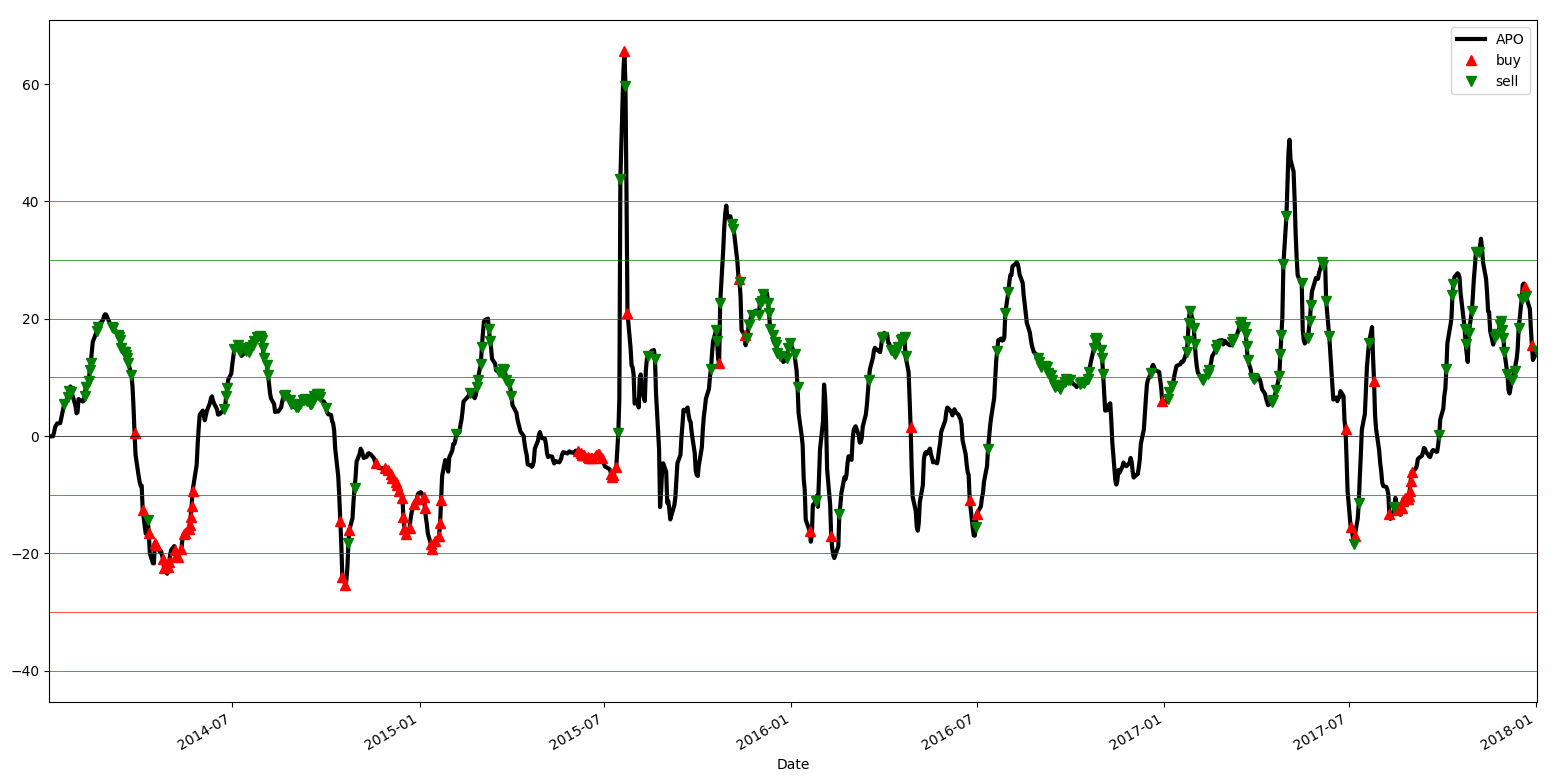
The buy and sell trades that are overlaid on APO signal value changes also stay consistent with the expected strategy behavior, which we're used to from our previous analysis of mean reversion trading strategy:

As shown in the preceding plot, the position plot is especially interesting because it shows how the magnitude of the positions increases over time. Initially, they are very small (less than 10 shares) and slowly increase over time as strategy performance stays consistently good and becomes quite large (more than 40 shares):
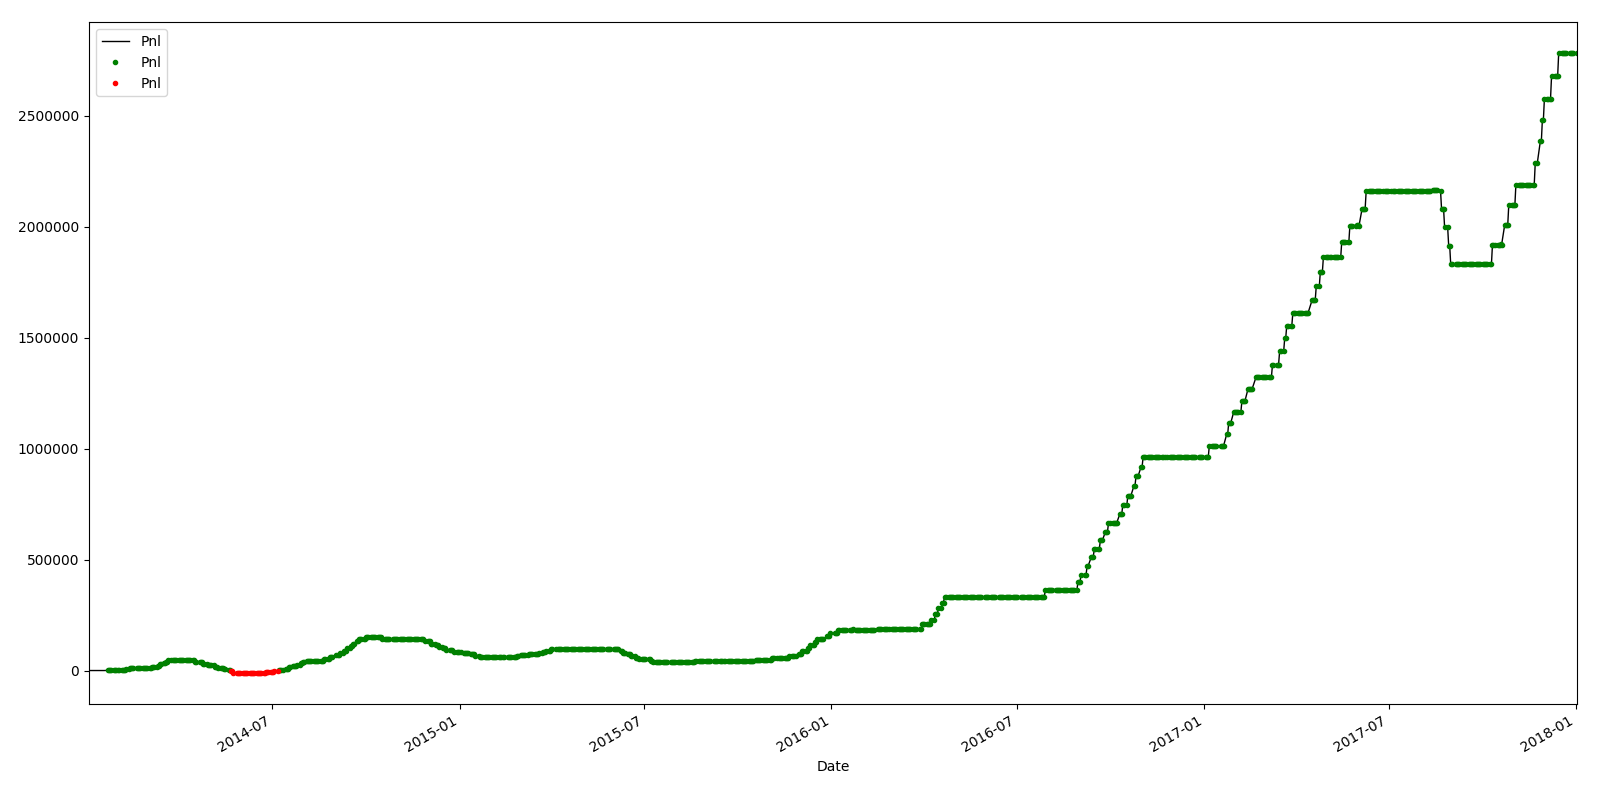
As shown in the preceding plot, the PnL plot is also quite interesting and reflects what we would expect it to show. It slowly increases initially when we are trading small sizes and over time, the trading sizes increase and the PnLs increase much faster with the larger trade size and risk limits:

As shown in the preceding plot, the trade size and max trade size risk limit evolution plot shows that, initially, we start with 1 share per trade, then increase it slowly when we have a positive month, then decrease it slowly when we have a negative month. Around 2016, the strategy gets into a streak of consecutively profitable months and causes the trade size to increase every month:
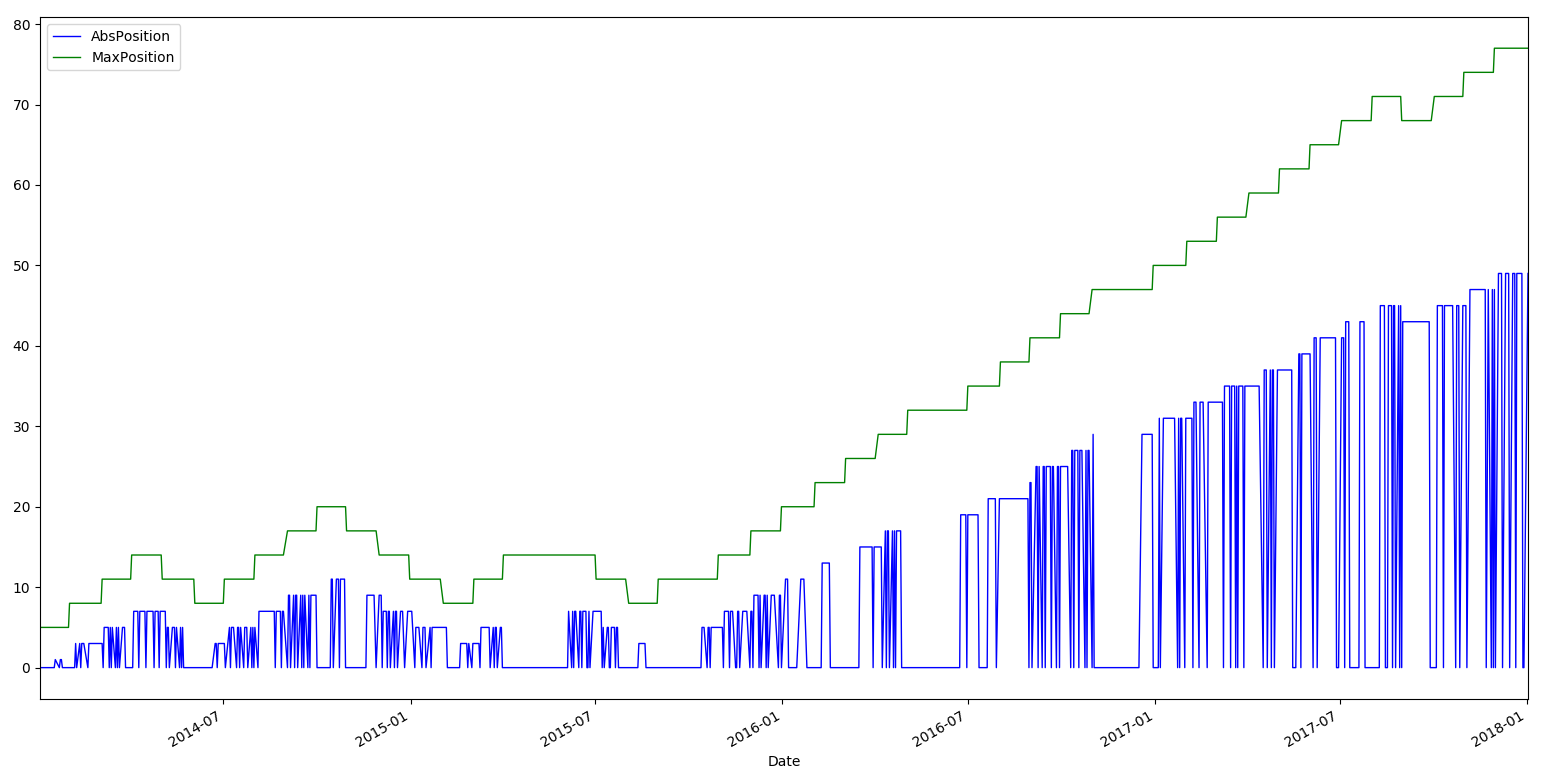
As shown in the preceding plot, the absolute positions that the strategy puts on, as well as the max position risk limit evolution plot, stay consistent with expectations, that is, starting low and then increasing as we get into a streak of consecutive good months.