Prometheus is a cross-platform application written in Go, so it can run in a Windows container or a Linux container. Like other open source projects, the team publishes a Linux image on Docker Hub, but you need to build your own Windows image. I'm using an existing image that packages Prometheus into a Windows Server 2019 container from the same dockersamples/aspnet-monitoring example on GitHub that I used for the ASP.NET exporter.
The Dockerfile for Prometheus doesn't do anything you haven't already seen plenty of times in this book—it downloads the release file, extracts it, and sets up the runtime environment. The Prometheus server has multiple functions: it runs scheduled jobs to poll metrics endpoints, it stores the data in a time-series database, and it provides a REST API to query the database and a simple Web UI to navigate the data.
I need to add my own configuration for the scheduler, which I could do by running a container and mounting a volume for the config file, or using Docker config objects in swarm mode. The configuration for my metrics endpoints is fairly static, so it would be nice to bundle a default set of configurations into my own Prometheus image. I've done that with dockeronwindows/ch11-prometheus:2e, which has a very simple Dockerfile:
FROM dockersamples/aspnet-monitoring-prometheus:2.3.1-windowsservercore-ltsc2019
COPY prometheus.yml /etc/prometheus/prometheus.yml
I already have containers running from my instrumented API and NerdDinner web images, which expose metrics endpoints for Prometheus to consume. To monitor them in Prometheus, I need to specify the metric locations in the prometheus.yml configuration file. Prometheus will poll these endpoints on a configurable schedule. It calls this scraping, and I've added my container names and ports in the scrape_configs section:
global:
  scrape_interval: 5s

scrape_configs:
  - job_name: 'Api'
    static_configs:
      - targets: ['api:50505']

  - job_name: 'NerdDinnerWeb'
    static_configs:
      - targets: ['nerd-dinner:50505']
Each application to monitor is specified as a job, and each endpoint is listed as a target. Prometheus will be running in a container on the same Docker network, so I can refer to the targets by the container name.
Now, I can start the Prometheus server in a container:
docker container run -d -P --name prometheus dockeronwindows/ch11-prometheus:2e
Prometheus polls all the configured metrics endpoints and stores the data. You can use Prometheus as the backend for a rich UI component such as Grafana, building all your runtime KPIs into a single dashboard. For basic monitoring, the Prometheus server has a simple Web UI listening on port 9090.
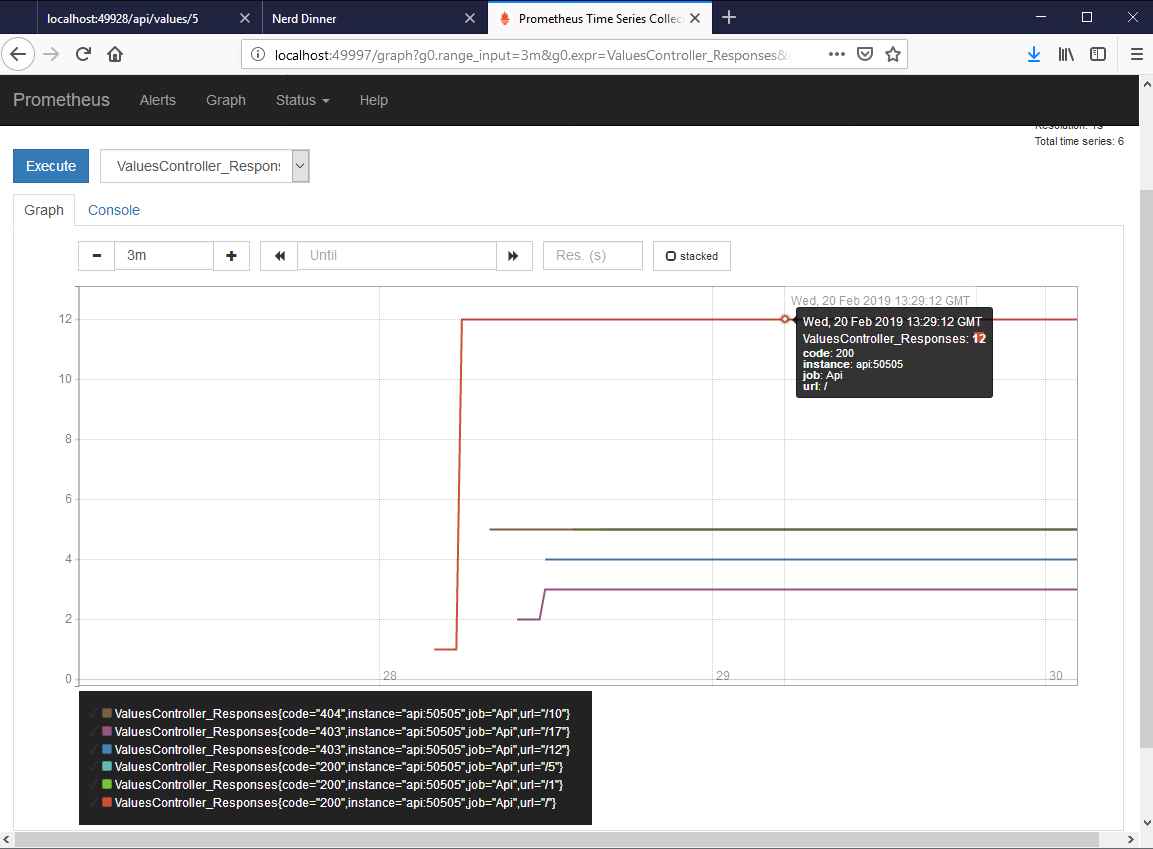
I can go to the published port of the Prometheus container to run some queries over the data it's scraping from my application containers. The Prometheus UI can present the raw data, or aggregated graphs over time. Here's the HTTP response that's sent by the REST API application:

You can see that there are separate lines for each different label value, so I can see the different response codes from different URLs. These are counters that increase with the life of the container, so the graphs will always go up. Prometheus has a rich set of functions so that you can also graph the rate of change over time, aggregate metrics, and select projections over the data.
Other counters from the Prometheus NuGet package are snapshots, such as performance counter statistics. I can see the number of requests per second that IIS is handling from the NerdDinner container:

Metric names are important in Prometheus. If I wanted to compare the memory usage of a .NET Console and an ASP.NET app, then I can query both sets of values if they have the same metric name, something like process_working_set. The labels for each metric identify which service is providing the data, so you can aggregate across all your services or filter to specific services. You should also include an identifier for each container as a metric label. The exporter app adds the server hostname as a label. That's actually the container ID, so when you're running at scale, you can aggregate for the whole service or look at individual containers.
In Chapter 8, Administering and Monitoring Dockerized Solutions, I demonstrated Universal Control Plane (UCP), the Containers-as-a-Service (CaaS) platform in Docker Enterprise. The standard APIs to start and manage Docker containers lets this tool present a consolidated management and administration experience. The openness of the Docker platform lets open source tools take the same approach to rich, consolidated monitoring.
Prometheus is a good example of that. It runs as a lightweight server, which is well-suited to running in a container. You add support for Prometheus to your application either by adding a metrics endpoint to your app, or by running a metrics exporter alongside your existing app. The Docker Engine itself can be configured to export Prometheus metrics, so you can collect low-level metrics about container and node health.
Those metrics are all you need to power a rich dashboard that tells you about the health of your application at a glance.
