
Chapter 6: Visual Programming with Dynamo
Visual programming enables users to create a script by changing graphical elements rather than text programming, which is the typical process for developing a code. Basically, we are creating algorithms without writing code:
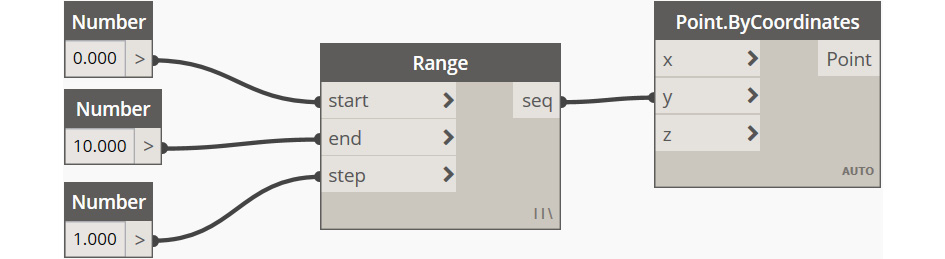
Figure 6.1 – Dynamo graphical elements
Users don't require any programming experience to start using visual programming applications, such as Dynamo, and automate Revit tasks, but it requires dedication to learn and master a new process.
Dynamo is an open source software that enables visual programming for Revit, Civil 3D, and other software.
The principles of Dynamo follow three basic processes:
INPUT + FUNCTIONS AND OPERATIONS + OUTPUT
We will be able to increase productivity in Revit by using Dynamo to automate multiple workflows and complete repetitive tasks quickly.
This chapter will provide you with a basic knowledge of Dynamo and demonstrate the importance of mastering this application to increase efficiency in Revit.
The chapter will also provide you with an introduction to Dynamo, show the most commonly used Dynamo packages, and explain how to use certain workflows with Dynamo.
The following topics will be covered in this chapter:
- Dynamo
- Expanding Dynamo
- Best practices
Technical requirements
In this chapter, you will need access to Autodesk Revit. The version used to describe all of these exercises is Revit 2021, but you can follow along with another version. It's important to take the following into consideration:
- Different versions might be slightly different from each other.
- Older versions of Revit cannot open files from an earlier version.
All datasets used for this chapter can be found in the book's GitHub repository at https://github.com/PacktPublishing/-Increasing-Autodesk-Revit-Productivity-for-BIM-Projects.
Introducing Dynamo
Productivity in business is a significant factor for a company's performance. Increasing productivity is a process for working smarter in a pre-defined time frame to match your project deadline.
Productivity methodologies are as follows:
- Time management
- Tasks completed by the workforce
- Personal performance
- Ratio to manufacture a product
Dynamo will increase productivity by improving your performance to complete a repetitive task and work with complex geometry.
Dynamo is an open source application that can be used as a standalone Sandbox or connected with other software, such as Revit, Maya, Civil3D, or any other application that has an API (short for Application Programming Interface) available.
It is designed to expand Revit's capability by automating processes and workflows. It will not add new tools to Revit, but it will help to automate existing tools for almost unlimited tasks and modeling processes.
Let's start by accessing Dynamo from Revit:
- Open a new Revit project.
- From the Manage tab, go to the Visual Programming panel.

Figure 6.2 – Visual Programming panel
- Click on Dynamo.
After clicking, the Dynamo window will appear:

Figure 6.3 – Dynamo canvas
For more information about Dynamo, please refer to the following link:
QR code:

Tip
This can be accessed by clicking Dynamo Website from the Dynamo Start page, where you can access the main web page with all the information about the software.
To access video tutorials, please refer to the following link:
QR code:

Tip
This can be accessed by clicking Video Tutorials from the Dynamo Start page.
There is a vast community available where it is possible to not only learn from the rest of the community, but also to share knowledge. The following link will allow access to the forum:
QR code:

Tip
This can be accessed by clicking Discussion Forum from the Dynamo Start page.
There is also a dictionary where we can find Dynamo-related information. This is continuing to evolve as the community updates it from time to time:
QR code:

Tip
This can be accessed by clicking Dynamo Dictionary from the Dynamo Start page.
What is a visual programming tool?
A visual programming tool allows all users (programmers and non-programmers) to use the tool more interactively. This way, it facilitates how they will be working with the software by making a graph (visual script).
Working with Dynamo
Working in conjunction with Revit software, Dynamo enables progressive learning typically in three stages:
- Experts: Develop parametric and complex models.
- Intermediates: Perform QA/QC checks.
- Beginners: Manage data in Revit models to import and export information.
Dynamo version
When working with Dynamo, it is crucial to know which Dynamo version we are working on.
On a project level, and when a Dynamo script is developed, it is important to always keep the same Dynamo version as some of the packages may vary from one version to the next. To find out which Dynamo version we are working on, perform the following steps:
- From the Help pull-down menu, click About:
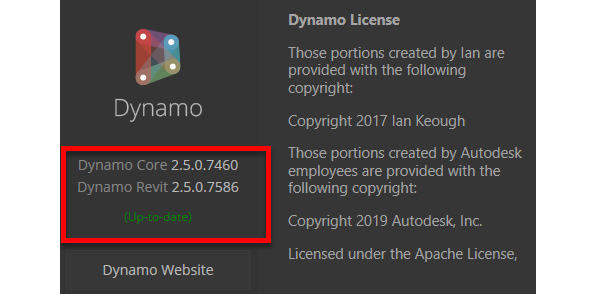
Figure 6.4 – About Dynamo window
It is essential to keep Dynamo updated, but bear in mind that before updating to a more recent version, all Dynamo graphs that are in use on projects can still be used in the newer version.
Creating a new script
As an overview, we can say that Dynamo's main output is a graph that connects to Revit models. This graph creates a dependency relationship with the Revit elements. Having said this, we can say that working with Dynamo means building a graph to edit Revit elements.
All nodes available in Dynamo are organized as follows:
- Libraries
- Categories
- Subcategories

Figure 6.5 – Dynamo library structure
Tip
By hovering the mouse over a subcategory, Dynamo will bring up a tip with a description of the tool.
When users want to add nodes to the canvas, they usually use the search area and type the node-related name:

Figure 6.6 – Search node
When any user needs to add a new node, it is possible (and faster) to right-click in the canvas and type the node's name in the Search area.
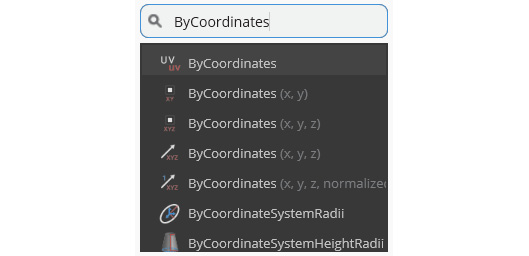
Figure 6.7 – Searching a node through the context menu
After clicking the subcategory, the node will be added to the canvas. Each node has a structure similar to the following:

Figure 6.8 – Node structure
When starting to work with Dynamo, it is essential to understand all these areas as they will provide important information from the node itself.
Creating a simple graph
To create a graph in Dynamo, we need to fire up from one node to another by clicking from the node's output to the next node's input. When developing a graph, it should be read from the left-hand side to the right-hand side. The same order will be followed by Dynamo when we execute it.
To start creating a new graph, perform the following steps:
- From the Dynamo Splash Screen, click New.
- Right-click in the canvas and search for the following:
- Number
- Point
- Watch
- For each search result, click on the following:
- Number Slider
- By Coordinates
- Watch
- From the Number Slider node, click on the right-hand side arrow output and click again on any of the point coordinates' input (X, Y or Z):
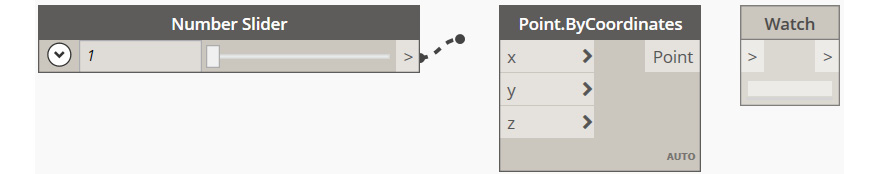
Figure 6.9 – Connecting nodes
- Do the same from the Point.ByCoordinates node to the Watch node.
By default, Dynamo is set up to run automatically following any change, so you will be able to see the result:

Figure 6.10 – Connecting nodes
The results will be automatically updated by changing which coordinate we want to use or by adding more sliders and assigning them to different inputs:

Figure 6.11 – Changing how a script will run
As a good practice, we recommend always having it as manual. Otherwise, with every single change, the script will run automatically. By changing it, only when the user clicks Run will Dynamo execute the script.
To conclude, we have learned how to know which Dynamo version is installed and how to start creating a simple graph using the nodes that are available when installing the software.
In the next section, we will learn how to install and manage the already installed Dynamo packages and add or identify existing Python scripts. We will also cover how to run a script using Dynamo and the Dynamo Player.
Expanding Dynamo
When working with Dynamo, some scripts will require further development by using the Python computational language. Using Python is an essential skill in becoming an expert in Dynamo.
As the Dynamo community is based on an open source environment, many users share these graphs with all other users and are available to be installed at any time. These packages are Dynamo version-specific, and that's why it is essential to always keep track of all versions that are available and have been installed.
It is not recommended to update them in the middle of a project but, if it is really necessary, update them only if the design team agrees. By not doing this control, it may happen that the scripts developed and used during the project will no longer work because of these updates.
Bear in mind that if this is an open source community, there is no guarantee that these packages shared previously will be maintained for future versions.
Advanced users will develop their scripts as this will stop these dependencies of having packages developed by a third-party individual or company.
Dynamo packages
One of the most important activities that needs to be done is to install and manage Dynamo packages.
There is a massive list of packages available that can be used when working with Dynamo. It would be almost impossible to know all the available packages, and even knowing that, there are new scripts and packages shared on a daily basis.
To access the list of all available packages, perform the following steps:
- Open Revit and, from the Manage tab, click on Dynamo:

Figure 6.12 – Opening Dynamo from Revit
- From the top menu, click on Packages and then select Manage Packages...:
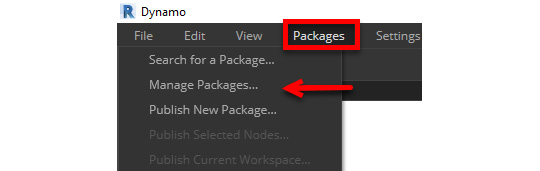
Figure 6.13 – Managing installed packages
- In the new window, click on the Package Manager Website button:
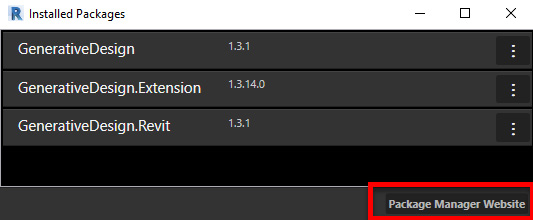
Figure 6.14 – Installed Packages Manager
This will allow users to access the Dynamo Package Manager. This web page shows all the packages available, how many installations were performed, and how many registered authors have developed scripts:

Figure 6.15 – Dynamo Package Manager web page
Along with this information, it is possible to see which are the newest packages shared with the community, which packages have been updated most recently, which packages have been installed the most, and which packages are depended on the most.
These packages are shared by community members and should be consumed and installed with confidence in the community. There is a list of authors where we can see who has the most votes, who is the most active, and who has the most packages installed.
You can access this information by referring to the following link:
QR code:

Installing packages
When sharing a Dynamo script, it is vital to ensure that all users will have the same packages that need to be installed to run it. This is very important as any user can install a package available by accessing it directly from Dynamo.
To install packages, perform the following steps:
- Open Revit and, from the Manage tab, click on Dynamo.
- From the top menu, click on Packages and select Search for a Package…:
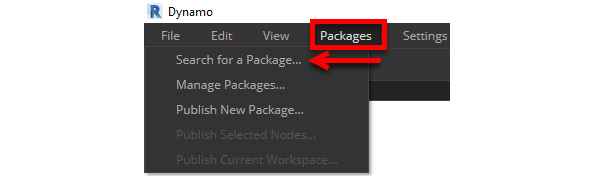
Figure 6.16 – Installing a package
- In the new window, under Search, click the package name to be searched – Rhythm.
When typing the package name, Dynamo filters the results available:
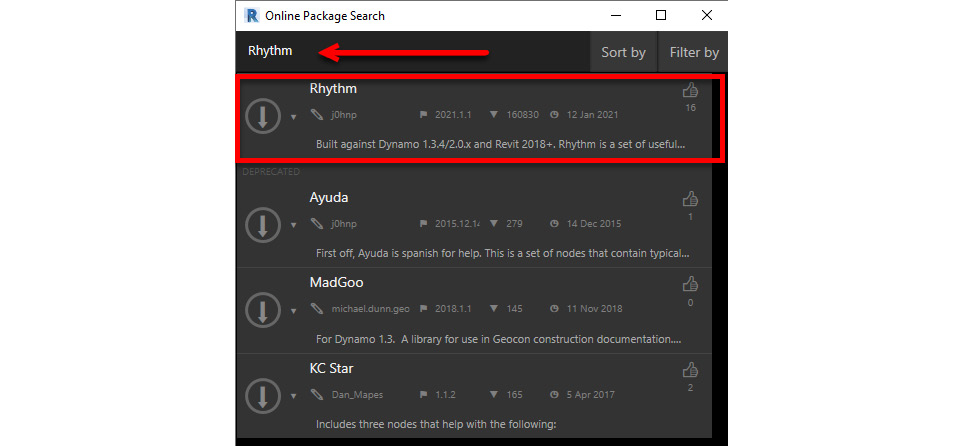
Figure 6.17 – Online package available
- To install the package, click the arrow on the left-hand side:

Figure 6.18 – Package installation
Tip
By clicking the package's description, it is possible to access the package's history, and a specific version can be installed, if available.
- A window will pop up to confirm installation:
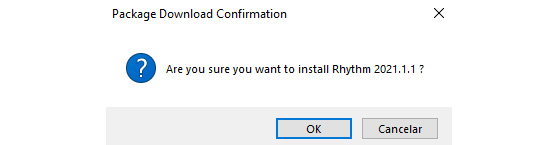
Figure 6.19 – Package installation
If the package installed has dependencies, for example, Python scripts or binaries, a warning pops up to confirm whether it can be installed.
Important Note
As Python scripts may affect your computer, please ensure that the source from where the script is being downloaded can be trusted.
Depending on which Dynamo version is being used, the package that the user is trying to install might not be compatible with the current Dynamo version:
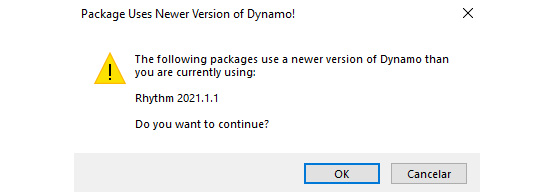
Figure 6.20 – Package installation confirmation
Once the package has been installed, Dynamo will show that information:
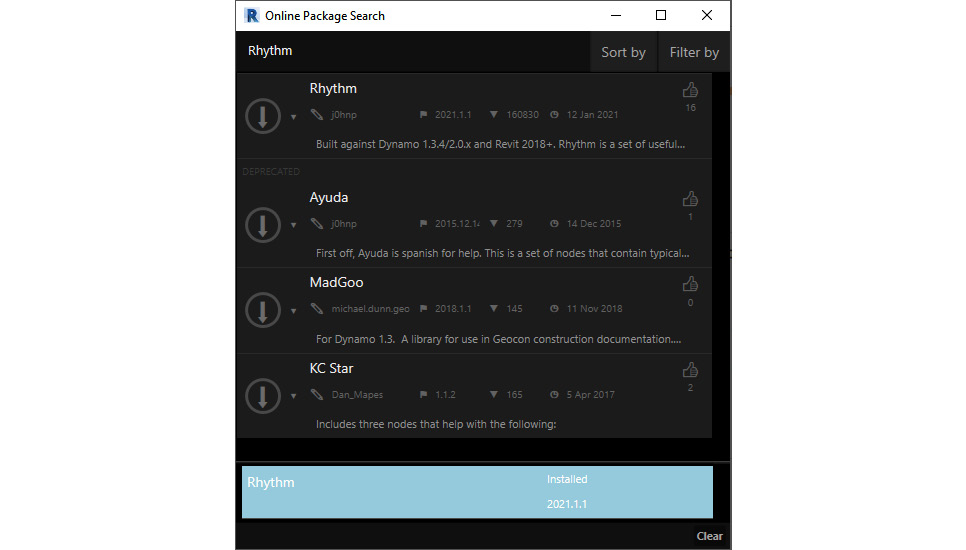
Figure 6.21 – Package installed
Although it is possible to install as many packages as you want, it is recommended to keep the number of packages at the minimum required. Ensure that only trusted packages will be installed since, when executing them, this may corrupt the model.
Here is a list of some excellent packages that we recommend to be installed:
- Archilab.net
- Clockwork
- Lunchbox
- Rhythm
- Spring Nodes
When installed, they will be available in the Add-ons library:
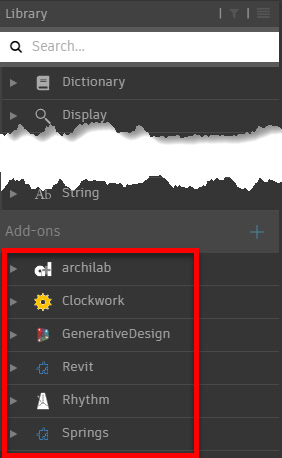
Figure 6.22 – New packages installed and available
Using the Dynamo forum will allow you to be aware of more interesting packages that can be used.
Managing installed packages
To manage the list of all packages installed, perform the following steps:
- Open Revit and, from the Manage tab, click on Dynamo:

Figure 6.23 – Opening Dynamo from Revit
- From the top menu, click on Packages and then select Manage Packages…:

Figure 6.24 – Managing installed packages
- To uninstall a package, click the icon on the right-hand side and select Uninstall…:
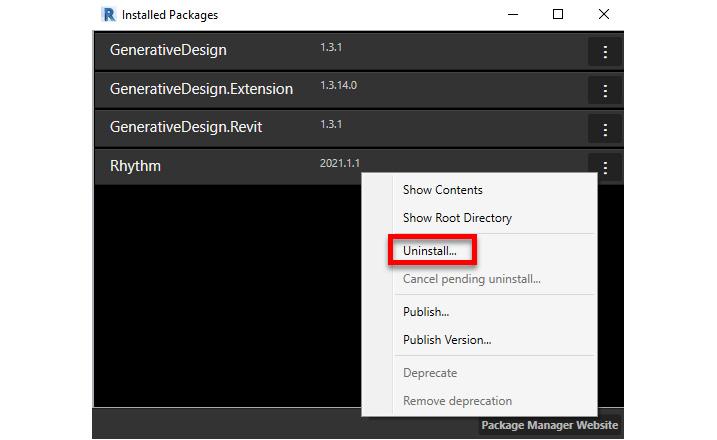
Figure 6.25 – Uninstalling packages
A warning pops up informing you that, after uninstalling, Dynamo needs to be closed and restarted:
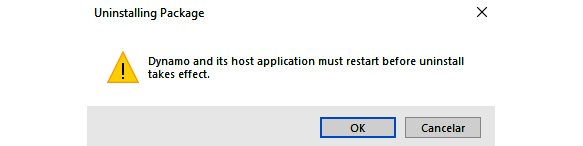
Figure 6.26 – Message to restart before uninstallation is executed
Another warning will be presented to the user to confirm whether the package should be uninstalled. After clicking on Yes, the package will be uninstalled:
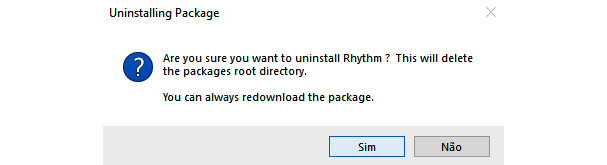
Figure 6.27 – Confirmation of uninstalling
After uninstalling a package, some of the scripts with dependencies on the packages installed will not be able to run.
Expanding Dynamo with Python
Python is one of the most popular programming languages, and it can be used to develop Dynamo scripts as it is user-friendly and easy to learn.
As mentioned before, by developing our Python scripts, we can avoid having external dependencies (no packages needed), and the scripts can be more optimized and quick to execute on a project.
It is recommended to develop bespoke scriptings based on what the project demands with regard to automation. This is possible as Python can connect with the Revit API – a set of communication methods between various components of the software, to interact with Revit elements.
By way of a summary, these are the advantages of using Python:
- It does not depend on other Dynamo dependencies.
- It can be more structured regarding the use of nodes.
- It is much faster and objective regarding the task to be developed.
Dynamo has a built-in editor for Python. To access it, perform the following steps:
- Search for a Python node:

Figure 6.28 – Python Script node
- Double-click in the light gray area to access the editor:
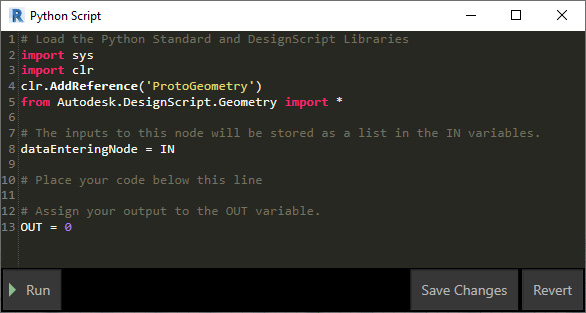
Figure 6.29 – Python editor
After adding all script lines, by clicking on Save Changes, the node will be recorded automatically and kept in Dynamo:

Figure 6.30 – Python node
For more information about Python, please refer to the following link:
QR code:

For more information about the Revit API, please refer to the following link:
QR code:

Dynamo Workflows
It requires some experience to develop graphs, but you can build your skills and increase productivity with Dynamo over time. Before running the graph, ensure that you are running the correct graph with all the packages installed as required.
Before running the script, confirm that you understand what is required as input. This might require some confidence in editing graphs to add what is necessary regarding the selected inputs.
Automating sheet creation
In this step-by-step process, we will be importing some data from an Excel file, and it will be used to create sheet placeholders. It is possible to add any information required by adding another column and use the header with the Parameter name (case sensitive).
To use Dynamo on a Revit project for this workflow, perform the following steps:
- Open Revit and then open the Project_Sample-Dynamo.rvt file.
- Under the Manage tab, click on Dynamo.
- In the Dynamo window, click File and then select Open. Select the script AutomateSheetCreation-Dynamo.dyn:
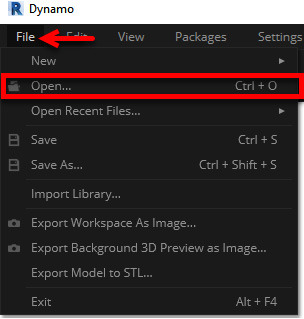
Figure 6.31 – Opening scripts
After opening, confirm the script should run in Manual mode.
As mentioned before, when running a script, it may be necessary to give some inputs before running the script. In this exercise, we will be selecting the Excel file. It is essential to take the following into consideration:
a. The Excel file needs to be selected, and the sheet number should be unique.
b. The sheet name must be taken into consideration.
c. The first lines from the excel needs to be ignored as they are the excel headers (First row of the data).
- Click Browse and then select the Excel file, DrawingList.xlsx.
- Ensure that the sheet name matches the one in the node.
- Confirm whether the number of headers matches the number in Excel:

Figure 6.32 – Inputs to be confirmed
- Click Run.
Going back to Revit, all the sheet placeholders have been created and are ready to be used:
Figure 6.33 – Sheet placeholders in Revit
When creating the sheets, all the information will be populated accordingly:
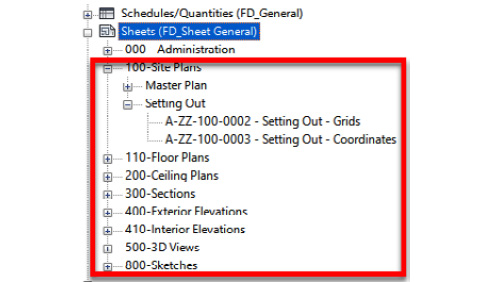
Figure 6.34 – Sheets created in Revit
How to use Dynamo Player
Dynamo Player is a handy feature that allows users to run a Dynamo script more simply without opening Dynamo. It can be configured to set a specific folder with a list of scripts with all users within an organization.
It is easy to keep the folder updated and ensure that all users will be using the same scripts.
Setting up Dynamo Player
Dynamo Player needs to be open from Revit, and it is not necessary to open any Dynamo instance. If necessary, the script can be opened from Dynamo Player. Let´s go through the exercise:
- Open Revit and then open the Project_Sample-DynamoPlayer.rvt file.
- Under the Manage tab, click on Dynamo Player:

Figure 6.35 – Opening Dynamo Player
A new window will open where it is possible to configure where all the scripts will be accessed:
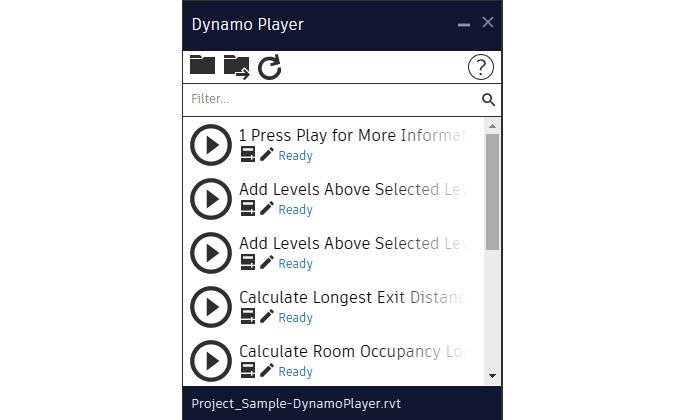
Figure 6.36 – Dynamo Player
At the top of the floating window, we have three icons that allow users to do the following:
- Browse to Folder: This option allows users to select the folder from which the scripts can be accessed.
- View Current Folder: This option allows users to open the folder where the scripts are saved.
- Refresh: This option allows users to refresh the list of scripts available in the folder, and which are listed here.
We can access all scripts available in the folder defined as the central folder where all the scripts should be saved:
- List of scripts: This option allows users to select which script needs to be run by clicking the Play icon.
When clicking the Play icon, the script will be executed. If the script requires user inputs, it will be requested by Dynamo Player:

Figure 6.37 – User inputs using Dynamo Player
We recommend using Dynamo Player as the main tool to run scripts, knowing that some of the scripts are better for advanced users as they may be more demanding.
To set up the folder where all the scripts should be kept, perform the following steps:
- Click on the Browser to Folder icon and select the DynamoScripts folder:
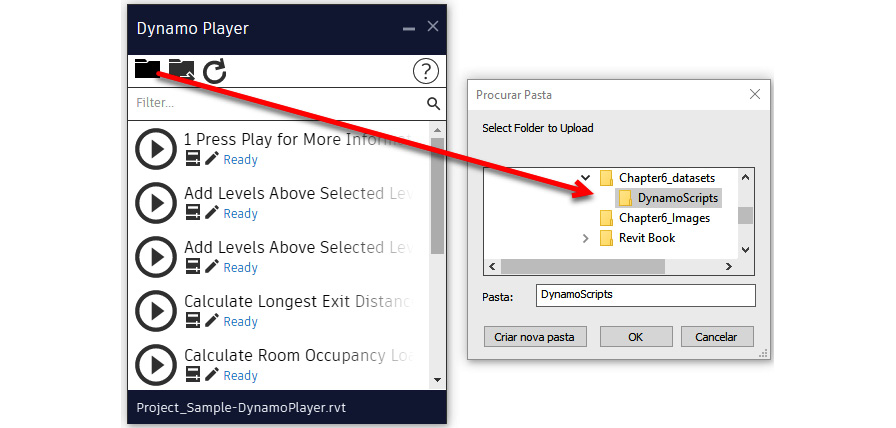
Figure 6.38 – Setting up the folder to save the Dynamo scripts
- Click OK.
All the scripts available in that folder will be listed.
Another important aspect that we need to bear in mind is that some scripts may require inputs. To have the nodes defined as inputs, it needs to be done by using Dynamo:
- Hover the mouse over the node and right-click.
- Select Is Input:
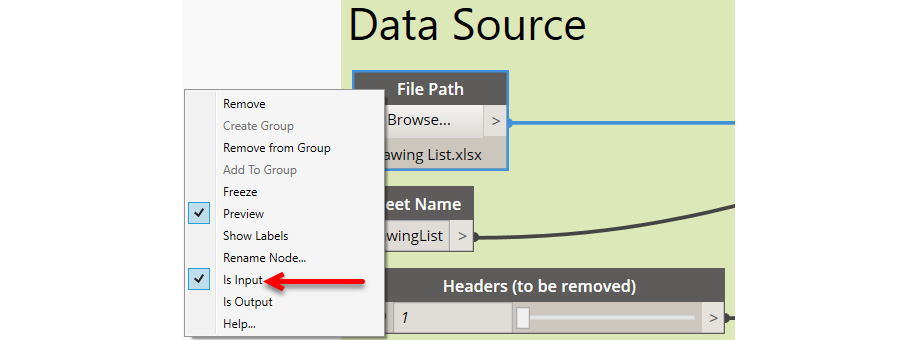
Figure 6.39 – Defining nodes as "Is Input"
This needs to be done to all nodes that need to be used as Inputs as it will allow Dynamo Player to show it to the user.
Running a script with Dynamo Player
Now that the script is ready to request the inputs, let's run a script with Dynamo Player:
- Click on the Play icon.
- Dynamo Player pops up all the inputs required.
- Once all of them are filled, click on the Play icon again:
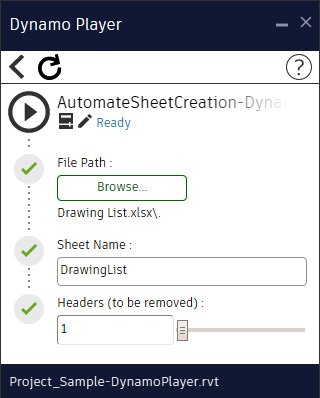
Figure 6.40 – Script inputs
After running the scripts, all the placeholders will be created as expected if there are no errors.
To conclude, we have learned how to install and managing Dynamo packages. We also explained how to add and edit Python nodes, which is very useful for users with Python programming knowledge.
We learned how to run a script using the Dynamo Player to facilitate the process of using Dynamo and improve productivity.
In the next section, we will describe what should be the best practices when creating a graph.
Best practices
When constructing a graph, it is quite common to add nodes all over the place:
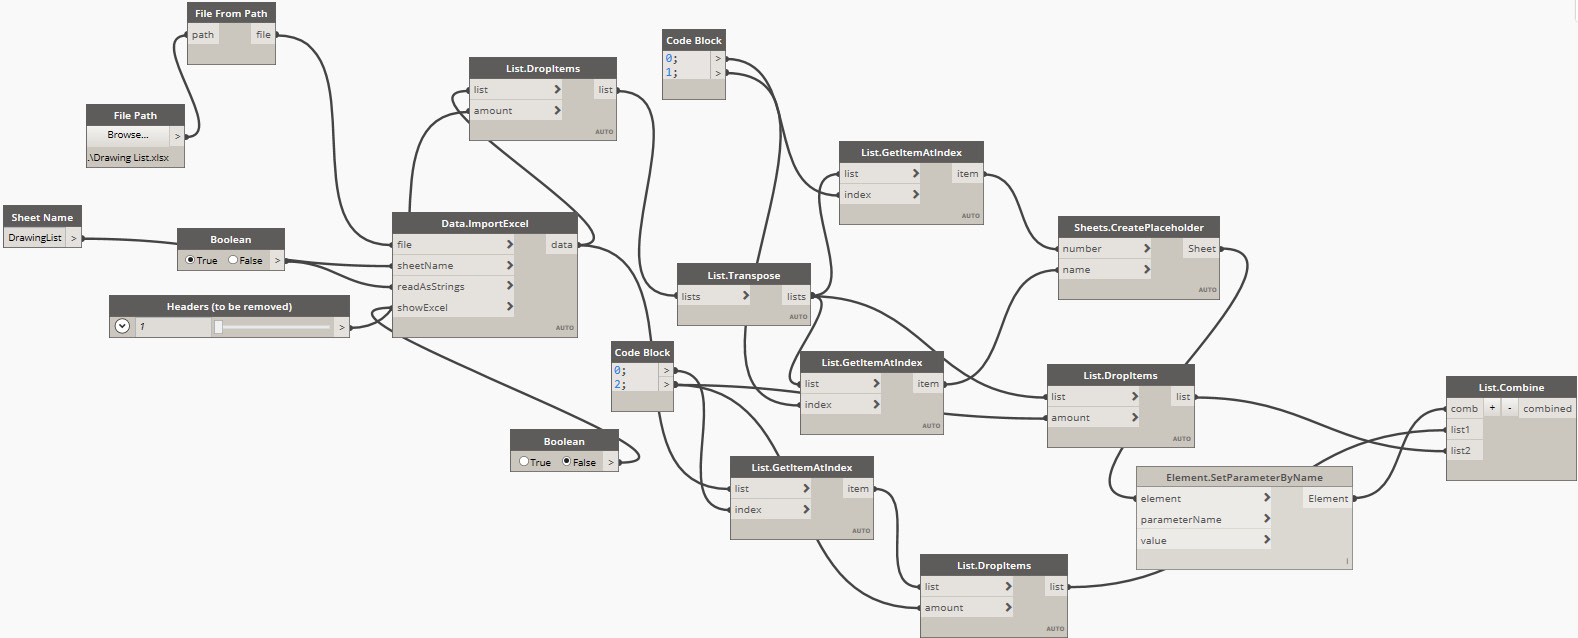
Figure 6.41 – A disorganized Dynamo graph
When a graph becomes more complex, it will be hard to read or even to maintain. For that reason, it is essential when a user is developing a script to keep it organized as much as possible. This becomes a critical aspect when it is distributed across multiple teams.
As best practices, we recommend the following:
- Organize the graph properly:
a. Group the graph as much as possible into different functionalities.
b. Order the script from left to right.
c. When having parallel processes at the same time, order the script vertically:
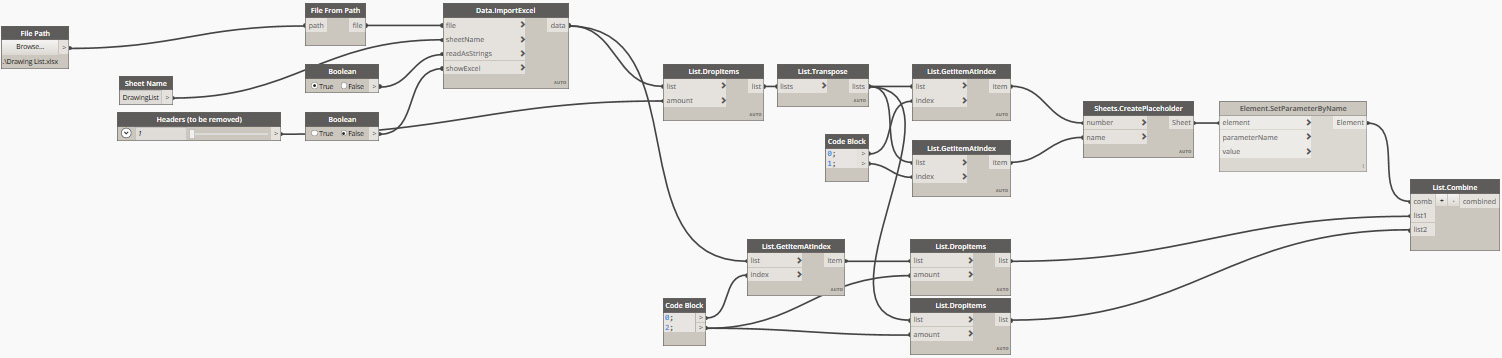
Figure 6.42 – A properly structured Dynamo script
- Name everything properly:
a. All groups should be named with a clear title indicating the group's overall function (with a large font size to be visible when zoomed out).
b. All code blocks, custom nodes, Python nodes, and other useful objects should be appropriately named in an informative way to help users understand the whole graph better.
c. Name the parameters/code block variables:

Figure 6.43 – Groups and nodes appropriately named
- Use a Color Code for the groups according to the categories used:
a. Input
b. Control
c. Function
d. Output

Figure 6.44 – Color code for groups
- Add, as many as are required:
a. If required, add them as a panel or note.
b. Additional information should be added when required:

Figure 6.45 – Notes added to the graph
All this extra information will make the script easier to read as it will identify whatever should be used and whatever needs to be understood before using the script.
As this script might be used for a large number of team members and may be shared across projects and teams, it is essential to add some valuable information, including the following:
- TITLE: This is what the script does in general.
- AUTHOR'S NAME: If, for some reason, there is a problem with the script and it needs to be amended or explained, you know who to ask.
- DESCRIPTION: This option explains what the script will do.
- DATE: This is when the script was developed.
- DEPENDENCIES: This option indicates which packages are required in order to use the script, and which versions per package.

Figure 6.46 – Adding a header with important information about the script
Once the graph is complete, it should be clear and easy to understand. Having this standard in place will help to maintain consistency across all scripts:

Figure 6.47 – Dynamo Script following standards
Also, when an upgrade or any maintenance is required, it will be easier to access what needs to be changed and updated.
Summary
In this chapter, we have learned what Dynamo is and how users can work with Dynamo to improve performance and productivity.
We learned that Python is one of the most common Programming languages, and it can be used in Dynamo together with the Revit API. This connection can enhance what can be altered in Revit.
We learned how to use Dynamo Player as a feature to run scripts on a project. We also looked into how to set up a folder that can be used across the organization to share the most common scripts that can be used in multiple projects.
We shared the best practices that should be used when developing Dynamo scripts (which can be extended to all the software that requires specific visual programming, such as Grasshopper).
In the next chapter, we will cover how we can get and manage the dashboard using Power BI or other software, such as Excel.