Chapter 11: Using Logging, Metrics, and Debugging in gRPC on .NET
We have reached the final chapter of the book, and it covers a very important topic that will help you to identify problems easily if something in your gRPC application isn't working as expected when you are writing it. Also, you will learn how to monitor your application once it's up and running. This will allow you to identify any issues early and respond to them proactively rather than reactively.
We will start by going through various debugging techniques you can use on both the gRPC client and server. Of course, to debug your own code, all you have to do is place breakpoints in it. However, during the development of gRPC applications, you may encounter situations where it's not your own code that is generating an issue. Therefore, we will need to be able to extract as much information from the gRPC middleware as we can.
But once your application is up and running, you would want to know what it's doing. Otherwise, you wouldn't be able to diagnose any problems that may arise with it. This is why you need to capture various pieces of information in the logs, especially details of any errors that happen inside your application's logic.
Finally, you might want to collect other data to use for various types of analytics. For example, you might want to know how many requests your application receives, how many errors occur inside of it, and how long it takes for the requests to get processed. This is where the concept of metrics comes in.
In this chapter, we will cover all of these concepts. We will go through the following topics:
- Debugging gRPC client components inside a .NET application
- Debugging gRPC server components inside a .NET application
- Applying logs to gRPC
- Applying metrics to gRPC
By the end of this chapter, you will have learned how to diagnose unexpected behavior and any other problems when developing your gRPC application. You will also have learned how to monitor your application once it's up and running by getting it to write data into logs and by getting it to generate metrics.
Technical requirements
To follow the instructions in this chapter, you will need the following:
- A computer with a Windows, Mac, or Linux operating system (OS)
- A supported integrated development environment (IDE) or code editor (for example, Visual Studio, Visual Studio Code, or JetBrains Rider)
- The .NET 5 software development kit (SDK)
- A self-signed development HTTPS certificate enabled on your machine
The instructions on how to set all of these up were provided in Chapter 1, Creating a Basic gRPC Application on ASP.NET Core. All of the code samples used in this chapter can be found at https://github.com/PacktPublishing/Microservices-Communication-in-.NET-Using-gRPC/tree/main/Chapter-11.
Please visit the following link to check the CiA videos: https://bit.ly/3m3Wkht
Debugging gRPC client components inside a .NET application
We all know how to debug our own code. We can place breakpoints on the line we want to see the behavior of. We can get the code to output to the console. We can get it to output to a file.
But what if we need to debug a third-party library? What if it's not our own code that doesn't behave as expected and we need to know why? After all, unless you try to decompile the library or try to get hold of its source code, its internal code is inaccessible to us. But even if we could get hold of the source code, it would be cumbersome to apply it to our own solution.
Luckily, gRPC libraries on .NET allow you to debug their internal middleware. If you are getting some unexpected behavior from them, you will be able to capture their actions and see what they are trying to do.
We will now go through the techniques you can apply to obtain as much debugging information from gRPC components as possible. We will start with the gRPC client side. To debug gRPC from the client side, we will need to configure the server application to return detailed errors from it. This will allow us to identify the source of the problem down to the individual line. Then, we will apply interceptors to our client, which will allow us to intercept any type of communication event, log any relevant information from it, and handle any exceptions that may be thrown by the gRPC middleware.
Setting up shared gRPC dependencies
As we've done in the previous chapters, we will add a class library that will contain all of the gRPC dependencies we will need, and we will do this both on the server and the client side. This class library will then be used by both of the applications:
- Create a folder called GrpcAnalytics anywhere on your machine and initiate a solution by running the following command inside of it:
dotnet new sln
- In the solution folder, execute the following command to create a class library project:
dotnet new classlib -o GrpcDependencies
- Then, execute the following command to add the project to the solution:
dotnet sln add
GrpcDependencies/GrpcDependencies.csproj
- Now, navigate to the GrpcDependencies project folder. Execute the following command to add the necessary NuGet package. This will be the only package that we will need, as it already references all of the other gRPC libraries that we will be using:
dotnet add GrpcDependencies.csproj package
Grpc.AspNetCore
- Create a Protos folder inside the project folder and add a iot_analytics.proto file to it with the following content:
syntax = "proto3";
import "google/protobuf/empty.proto";
package iot_analytics;
service IotStatusManager {
rpc GetAllStatuses (google.protobuf.Empty) returns
(stream LocationStatusResponse);
rpc GetLocationStatus (LocationStatusRequest) returns
(LocationStatusResponse);
}
message LocationStatusRequest {
int32 location_id = 1;
}
message LocationStatusResponse {
int32 location_id = 1;
string location_name = 2;
string device_serial_number = 3;
int64 total_requests = 4;
int64 total_errors = 5;
}
- To finish off our class library, we will add the following block to the GrpcDependencies.csproj file:
<ItemGroup>
<Protobuf Include="Protosiot_analytics.proto" />
</ItemGroup>
So, as the name of our Protobuf suggests, we will pretend that we are monitoring the status of Internet of Things (IoT) devices. Next, we will build our gRPC service application and configure it so that the client will receive as much debugging information from it as possible.
Adding a gRPC service application and getting it to display detailed errors
In this example, we will intentionally make one of the remote procedure calls (RPCs) throw an error to see what information the client will receive. We will be able to see how this information changes depending on whether detailed errors have been enabled on the server. Here's how it's done:
- We will navigate back to our GrpcAnalytics solution folder and execute the following command to create a new gRPC service project:
dotnet new grpc -o IotDeviceManager
- We will then add this project to the solution by running the following command:
dotnet sln add
IotDeviceManager/IotDeviceManager.csproj
- Then, we will navigate to our project folder and add the reference to the class library we created earlier by inserting the following section into the IotDeviceManager.csproj file:
<ItemGroup>
<ProjectReference Include="..GrpcDependencies
GrpcDependencies.csproj" />
</ItemGroup>
- Also, because the class library already has a reference to the gRPC library that we need, we can remove any direct NuGet references from the IotDeviceManager.csproj file.
- We will then add a LocationDataCache.cs file to our project. The initial content of the file will be as follows:
using IotAnalytics;
using System;
using System.Collections.Generic;
using System.Linq;
namespace IotDeviceManager
{
public class LocationDataCache
{
private readonly List<LocationStatusResponse>
statuses;
public LocationDataCache()
{
statuses = new
List<LocationStatusResponse>();
}
- We will then add the following public methods to the class:
public IEnumerable<LocationStatusResponse>
GetAllStatuses()
{
return statuses;
}
public LocationStatusResponse GetStatus(int
locationId)
{
return statuses.FirstOrDefault(s =>
s.LocationId == locationId);
}
}
}
- We can pre-populate the statuses collection by inserting the following code into the constructor:
var random = new Random();
for (var i = 0; i < 100; i++)
{
statuses.Add(new LocationStatusResponse
{
LocationId = i + 1,
LocationName = $"Location {i}",
DeviceSerialNumber = $"{i}{i}{i}-DEMO-{i *
20}",
TotalRequests = random.Next(1000, 1000000),
TotalErrors = random.Next(1000)
});
}
- Next, we will add the gRPC service implementation to the Services folder of the project. The file we will insert into the folder will be called IotStatusManagerService.cs and it will have the following content:
using Google.Protobuf.WellKnownTypes;
using Grpc.Core;
using IotAnalytics;
using System.Threading.Tasks;
namespace IotDeviceManager.Services
{
public class IotStatusManagerService :
IotStatusManager.IotStatusManagerBase
{
private readonly LocationDataCache dataCache;
public IotStatusManagerService
(LocationDataCache dataCache)
{
this.dataCache = dataCache;
}
}
}
- Then, we will add rpc implementations as follows:
public override async Task GetAllStatuses(Empty
request, IServerStreamWriter<LocationStatusResponse>
responseStream, ServerCallContext context)
{
foreach (var status in dataCache.GetAllStatuses())
{
await responseStream.WriteAsync(status);
}
}
public override Task<LocationStatusResponse>
GetLocationStatus(LocationStatusRequest request,
ServerCallContext context)
{
throw new Exception("This call is not ready
yet.");
}
- So, this is where we have deliberately made one of the rpc implementations throw an error to see what will happen if the client tries to call it. Next, we will open the Startup class (or the Program.cs file if you are using .NET 6 project templates). In this file, we will add the following variable to indicate whether we are using the development environment:
private readonly bool isDevelopment =
Environment.GetEnvironmentVariable(
"ASPNETCORE_ENVIRONMENT") == "Development";
- Then, replace the content of the ConfigureServices method with the following. If you are using .NET 6, you will need to apply this code to the builder.Services property inside the main body of the code, and you will need to delete the existing builder.Services.AddGrpc call:
services.AddGrpc(options =>
{
options.EnableDetailedErrors = isDevelopment;
});
services.AddSingleton<LocationDataCache>();
services.AddSingleton<TracingInterceptor>();
So, we have enabled detailed errors if the code is running on the development environment. Otherwise, the server would be expected to produce only the standard error information, without revealing too many details.
- We will then need to register our newly added gRPC service implementation by adding the following statement to the UseEndpoints call:
endpoints.MapGrpcService<IotStatusManagerService>();
Note
If you are running your server-side application on a Mac, you will need to apply some modifications to it. The instruction on how to do so can be found in the Running a gRPC Service on a Mac section in Chapter 1, Creating a Basic gRPC Application on ASP.NET Core.
And now we have everything we need on the server side. Let's now build the client and add some extra debugging capabilities to it.
Adding a gRPC client with additional debugging capabilities
When an error comes from gRPC middleware on ASP.NET Core, it will throw an exception of the RpcException type. Of course, such an exception doesn't necessarily come from the internal components of gRPC libraries. We are free to throw this type of exception ourselves. But unless we throw an exception of this type manually, the only place it will be generated is in the internal gRPC middleware. And this is why – in order to diagnose the problem that originates inside the middleware – we need to catch an exception of this type.
We will now add a gRPC client and apply global exception handling to it. This means we won't have to catch it for every individual gRPC call. We will do this by applying the so-called interceptors. Also, once the client is completed, we will be able to see what happens with and without the EnableDetailedErrors option being set to true on the server:
- First, we will navigate back to our GrpcAnalytics solution folder and run the following command to create a new ASP.NET Core Web API project:
dotnet new webapi -o IotApiGateway
- We will then add the project to the solution by executing the following command:
dotnet sln add IotApiGateway/IotApiGateway.csproj
- Then, we will open our project folder and insert the following markup into the IotApiGateway.csproj file:
<ItemGroup>
<ProjectReference Include="..GrpcDependencies
GrpcDependencies.csproj" />
</ItemGroup>
- These are all of the dependencies we need. We will leave any existing NuGet dependencies as they are. Next, we will add a gRPC interceptor to the project. The interceptor will reside in the TracingInterceptor.cs file that will be placed into the root of the project folder. Its content will be as follows:
using Grpc.Core;
using Grpc.Core.Interceptors;
using System;
using System.Threading.Tasks;
namespace IotApiGateway
{
public class TracingInterceptor : Interceptor
{
}
}
- This is a custom class that will override the logic inside the standard gRPC interceptor that is run by the middleware. This class will allow us to trigger custom logic whenever a gRPC call of a particular type is made. We will add examples of interceptor methods for all call types. The first one is a blocking unary call, which will be as follows:
public override TResponse BlockingUnaryCall<TRequest,
TResponse>(TRequest request, ClientInterceptor
Context<TRequest, TResponse> context,
BlockingUnaryCallContinuation<TRequest,
TResponse> continuation)
{
try
{
return continuation(request, context);
}
catch (RpcException ex)
{
Console.WriteLine(ex);
throw;
}
}
- The continuation parameter allows us to call the next step in the middleware. And because the call is blocking, we can just return the result of the continuation call. It will throw an exception if there is a problem with the connection. Next, we will add a method for an async unary call:
public override AsyncUnaryCall<TResponse>
AsyncUnaryCall<TRequest, TResponse>(Trequest
request, ClientInterceptorContext<TRequest,
TResponse> context, AsyncUnaryCallContinuation
<TRequest, TResponse> continuation)
{
var call = continuation(request, context);
return new
AsyncUnaryCall<TResponse>(HandleCallResponse
(call.ResponseAsync), call.ResponseHeadersAsync,
call.GetStatus, call.GetTrailers,call.Dispose);
}
- In this case, because the call is asynchronous, we won't be able to just catch the exception by calling the continuation parameter. Instead, we can attach a custom handler to some of the actions. We have done this by attaching a call to HandleCallResponse to the ResponseAsync action. Whenever this method is called by the code that uses the client, this handler will be called. So, we can place all of our exception-handling logic there. We will add this method later. But for now, we will add a client-streaming call:
public override AsyncClientStreamingCall<TRequest,
TResponse> AsyncClientStreamingCall<TRequest,
TResponse>(ClientInterceptorContext<TRequest,
TResponse> context, AsyncClientStreamingCall
Continuation<TRequest, TResponse> continuation)
{
var call = continuation(context);
return new AsyncClientStreamingCall<TRequest,
TResponse>(
call.RequestStream,
HandleCallResponse(call.ResponseAsync),
call.ResponseHeadersAsync,
call.GetStatus,
call.GetTrailers,
call.Dispose);
}
- Because this type of call returns the same kind of response as a blocking unary call, we can apply the same handler to the method that returns its response. Next, we will add an interceptor method for a server-streaming call:
public override AsyncServerStreamingCall<TResponse>
AsyncServerStreamingCall<TRequest, TResponse>
(TRequest request, ClientInterceptorContext
<TRequest, TResponse> context, AsyncServer
StreamingCallContinuation<TRequest, TResponse>
continuation)
{
try
{
return continuation(request, context);
}
catch (RpcException ex)
{
Console.WriteLine(ex);
throw;
}
}
- In here, we can also associate handlers with various actions. But we will need to write a different type of handler – one that is appropriate to the action. After this, we will add an interceptor method for a bi-directional call:
public override AsyncDuplexStreamingCall<TRequest,
TResponse> AsyncDuplexStreamingCall<TRequest,
TResponse>(ClientInterceptorContext<TRequest,
TResponse> context, AsyncDuplexStreamingCall
Continuation<TRequest, TResponse> continuation)
{
try
{
return continuation(context);
}
catch (RpcException ex)
{
Console.WriteLine(ex);
throw;
}
}
- Once again, we haven't added any handlers to any of the actions. But you can experiment with this method and add your own. Finally, we will need to add the method for the actual handler that we referenced previously:
private async Task<TResponse> HandleCallResponse
<TResponse>(Task<TResponse> responseTask)
{
try
{
var response = await responseTask;
return response;
}
catch (RpcException ex)
{
Console.WriteLine(ex);
throw;
}
}
- And all we have to do now is add this interceptor to our client. To do so, we will modify our Startup class (or the Program.cs file if you are using .NET 6 project templates). Whichever file we are using, we need to make sure that we have the following using statement in it:
using IotAnalytics;
- Then, we will need to add the following code to the ConfigureServices method. If you are using a .NET 6 template, replace services with builder.Services, and insert this code anywhere before the Build action. If you are running your gRPC server on macOS, the Address option should be HTTP with the relevant port number added:
services.AddGrpcClient<IotStatusManager.IotStatus
ManagerClient>(options =>
{
options.Address = new
Uri("https://localhost:5001");
})
.AddInterceptor<TracingInterceptor>();
- The gRPC client has now been added to the dependency injection container and our custom interceptor has been added to it. We will now add a controller where we will be able to use the client. We will do this by adding a DevicesController.cs file to the Controllers folder with the following content:
using Google.Protobuf.WellKnownTypes;
using IotAnalytics;
using Microsoft.AspNetCore.Mvc;
using System.Collections.Generic;
using System.Threading;
using System.Threading.Tasks;
namespace IotApiGateway.Controllers
{
[ApiController]
public class DevicesController : ControllerBase
{
private readonly IotStatusManager
.IotStatusManagerClient client;
public DevicesController(IotStatusManager
.IotStatusManagerClient client)
{
this.client = client;
}
}
}
- We will then add endpoint methods that correspond with both of the rpc definitions in Protobuf:
[HttpGet("")]
public async Task<IEnumerable<LocationStatusResponse>>
GetAllStatuses()
{
var response = new List<LocationStatusResponse>();
using var call = client.GetAllStatuses(new
Empty());
while (await call.ResponseStream.MoveNext
(CancellationToken.None))
{
response.Add(call.ResponseStream.Current);
}
return response;
}
[HttpGet("{id}")]
public async Task<LocationStatusResponse>
GetStatus(int id)
{
return await client.GetLocationStatusAsync(new
LocationStatusRequest
{
LocationId = id
});
}
We are now ready to launch our application and see what error information will be logged from it. After all, it will be easy to trigger an error, as we haven't implemented one of the rpc definitions on the server. Nonetheless, we have the code that will attempt to call it.
Viewing gRPC error information on the client
Make sure that the launchSettings.json files in the IotApiGateway and IotDeviceManager projects have different ports specified in the applicationUrl field. Otherwise, one application will prevent the other from running. Once this is done, launch the applications by executing the dotnet run command in each of the project folders.
We can now navigate to the Swagger page of the IotApiGateway application, which will be available at the following address:
{base URL as defined in launchSettings.json file}/swagger
This page will allow us to execute both of our DeviceController endpoints. The first endpoint calls a gRPC method that has been fully implemented, so you will be able to see some data returned. The second endpoint, however, will encounter an error that is being deliberately thrown by the server. If you try to execute the Devices/{id} endpoint, you would expect to see the following error logged in the console of the IotApiGateway application:
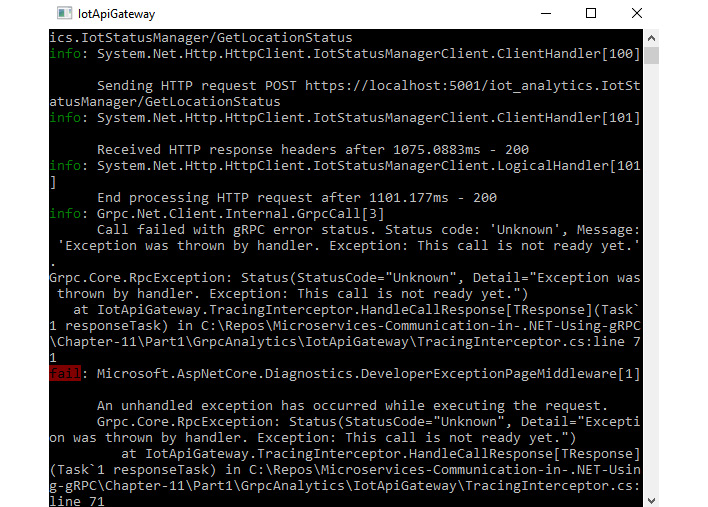
Figure 11.1 – An exception from the gRPC server being logged with full information
We can see the inner message of the exception that we have deliberately thrown. However, if we now stop both of our applications and set the EnableDetailedErrors option on the gRPC server to false, we will see a different outcome in our client console after re-launching the applications. The exception would still be caught and logged, but this time, there will be no original error message present, as this image demonstrates:
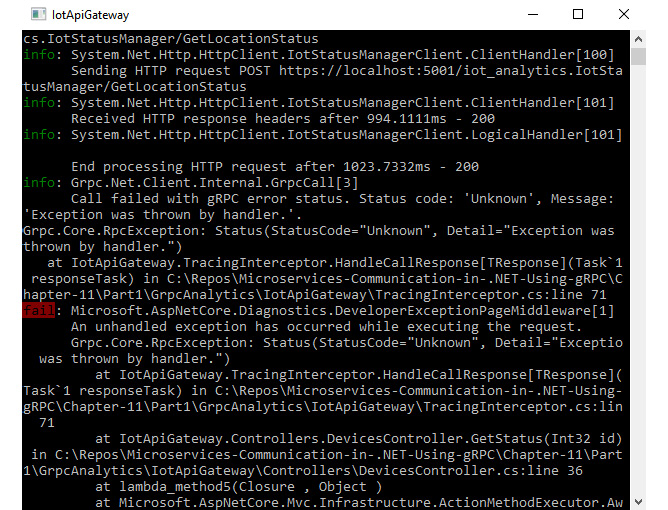
Figure 11.2 – An exception from the gRPC server being logged without the inner error message
In short, if we enable the EnableDetailedErrors option, the error message would be Exception was thrown by handler. This call is not ready yet. But if we disable this option, it would just be Exception was thrown by handler. This is how you can get detailed error information on the development environment while hiding it from the users in production.
But it's not only the client that allows you to use interceptors and extract inner error information from gRPC middleware – you can do this on the server too. And this is what we will do now.
Debugging gRPC server components inside a .NET application
An ASP.NET Core application with gRPC capabilities allows you to get gRPC middleware to output internal debugging information to the application console. It is switched off by default, but we can turn it on by applying a simple change to the application settings.
Likewise, the gRPC server application allows you to use interceptors, just like we did on the client. The server-side interceptor would inherit from the same base class as the client-side one, but it will have different methods defined in it that are only applicable to the server-side events:
- To enable the debug log from the gRPC middleware to be printed in the console, you would need to open the appsettings.json file (and appsettings.Development.json, if you have it) in the IotDeviceManager project folder, locate the LogLevel section, and insert the following entry within it:
"Grpc": "Debug"
- Now, we will add our server-side interceptor. To do this, we will add the ServerTracingInterceptor.cs file to the root of the project and add the following content to it:
using Grpc.Core;
using Grpc.Core.Interceptors;
using System;
using System.Threading.Tasks;
namespace IotDeviceManager
{
public class ServerTracingInterceptor :
Interceptor
{
}
}
- We will then add the call handling methods to it one by one. First, we would add the following handler for a unary call:
public override async Task<TResponse> Unary
ServerHandler<TRequest, TResponse>(TRequest request,
ServerCallContext context, UnaryServerMethod
<TRequest, TResponse> continuation)
{
try
{
return await continuation(request, context);
}
catch (Exception ex)
{
Console.WriteLine(ex);
throw;
}
}
- Then, we will add a handler for a client-streaming call:
public override async Task<TResponse> Client
StreamingServerHandler<TRequest, TResponse>
(IAsyncStreamReader<TRequest> requestStream,
ServerCallContext context, ClientStreaming
ServerMethod<TRequest, TResponse> continuation)
{
try
{
return await continuation(requestStream,
context);
}
catch (Exception ex)
{
Console.WriteLine(ex);
throw;
}
}
- Next, we will apply a handler for a server-streaming call:
public override async Task ServerStreamingServer
Handler<TRequest, TResponse>(TRequest request,
IServerStreamWriter<TResponse> responseStream,
ServerCallContext context, ServerStreaming
ServerMethod<TRequest, TResponse>
continuation)
{
try
{
await continuation(request, responseStream,
context);
}
catch (Exception ex)
{
Console.WriteLine(ex);
throw;
}
}
- And finally, we will add a handler for a bi-directional streaming call:
public override async Task DuplexStreamingServer
Handler<TRequest, TResponse>(IAsyncStreamReader
<TRequest> requestStream, IServerStreamWriter
<TResponse> responseStream, ServerCallContext
context, DuplexStreamingServerMethod
<TRequest, TResponse> continuation)
{
try
{
await continuation(requestStream,
responseStream, context);
}
catch (Exception ex)
{
Console.WriteLine(ex);
throw;
}
}
- We will now need to register our handler. To do this, navigate to either the Startup.cs file (for .NET 5) or the Program.cs file (for .NET 6) and then place the following statement inside of the AddGrpc call:
options.Interceptors.Add<ServerTracingInterceptor>();
- And we will also need to register the interceptor in our dependency injection container by adding the following statement, replacing services with builder.Services if you are on .NET 6:
services.AddSingleton<ServerTracingInterceptor>();
These are all of the changes we wanted to make on the server side. Let's now launch the applications and have a look at the changes in their behavior.
Viewing the debug output on the gRPC server console
Now, if we launch both of our applications and call the working gRPC method from the REST API via the Swagger page, we will be able to see debugging information in our gRPC server console. For example, the following figure demonstrates that each message on the stream is being read individually. Those entries are clearly marked as debug:
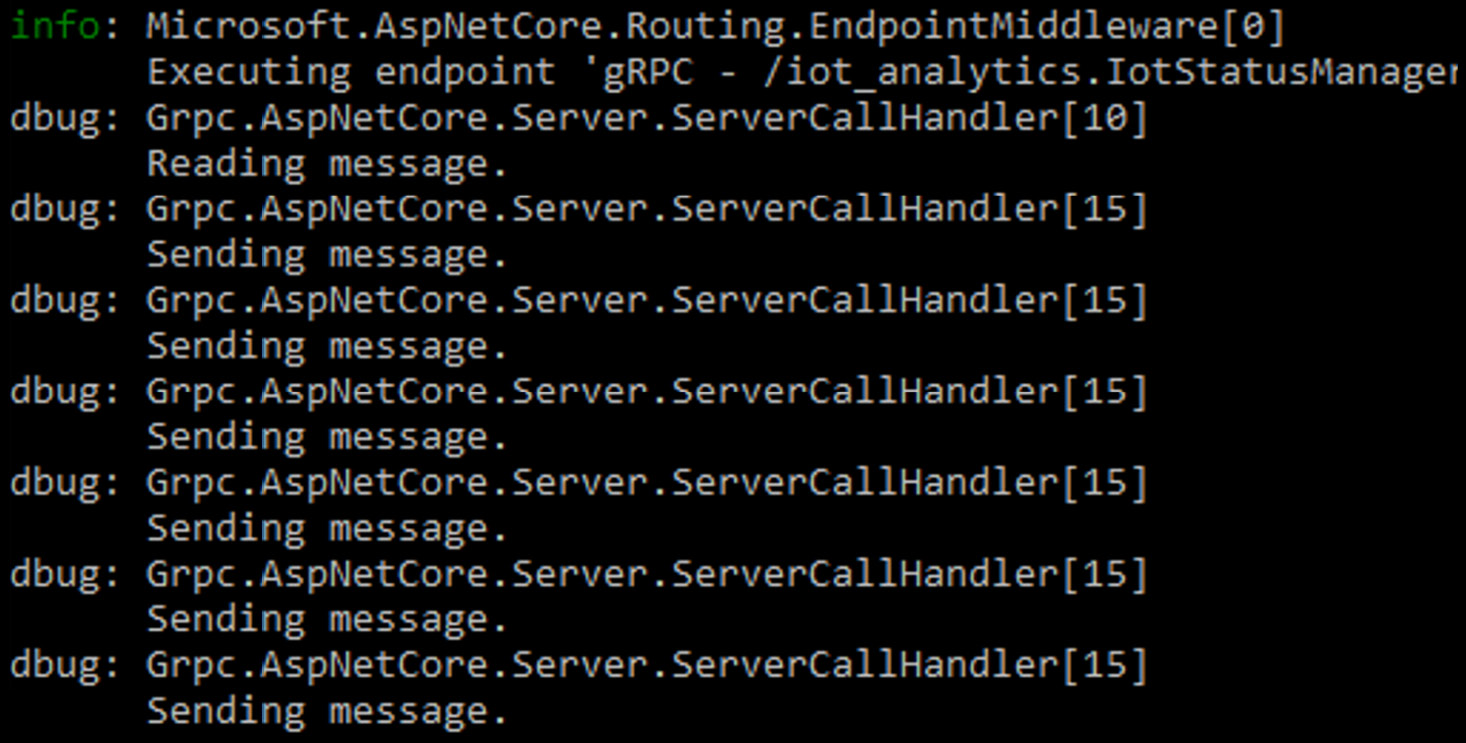
Figure 11.3 – The debug output from gRPC in the server-side log
As for the gRPC call that was deliberately designed to fail, we can see that we have been able to intercept the exception and print it to the console even before the default logger has picked it up, as can be seen in the following figure:
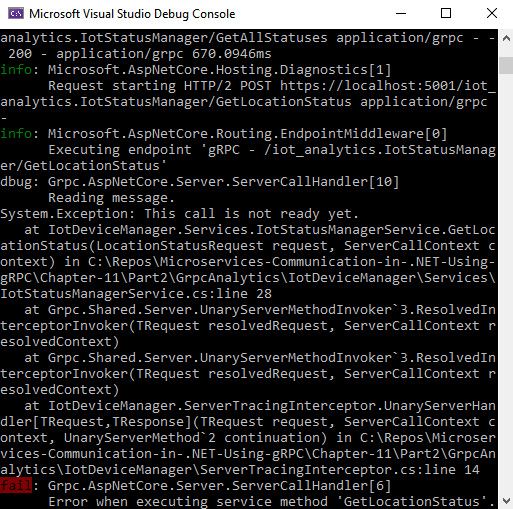
Figure 11.4 – The server-side interceptor intercepting the exception
And this is how you can use interceptors to handle all of your exceptions globally, instead of adding a try/catch block to every individual RPC implementation. If you have a handler for a specific RPC type, any exception that originates in any of the RPCs of that type would be caught in it.
So far, we have been logging our exceptions as plain messages directly in the console. This is acceptable for debugging, but if you want to release an application, you would need to use a proper logger. And this is what we will have a look at next.
Applying logs to gRPC
In software development, logging is a very important concept. Not only will it allow you to identify problems while you are developing your application, but it will also allow you to monitor an application that has been released into production. If anything happens to the application, you would be able to have a look in the logs to see what the application was doing and whether it produced any errors.
There are many different types of logs. You can write the log messages to the console, as we did. You can write them to a file. You can write them to Azure Blob Storage somewhere in the cloud. You can select whichever method suits you best.
In ASP.NET Core applications, it's good practice to use dependency injection for logging, just as you would for other service types. The places in your code that write messages to the log would call relevant methods on the logger interface. And it's up to you to configure what exact implementation of that interface those objects would receive. This is how you can swap loggers of different types depending on the environment. For example, in the development environment, logging to the console may be all you need. But in the production environment, you will need to send your logs where it would be easy to query them.
When you use configurable loggers, it's not only the output type that you can configure but also the log level. You can get the logger to only output messages if they are of a specific severity. We saw this when we configured an inbuilt gRPC logger to output debug messages to the console of the server application. Typically, the severity levels of a logger would be as follows; however, some variations may exist depending on what logger you are using:
- Debug: This is for detailed information on internal functionality that is only useful for debugging purposes.
- Info: This is for information about important events happening inside the application.
- Warning: This means some unexpected behavior was detected but it is not classed as an error.
- Error: This means an error occurred inside the application.
- Critical/Failure: This means a critical error has occurred, which prevented an important functionality from working.
These severity levels are shown from the lowest to the highest. If you set a log severity level in your application, it will log everything from that severity level and above, but it will ignore anything below it. For example, if you set it to Debug, everything will be logged. However, if you set it to Warning, the Debug and Info messages will be ignored. In other words, only the Warning, Error, and Critical messages will be logged.
With a custom logger, you can get gRPC middleware to write to your own log. But with interceptors in place, you can also associate custom log messages with gRPC calls. Now, we will go ahead and demonstrate how logging works both on the client and on the server.
Configuring a logger on the gRPC client
We will now configure a logging provider for the gRPC client application and will replace all console logs with proper logging:
- In the Program.cs file of the IotApiGateway application, add the following block immediately after the call to CreateDefaultBuilder. If you are using a .NET 6 template, there will be no ConfigureLogging method, and the statements inside of it will be added to builder.Logging:
.ConfigureLogging(logging =>
{
logging.ClearProviders();
logging.AddConsole();
})
- We have now added a default console logger to our application. We are still logging into the console, but our output will now be annotated with a color-coded severity level. We will now be able to insert the logger into the places that need it via dependency injection. We will start with the TracingInterceptor class. To enable us to inject the logger, we will add the following using statement to it:
using Microsoft.Extensions.Logging;
- Then, we will replace the class constructor, while also adding the logger as a private readonly field:
private readonly ILogger<TracingInterceptor> logger;
public TracingInterceptor(ILogger<TracingInterceptor>
logger)
{
this.logger = logger;
}
- Next, we will replace the content of the LogException method with the following:
logger.LogError(ex, "gRPC error occured");
- And we will add the following private method to the class:
private void LogException(RpcException ex)
{
logger.LogError(ex, "gRPC error occured");
}
- Then, at the beginning of every call interceptor method, we will call this method like this:
LogCall(context.Method);
- We can also inject our custom logger directly into a gRPC client. I will demonstrate this by creating another standalone instance of the client inside the DevicesController class. First, we will need to add the following using statements to the class:
using Grpc.Net.Client;
using Microsoft.Extensions.Logging;
- Then, we will add the following private readonly field:
private readonly ILoggerFactory loggerFactory;
- Then, we will replace the class controller with the following:
public DevicesController(IotStatusManager.
IotStatusManager Client client, ILoggerFactory
loggerFactory)
{
this.client = client;
this.loggerFactory = loggerFactory;
}
- Next, we will add the following method to use a single-use client. Please note how we are inserting our own logger into the gRPC channel:
[HttpGet("single-use-client")]
public async Task<IEnumerable<LocationStatusResponse>>
GetAllStatusesSingleUseClient()
{
var option = new GrpcChannelOptions
{
LoggerFactory = loggerFactory
};
var channel = GrpcChannel.ForAddress
("https://localhost:5001", option);
var localClient = new IotStatusManager.
IotStatusManagerClient(channel);
var response = new List<LocationStatusResponse>();
using var call = localClient.GetAllStatuses(new
Empty());
while (await call.ResponseStream.MoveNext
(CancellationToken.None))
{
response.Add(call.ResponseStream.Current);
}
return response;
}
- Finally, to actually see the debug output in our console, we need to open the appsetting.Development.json file (or appsettings.json, if you don't have it) and set the Default LogLevel entry to Debug. We can also remove any other entries in that section.
Now, the internal middleware of the gRPC client will log its events into whichever place our logger has been configured to log them to. And we will be able to query those event messages the same way as we can query our own log entries.
Next, we will apply a logger to the server.
Applying a logger on the gRPC server
We will apply the same type of logger on the server as we did on the client. After that, we will look at the console output to see how it's different from what we had before:
- We will first append the following call to the CreateDefaultBuilder call in the Program.cs file. We will need to modify these statements for .NET 6 implementations, as has been described previously:
.ConfigureLogging(logging =>
{
logging.ClearProviders();
logging.AddConsole();
})
- Next, we will open the ServerTracingInterceptor.cs file and add the following using statement to it:
using Microsoft.Extensions.Logging;
- We will then add the following private readonly field and constructor:
private readonly ILogger<ServerTracingInterceptor>
logger;
public ServerTracingInterceptor(Ilogger
<ServerTracingInterceptor> logger)
{
this.logger = logger;
}
- Next, we will replace the content of the LogException method with the following:
logger.LogError(ex, "gRPC error occurred");
- We will then add the following method:
private void LogCall(ServerCallContext context)
{
logger.LogDebug($"gRPC call request:
{context.GetHttpContext().Request.Path}");
}
- And we will also add a call to this method at the beginning of every handler method, like so:
LogCall(context);
- We will now need to open the appsetting.Development.json file (or appsettings.json, if you don't have it) and set the Default LogLevel entry to Debug. We can also remove any other entries in that section.
So, we are now ready to launch our applications and see what kind of output will be produced.
Testing our log output
We will launch both of our applications and the Devices/single-use-client endpoint from the Swagger page in the browser. If you then observe what happens in the console, you will see the full debug output coming from the gRPC client library, along with the custom debug message that we have added, as the following figure demonstrates:

Figure 11.5 – The debug output in the console of the client application
You will see all of the debugging information in the server console too, as can be seen in the following figure:
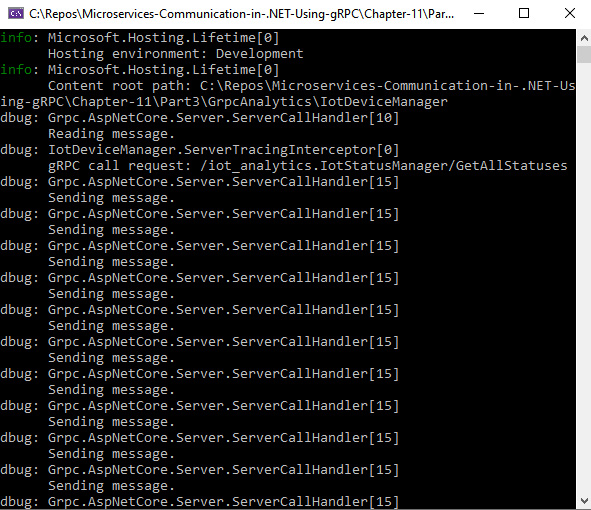
Figure 11.6 – The debug output in the gRPC server console
This logging is very useful to find out the exact point at which interceptor methods are being called. For example, it is apparent from the server console that gRPC reads the incoming message first, and only then calls the interceptor. And, of course, if you set the default log level to something other than Debug in your application's settings, you will not see any of this output in the console.
Now, we will call our Devices/{id} endpoint from the Swagger page to see how the exception is being logged. And, as can be seen in the following figure, our custom log message is now annotated with a color-coded severity level:
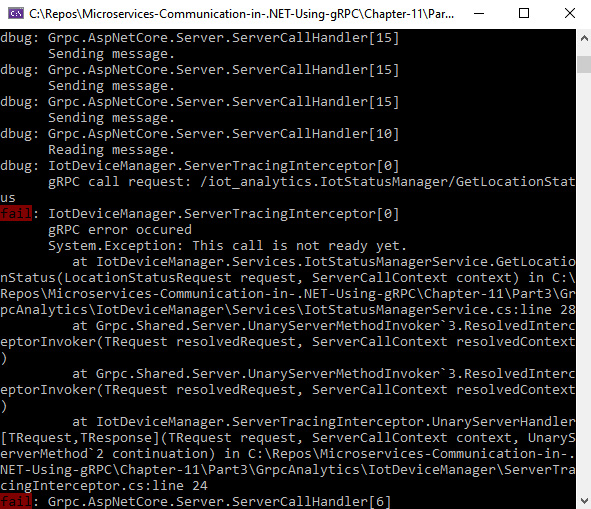
Figure 11.7 – The logged exception, annotated with a color-coded log severity level
This concludes our overview of applying logging to the gRPC functionality in an ASP.NET Core application. But logging individual messages is not the only way you can monitor your applications – you can also apply metrics to them. This is what we will have a look at next.
Applying metrics to gRPC
Metrics are fundamentally different from log messages. Typically, metrics would represent fairly basic measurements, such as counters, durations, and so on. But they can work nicely alongside logging. For example, if you are counting errors, you can see when they occur, and you can then query the logs for this specific period of time. Likewise, if you measure request latency, you can see when it goes above the acceptable threshold. And then you can query the logs produced within the same period to find out exactly what was happening inside your application.
Metrics are typically stored in a time series database, such as Prometheus, InfluxDB, or TimescaleDB. Because metrics represent simple data, they can be easily aggregated and plotted on a time series graph. For example, Grafana software was specifically designed to visualize metrics information. It can plot metrics on graphs similar to that in the following figure:
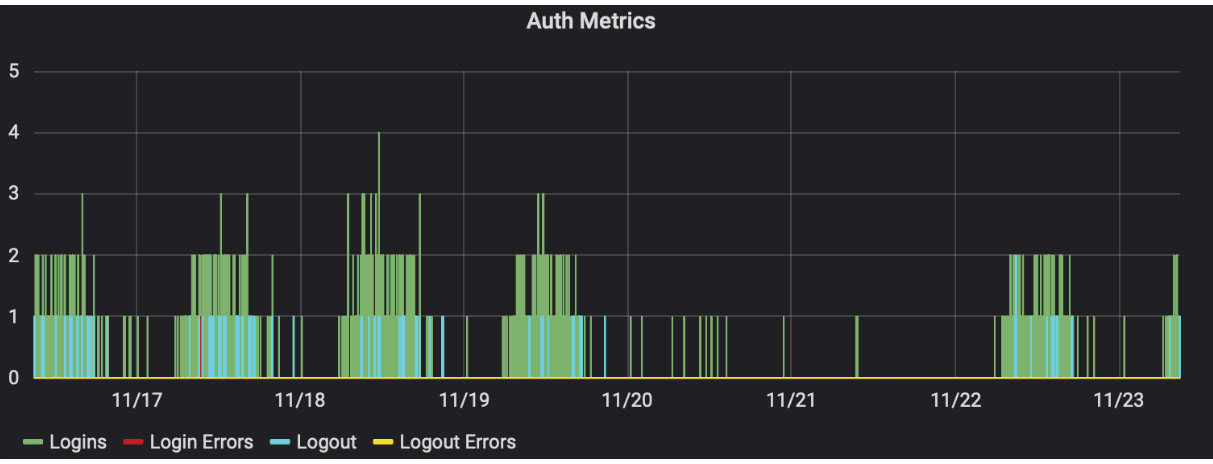
Figure 11.8 – An example of a Grafana metrics graph
There are several different metrics technologies available, but they usually follow either of the following principles:
- Collect the metrics and push them to a database endpoint at set intervals.
- Publish metrics via a URL endpoint and let a third-party probe collect them.
Typically, if you have a URL endpoint, it will be hidden behind a firewall, so only the specific piece of software that collects the metrics will be able to access it. This is done because some of the metric types get reset during every collection.
The metrics types that get reset during every collection include counters. These metrics typically just increment the number of actions within a specific period of time. And in the next cycle, we will only be concerned with how many actions occurred within the current cycle. So, none of the previously incremented values get passed into the next collection cycle. Some examples of counters may include the number of requests, the number of errors, and more.
A gauge is an example of a metric type that doesn't get reset. These metrics get incremented and decremented when various events occur. And we are always interested in their real-time value. A gauge can be used, for example, to indicate how many user sessions are currently active.
In our example, we will generate Prometheus-style metrics that will be collectible via a URL endpoint.
Configuring metrics on the gRPC server
We will need to add some NuGet packages to the class library that is shared between the client and the server. Then, we will need to add some relevant configurations to our gRPC server application:
- First, open the GrpcDependencies project folder and execute the following commands to add the relevant NuGet dependencies:
dotnet add GrpcDependencies.csproj package prometheus-
net.AspNetCore
dotnet add GrpcDependencies.csproj package prometheus-
net.AspNetCore.Grpc
- Next, we will open the Startup.cs file (or the Program.cs file if you are on .NET 6) of the IotDeviceManager project and add this using statement to it:
using Prometheus;
- Next, we will add the following statement immediately after app.UseRouting:
app.UseGrpcMetrics();
This will enable the automatic collection of metrics associated with gRPC.
- Then, we will add the following statement inside the call to app.UseEndpoints:
endpoints.MapMetrics();
This will add the default metrics collection endpoint to our application, which will be accessible via {base URL}/metrics.
With this setup, we are able to collect the default metrics from gRPC. But what if we wanted to apply some custom metrics too? Well, on our client, we will do exactly this.
Enabling metric collection on the gRPC client
On the gRPC client, we will do exactly the same metrics registration that we have done on the server. But this time, we will also apply some custom metrics:
- In the IotApiGateway project, open the Startup.cs file (or Program.cs if you are on .NET 6) and add the following using statement to it:
using Prometheus;
- Then, add the following statement immediately after app.UseRouting:
app.UseGrpcMetrics();
- Next, add the following statement inside the call to app.UseEndpoints:
endpoints.MapMetrics();
- Now, let's open the TracingInterceptor class and add the following using statement on top of it:
using Prometheus;
- Then, add the following private fields to the class:
private static readonly Counter
BlockingUnaryCallsCount = Metrics.
CreateCounter("blocking_unary_calls_count", "Count of
blocking unary calls.");
private static readonly Counter AsyncUnaryCallsCount =
Metrics.CreateCounter("async_unary_calls_count",
"Count of async unary calls.");
private static readonly Counter
ClientStreamingCallsCount = Metrics.
CreateCounter("client_streaming_calls_count", "Count of
client streaming calls.");
private static readonly Counter
ServerStreamingCallsCount = Metrics.
CreateCounter("server_streaming_calls_count", "Count
of server streaming calls.");
private static readonly Counter
DuplexStreamingCallsCount = Metrics.
CreateCounter("duplex_streaming_calls_count", "Count
of bi-directional streaming calls.");
private static readonly Counter FailedGrpcCallsCount =
Metrics.CreateCounter("failed_grpc_calls_count",
"Count of failed gRPC calls.");
private static readonly Histogram GrpcCallDuration =
Metrics.CreateHistogram("grpc_call_duration",
"Durations of gRPC calls.");
- We will then add the following line just before the return statement of every interceptor method. This will measure the duration of the call:
using GrpcCallDuration.NewTimer();
- And now we will increment our counters. First, insert the following line at the beginning of the BlockingUnaryCall method:
BlockingUnaryCallsCount.Inc();
- After this, insert the following line at the beginning of the AsyncUnaryCall method:
AsyncUnaryCallsCount.Inc();
- Then, insert the following line into the AsyncClientStreamingCall method:
ClientStreamingCallsCount.Inc();
- Afterward, insert the following line into the AsyncServerStreamingCall method:
ServerStreamingCallsCount.Inc();
- Finally, insert this line at the beginning of the AsyncDuplexStreamingCall method:
DuplexStreamingCallsCount.Inc();
We have now enabled custom metrics in our gRPC client application. Now, we will launch our applications and see how the metrics get produced.
Viewing gRPC metrics
After launching both applications and triggering a number of gRPC calls via the Swagger page, we can evaluate what metrics get collected by our applications. If you then navigate to the metrics endpoint of the client application, which is accessible via the base URL from the launchConfig.json file followed by the /metrics path, you will see a combination of core metrics produced by the gRPC middleware alongside the custom metrics that we added. This can be seen in the following figure:

Figure 11.9 – The metrics produced by the IotApiGateway application
If you navigate to the metrics endpoint of the IotDeviceManager application, you will see a combination of metrics produced by ASP.NET Core system processes and gRPC middleware, as the following figure demonstrates:

Figure 11.10 – The metrics generated by the IotDeviceManager application
Out of the box, the gRPC middleware generates only the most basic metrics. This is why it makes sense to generate your own to make application monitoring more targeted. The following metrics get produced by the gRPC client library:
- total-calls: Total calls
- current-calls: Current calls
- calls-failed: Total calls failed
- calls-deadline-exceeded: Total calls deadlines exceeded
- messages-sent: Total messages sent
- messages-received: Total messages received
The gRPC server library will generate the same metrics, but there is one additional metric that the server generates:
- calls-unimplemented: Total calls unimplemented
And this concludes the overview of gRPC metrics. Let's now summarize what we have learned in this chapter.
Summary
Congratulations! You have now reached the end of this book.
In this chapter, you have learned how to debug both client and server implementations of gRPC on .NET. You now know how to configure the server to return detailed errors to the client. Likewise, you have learned how to apply interceptors to both the client and the server to enable global error reporting and event logging.
You have also learned how to use loggers in gRPC on .NET. We have covered the fundamentals of configuring logging on ASP.NET Core, and you have learned how to insert these logs both into gRPC interceptors and internal gRPC processes.
We have also gone through the concept of applying metrics to your application. You now know that metrics consist of data that can be easily plotted on time series graphs to help you identify trends, and we explored counters and durations as an example of this.
You have been shown how to extract built-in metrics emitted by gRPC libraries on .NET. Also, we have gone over some examples of how to apply custom metrics where necessary.
We have now concluded this book on using gRPC on .NET to enable effective communication between microservices. We have covered all the fundamental topics of using gRPC on .NET, so you should now be fully equipped to use it in your own solutions. I hope you have enjoyed the journey and found the information in this book useful.
Questions
- How do you get the gRPC server to send detailed error diagnostics to the client?
- You have to add your custom logic to the gRPC service implementation.
- You have to use interceptors.
- You can set the EnableDetailedErrors option on the server.
- You have to throw RpcException.
- How do you enable the middleware of the gRPC service on ASP.NET Core to output debugging information?
- Set the Grpc entry in the logging settings to Debug.
- Attach event listeners to the gRPC assembly.
- Insert a custom logger into the gRPC channel.
- This is not possible.
- What is the easiest way to determine if an error came from the inner gRPC middleware on ASP.NET Core?
- You can do this by looking up special keywords in the exception message.
- You can do this by checking if the exception is of the RpcException type.
- You can do this by checking if the exception is of the HttpException type.
- You can do this by looking up special numeric codes in the exception message.
- How can you pass a shared application logger to the inner middleware of the gRPC client?
- You can do this by adding it to the interceptor.
- You can do this by adding an ILoggerFactory implementation to the GrpcChannel options.
- This is not possible.
- It's only possible when catching exceptions that originated from the inner middleware.
- What is the difference between logs and metrics?
- Metrics provide detailed information, while logs only contain basic messages.
- Metrics consist of data that can be easily aggregated (for example, counters, gauges, histograms, and so on), while logs provide detailed information of each event.
- Metrics represent the metadata behind the log entries.
- Metrics are used strictly for measuring performance, while logs contain detailed event information.
Further reading
- Logging and diagnostics in gRPC on .NET: https://docs.microsoft.com/en-us/aspnet/core/grpc/diagnostics
- Logging in .NET Core and ASP.NET Core: https://docs.microsoft.com/en-us/aspnet/core/fundamentals/logging/
- An overview of Prometheus: https://prometheus.io/docs/introduction/overview/
- The Prometheus-net library documentation: https://github.com/prometheus-net/prometheus-net
- 30 best practices for logging at scale: https://www.loggly.com/blog/30-best-practices-logging-scale/