
Chapter 4: Continuous Integration Pipeline
We already know how to configure Jenkins. In this chapter, we will see how to use it effectively, focusing on the feature that lies at the heart of Jenkins – pipelines. By building a complete continuous integration process from scratch, we will describe all aspects of modern team-oriented code development.
This chapter covers the following topics:
- Introducing pipelines
- The commit pipeline
- Code quality stages
- Triggers and notifications
- Team development strategies
Technical requirements
To complete this chapter, you'll need the following software:
- Jenkins
- Java JDK 8+
All the examples and solutions to the exercises can be found at https://github.com/PacktPublishing/Continuous-Delivery-With-Docker-and-Jenkins-3rd-Edition/tree/main/Chapter04.
Code in Action videos for this chapter can be viewed at https://bit.ly/3r9lbmG.
Introducing pipelines
A pipeline is a sequence of automated operations that usually represents a part of the software delivery and quality assurance process. It can be seen as a chain of scripts that provide the following additional benefits:
- Operation grouping: Operations are grouped together into stages (also known as gates or quality gates) that introduce a structure into a process and clearly define a rule – if one stage fails, no further stages are executed.
- Visibility: All aspects of a process are visualized, which helps in quick failure analysis and promotes team collaboration.
- Feedback: Team members learn about problems as soon as they occur so that they can react quickly.
Information
The concept of pipelining is similar to most continuous integration tools. However, the naming can differ. In this book, we will stick to the Jenkins terminology.
Let's first describe the Jenkins pipeline structure and then how it works in action.
The pipeline structure
A Jenkins pipeline consists of two kinds of elements – a stage and a step. The following diagram shows how they are used:
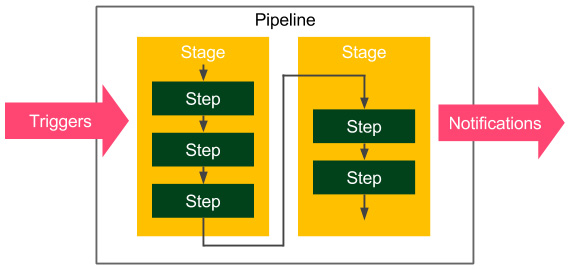
Figure 4.1 – The Jenkins pipeline structure
The following are the basic pipeline elements:
- Step: A single operation that tells Jenkins what to do – for example, check out code from the repository and execute a script
- Stage: A logical separation of steps that groups conceptually distinct sequences of steps – for example, build, test, and deploy, used to visualize the Jenkins pipeline progress
Information
Technically, it's possible to create parallel steps; however, it's better to treat them as an exception that is only used for optimization purposes.
A multi-stage Hello World
As an example, let's extend the Hello World pipeline to contain two stages:
pipeline {
agent any
stages {
stage('First Stage') {
steps {
echo 'Step 1. Hello World'
}
}
stage('Second Stage') {
steps {
echo 'Step 2. Second time Hello'
echo 'Step 3. Third time Hello'
}
}
}
}
The pipeline has no special requirements in terms of environment, and it executes three steps inside two stages. When we click on Build Now, we should see a visual representation:
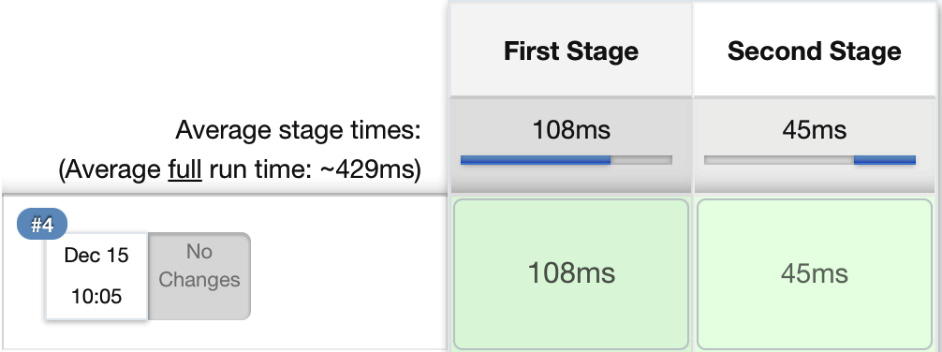
Figure 4.2 – The multi-stage pipeline build
The pipeline succeeded, and we can see the step execution details by clicking on the console. If any of the steps failed, processing would stop, and no further steps would run. Actually, the sole reason for a pipeline is to prevent all further steps from execution and visualize the point of failure.
The pipeline syntax
We've discussed the pipeline elements and already used a few of the pipeline steps – for example, echo. What other operations can we use inside the pipeline definition?
Information
In this book, we use the declarative syntax that is recommended for all new projects. The other options are a Groovy-based DSL and (prior to Jenkins 2) XML (created through the web interface).
The declarative syntax was designed to make it as simple as possible to understand the pipeline, even by people who do not write code on a daily basis. This is why the syntax is limited only to the most important keywords.
Let's try an experiment, but before we describe all the details, please read the following pipeline definition and try to guess what it does:
pipeline {
agent any
triggers { cron('* * * * *') }
options { timeout(time: 5) }
parameters {
booleanParam(name: 'DEBUG_BUILD', defaultValue: true,
description: 'Is it the debug build?')
}
stages {
stage('Example') {
environment { NAME = 'Rafal' }
when { expression { return params.DEBUG_BUILD } }
steps {
echo "Hello from $NAME"
script {
def browsers = ['chrome', 'firefox']
for (int i = 0; i < browsers.size(); ++i) {
echo "Testing the ${browsers[i]} browser."
}
}
}
}
}
post { always { echo 'I will always say Hello again!' } }
}
Hopefully, the pipeline didn't scare you. It is quite complex. Actually, it is so complex that it contains most available Jenkins instructions. To answer the experiment puzzle, let's see what the pipeline does instruction by instruction:
- Uses any available agent
- Executes automatically every minute
- Stops if the execution takes more than 5 minutes
- Asks for the Boolean input parameter before starting
- Sets Rafal as the NAME environment variable
- Does the following, only in the case of the true input parameter:
- Prints Hello from Rafal
- Prints Testing the chrome browser
- Prints Testing the firefox browser
- Prints I will always say Hello again!, regardless of whether there are any errors during the execution
Now, let's describe the most important Jenkins keywords. A declarative pipeline is always specified inside the pipeline block and contains sections, directives, and steps. We will walk through each of them.
Information
The complete pipeline syntax description can be found on the official Jenkins page at https://jenkins.io/doc/book/pipeline/syntax/.
Sections
Sections define the pipeline structure and usually contain one or more directives or steps. They are defined with the following keywords:
- Stages: This defines a series of one or more stage directives.
- Steps: This defines a series of one or more step instructions.
- Post: This defines a series of one or more step instructions that are run at the end of the pipeline build; they are marked with a condition (for example, always, success, or failure) and are usually used to send notifications after the pipeline build (we will cover this in detail in the Triggers and notifications section).
- Agent: This specifies where the execution takes place and can define label to match the equally labeled agents, or docker to specify a container that is dynamically provisioned to provide an environment for the pipeline execution.
Directives
Directives express the configuration of a pipeline or its parts:
- Triggers: This defines automated ways to trigger the pipeline and can use cron to set the time-based scheduling, or pollSCM to check the repository for changes (we will cover this in detail in the Triggers and notifications section).
- Options: This specifies pipeline-specific options – for example, timeout (the maximum time of a pipeline run) or retry (the number of times the pipeline should be rerun after failure).
- Environment: This defines a set of key values used as environment variables during the build.
- Parameters: This defines a list of user-input parameters.
- Stage: This allows for the logical grouping of steps.
- When: This determines whether the stage should be executed, depending on the given condition.
- Tools: This defines the tools to install and put on PATH.
- Input: This allows us to prompt the input parameters.
- Parallel: This allows us to specify stages that are run in parallel.
- Matrix: This allows us to specify combinations of parameters for which the given stages run in parallel.
Steps
Steps are the most fundamental part of the pipeline. They define the operations that are executed, so they actually tell Jenkins what to do:
- sh: This executes the shell command; actually, it's possible to define almost any operation using sh.
- custom: Jenkins offers a lot of operations that can be used as steps (for example, echo); many of them are simply wrappers over the sh command used for convenience. Plugins can also define their own operations.
- script: This executes a block of Groovy-based code that can be used for some non-trivial scenarios where flow control is needed.
Information
The complete specification of the available steps can be found at https://jenkins.io/doc/pipeline/steps/.
Note that the pipeline syntax is very generic and, technically, can be used for almost any automation process. This is why the pipeline should be treated as a method of structuing and visualization. However, the most common use case is to implement the continuous integration server, which we will look at in the following section.
The commit pipeline
The most basic continuous integration process is called a commit pipeline. This classic phase, as its name indicates, starts with commit (or push in Git) to the main repository and results in a report about the build success or failure. Since it runs after each change in the code, the build should take no more than 5 minutes and should consume a reasonable amount of resources. The commit phase is always the starting point of the continuous delivery process and provides the most important feedback cycle in the development process – constant information if the code is in a healthy state.
The commit phase works as follows: a developer checks in the code to the repository, the continuous integration server detects the change, and the build starts. The most fundamental commit pipeline contains three stages:
- Checkout: This stage downloads the source code from the repository.
- Compile: This stage compiles the source code.
- Unit test: This stage runs a suite of unit tests.
Let's create a sample project and see how to implement the commit pipeline.
Information
This is an example of a pipeline for a project that uses technologies such as Git, Java, Gradle, and Spring Boot. Nevertheless, the same principles apply to any other technology.
Checkout
Checking out code from the repository is always the first operation in any pipeline. In order to see this, we need to have a repository. Then, we are able to create a pipeline.
Creating a GitHub repository
Creating a repository on the GitHub server takes just a few steps:
- Go to https://github.com/.
- Create an account if you don't have one yet.
- Click on New, next to Repositories.
- Give it a name – calculator.
- Tick Initialize this repository with a README.
- Click on Create repository.
Now, you should see the address of the repository – for example, https://github.com/leszko/calculator.git.
Creating a checkout stage
We can create a new pipeline called calculator, and as it is a pipeline script, place the code with a stage called Checkout:
pipeline {
agent any
stages {
stage("Checkout") {
steps {
git url: 'https://github.com/leszko/calculator.git', branch: 'main'
}
}
}
}
The pipeline can be executed on any of the agents, and its only step does nothing more than download code from the repository. We can click on Build Now to see whether it was executed successfully.
Information
The Git toolkit needs to be installed on the node where the build is executed.
When we have the checkout, we're ready for the second stage.
Compile
In order to compile a project, we need to do the following:
- Create a project with the source code.
- Push it to the repository.
- Add the Compile stage to the pipeline.
Let's look at these steps in detail.
Creating a Java Spring Boot project
Let's create a very simple Java project using the Spring Boot framework built by Gradle.
Information
Spring Boot is a Java framework that simplifies building enterprise applications. Gradle is a build automation system that is based on the concepts of Apache Maven.
The simplest way to create a Spring Boot project is to perform the following steps:
- Go to http://start.spring.io/.
- Select Gradle Project instead of Maven Project (you can choose Maven if you prefer it to Gradle).
- Fill Group and Artifact (for example, com.leszko and calculator).
- Add Web to Dependencies.
- Click on Generate.
- The generated skeleton project should be downloaded (the calculator.zip file).
The following screenshot shows the http://start.spring.io/ page:
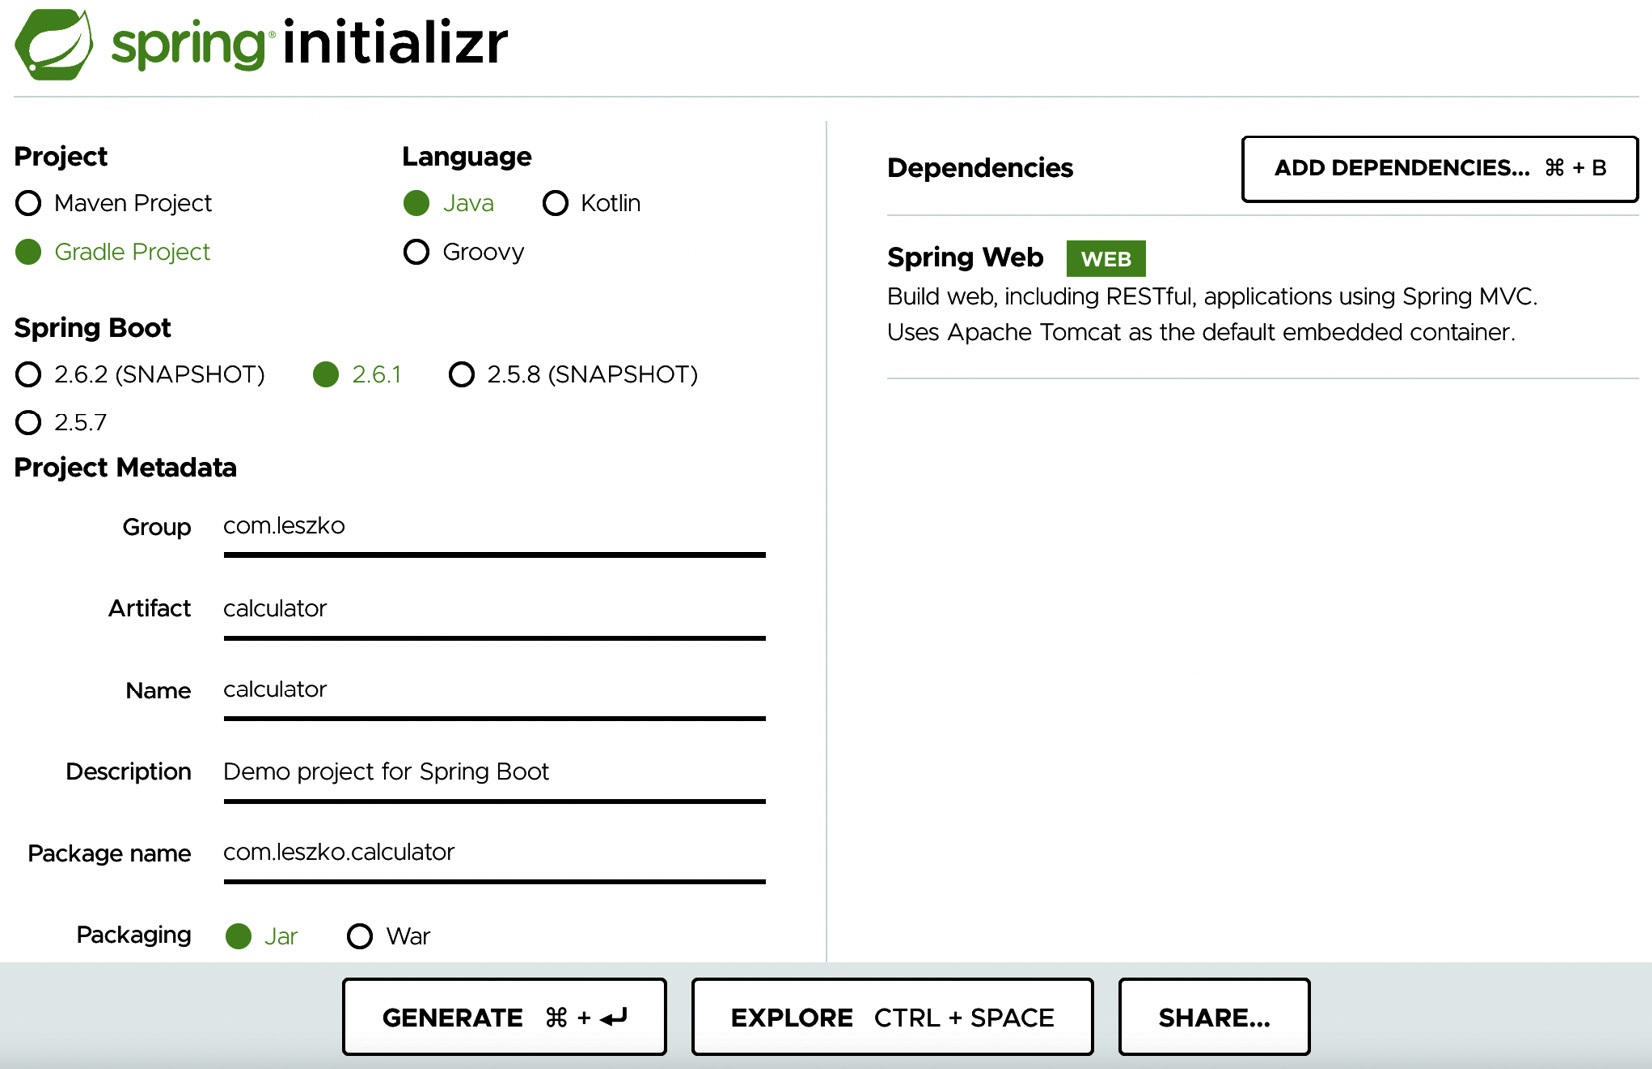
Figure 4.3 – spring initializr
After the project is created, we can push it into the GitHub repository.
Pushing code to GitHub
We will use the Git tool to perform the commit and push operations.
Information
In order to run the git command, you need to have the Git toolkit installed (it can be downloaded from https://git-scm.com/downloads).
Let's first clone the repository to the filesystem:
$ git clone https://github.com/leszko/calculator.git
Extract the project downloaded from http://start.spring.io/ into the directory created by Git.
Tip
If you prefer, you can import the project into IntelliJ, Visual Studio Code, Eclipse, or your favorite IDE tool.
As a result, the calculator directory should have the following files:
$ ls -a
. .. build.gradle .git .gitignore gradle gradlew gradlew.bat HELP.md README.md settings.gradle src
Information
In order to perform the Gradle operations locally, you need to have the Java JDK installed.
We can compile the project locally using the following code:
$ ./gradlew compileJava
In the case of Maven, you can run ./mvnw compile. Both Gradle and Maven compile the Java classes located in the src directory.
Now, we can commit and push to the GitHub repository:
$ git add .
$ git commit -m "Add Spring Boot skeleton"
$ git push -u origin main
The code is already in the GitHub repository. If you want to check it, you can go to the GitHub page and see the files.
Creating a Compile stage
We can add a Compile stage to the pipeline using the following code:
stage("Compile") {
steps {
sh "./gradlew compileJava"
}
}
Note that we used exactly the same command locally and in the Jenkins pipeline, which is a very good sign because the local development process is consistent with the continuous integration environment. After running the build, you should see two green boxes. You can also check that the project was compiled correctly in the console log.
Unit tests
It's time to add the last stage, which is the unit test; it checks whether our code does what we expect it to do. We have to do the following:
- Add the source code for the calculator logic.
- Write a unit test for the code.
- Add a Jenkins stage to execute the unit test.
Let's elaborate more on these steps next.
Creating business logic
The first version of the calculator will be able to add two numbers. Let's add the business logic as a class in the src/main/java/com/leszko/calculator/Calculator.java file:
package com.leszko.calculator;
import org.springframework.stereotype.Service;
@Service
public class Calculator {
public int sum(int a, int b) {
return a + b;
}
}
To execute the business logic, we also need to add the web service controller in a separate file: src/main/java/com/leszko/calculator/CalculatorController.java:
package com.leszko.calculator;
import org.springframework.beans.factory.annotation.Autowired;
import org.springframework.web.bind.annotation.RequestMapping;
import org.springframework.web.bind.annotation.RequestParam;
import org.springframework.web.bind.annotation.RestController;
@RestController
class CalculatorController {
@Autowired
private Calculator calculator;
@RequestMapping("/sum")
String sum(@RequestParam("a") Integer a,
@RequestParam("b") Integer b) {
return String.valueOf(calculator.sum(a, b));
}
}
This class exposes business logic as a web service. We can run the application and see how it works:
$ ./gradlew bootRun
This should start our web service, and we can check that it works by navigating to the browser and opening http://localhost:8080/sum?a=1&b=2. This should sum two numbers (1 and 2) and show 3 in the browser.
Writing a unit test
We already have the working application. How can we ensure that the logic works as expected? We tried it once, but in order to know that it will work consistently, we need a unit test. In our case, it will be trivial, maybe even unnecessary; however, in real projects, unit tests can save you from bugs and system failures.
Let's create a unit test in the src/test/java/com/leszko/calculator/CalculatorTest.java file:
package com.leszko.calculator;
import org.junit.Test;
import static org.junit.Assert.assertEquals;
public class CalculatorTest {
private Calculator calculator = new Calculator();
@Test
public void testSum() {
assertEquals(5, calculator.sum(2, 3));
}
}
Our test uses the JUnit library, so we need to add it as a dependency in the build.gradle file:
dependencies {
...
testImplementation 'junit:junit:4.13'
}
We can run the test locally using the ./gradlew test command. Then, let's commit the code and push it to the repository:
$ git add .
$ git commit -m "Add sum logic, controller and unit test"
$ git push
Creating a Unit test stage
Now, we can add a Unit test stage to the pipeline:
stage("Unit test") {
steps {
sh "./gradlew test"
}
}
Tip
In the case of Maven, use the ./mvnw test command instead.
When we build the pipeline again, we should see three boxes, which means that we've completed the continuous integration pipeline:
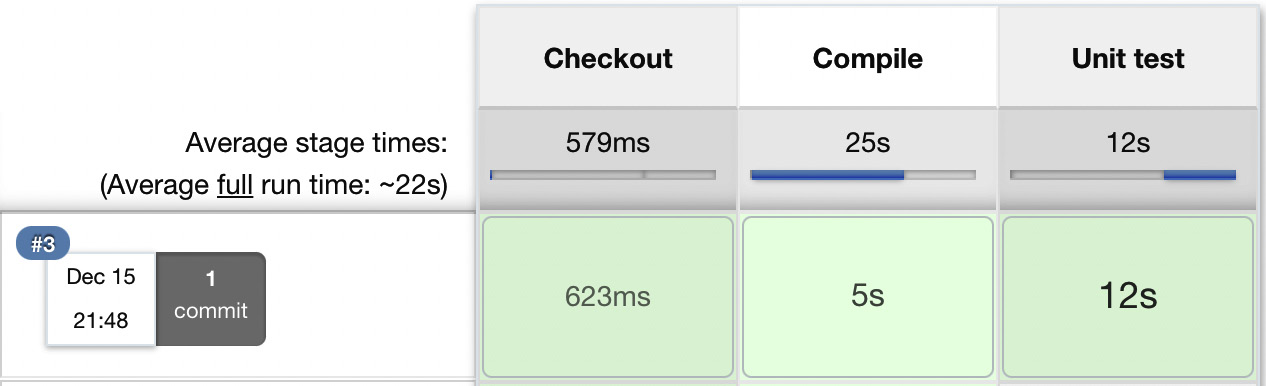
Figure 4.4 – A continuous integration pipeline build
Now that we have our pipeline prepared, let's look at how to achieve exactly the same result using Jenkinsfile.
Jenkinsfile
So far, we've created all the pipeline code directly in Jenkins. This is, however, not the only option. We can also put the pipeline definition inside a file called Jenkinsfile and commit it to the repository, together with the source code. This method is even more consistent because the way your pipeline looks is strictly related to the project itself.
For example, if you don't need the code compilation because your programming language is interpreted (and not compiled), you won't have the Compile stage. The tools you use also differ, depending on the environment. We used Gradle/Maven because we've built a Java project; however, in the case of a project written in Python, you can use PyBuilder. This leads to the idea that the pipelines should be created by the same people who write the code – the developers. Also, the pipeline definition should be put together with the code, in the repository.
This approach brings immediate benefits, as follows:
- In the case of a Jenkins failure, the pipeline definition is not lost (because it's stored in the code repository, not in Jenkins).
- The history of the pipeline changes is stored.
- Pipeline changes go through the standard code development process (for example, they are subjected to code reviews).
- Access to the pipeline changes is restricted in exactly the same way as access to the source code.
Let's see how it all looks in practice by creating a Jenkinsfile file.
Creating the Jenkins file
We can create the Jenkinsfile file and push it into our GitHub repository. Its content is almost the same as the commit pipeline we wrote. The only difference is that the checkout stage becomes redundant because Jenkins has to first check out the code (together with Jenkinsfile) and then read the pipeline structure (from Jenkinsfile). This is why Jenkins needs to know the repository address before it reads Jenkinsfile.
Let's create a file called Jenkinsfile in the root directory of our project:
pipeline {
agent any
stages {
stage("Compile") {
steps {
sh "./gradlew compileJava"
}
}
stage("Unit test") {
steps {
sh "./gradlew test"
}
}
}
}
We can now commit the added files and push them to the GitHub repository:
$ git add Jenkinsfile
$ git commit -m "Add Jenkinsfile"
$ git push
Running the pipeline from Jenkinsfile
When Jenkinsfile is in the repository, all we have to do is to open the pipeline configuration and do the following in the Pipeline section:
- Change Definition from Pipeline script to Pipeline script from SCM.
- Select Git in SCM.
- Put https://github.com/leszko/calculator.git in Repository URL.
- Use */main as Branch Specifier.
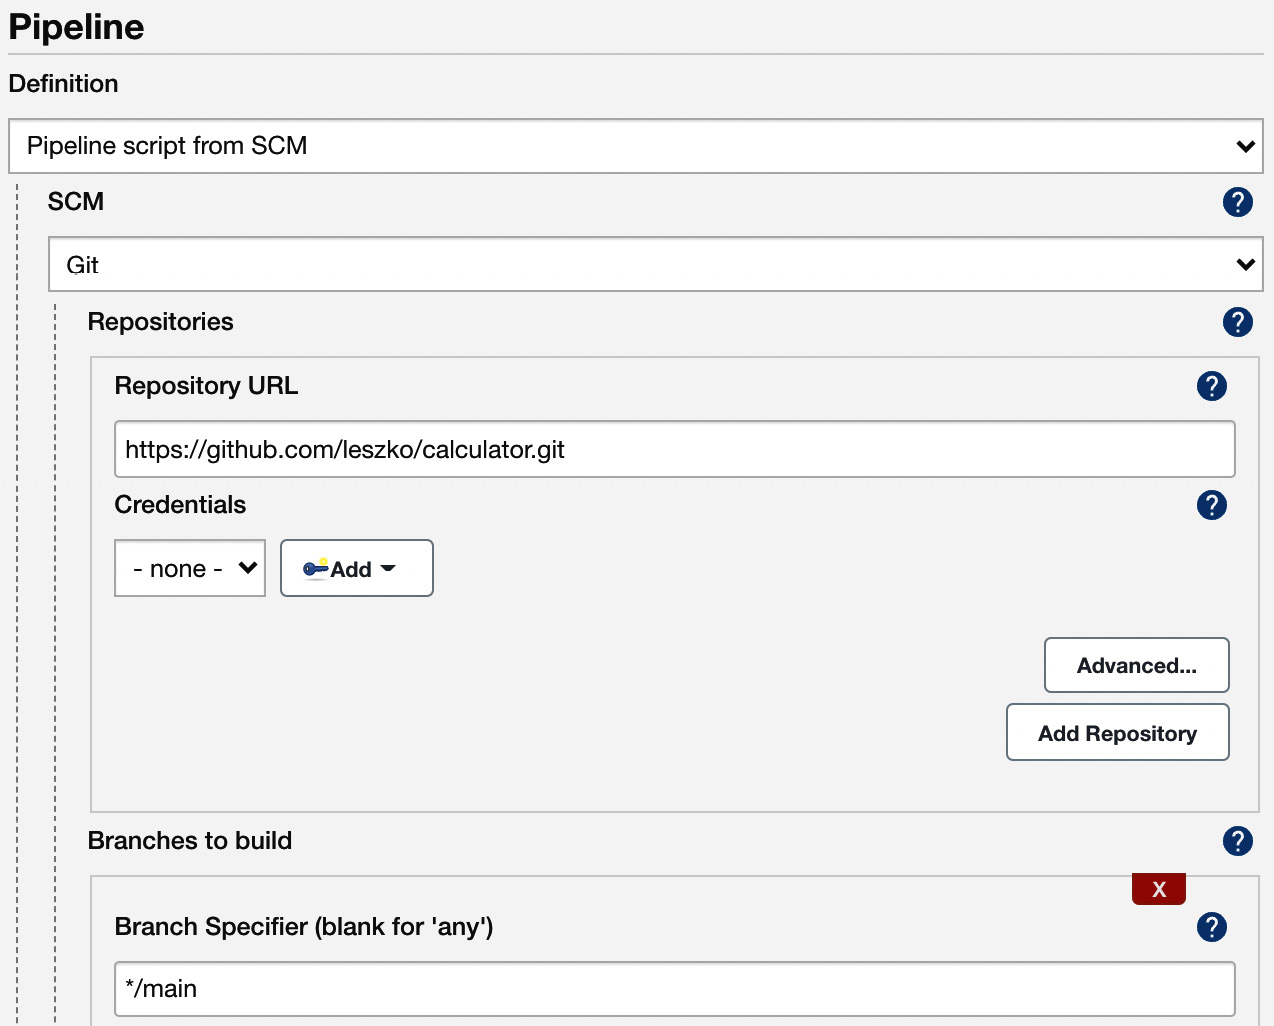
Figure 4.5 – The Jenkinsfile pipeline configuration
After saving, the build will always run from the current version of Jenkinsfile in the repository.
We have successfully created the first complete commit pipeline. It can be treated as a minimum viable product, and actually, in many cases, this suffices as the continuous integration process. In the following sections, we will see what improvements can be done to make the commit pipeline even better.
Code-quality stages
We can extend the three classic steps of continuous integration with additional steps. The most popular are code coverage and static analysis. Let's look at each of them.
Code coverage
Think about the following scenario: you have a well-configured continuous integration process; however, nobody in your project writes unit tests. It passes all the builds, but it doesn't mean that the code is working as expected. What do we do then? How do we ensure that the code is tested?
The solution is to add a code coverage tool that runs all tests and verifies which parts of the code have been executed. Then, it can create a report that shows the untested sections. Moreover, we can make the build fail when there is too much untested code.
There are a lot of tools available to perform the test coverage analysis; for Java, the most popular are JaCoCo, OpenClover, and Cobertura.
Let's use JaCoCo and show how the coverage check works. In order to do this, we need to perform the following steps:
- Add JaCoCo to the Gradle configuration.
- Add the code coverage stage to the pipeline.
- Optionally, publish JaCoCo reports in Jenkins.
Let's look at these steps in detail.
Adding JaCoCo to Gradle
In order to run JaCoCo from Gradle, we need to add the jacoco plugin to the build.gradle file by inserting the following line:
plugins {
...
id 'jacoco'
}
Next, if we want to make Gradle fail in the case of low code coverage, we can add the following configuration to the build.gradle file:
jacocoTestCoverageVerification {
violationRules {
rule {
limit {
minimum = 0.2
}
}
}
}
This configuration sets the minimum code coverage to 20%. We can run it with the following command:
$ ./gradlew test jacocoTestCoverageVerification
This command checks whether the code coverage is at least 20%. You can play with the minimum value to see the level at which the build fails. We can also generate a test coverage report using the following command:
$ ./gradlew test jacocoTestReport
You can check out the full coverage report in the build/reports/jacoco/test/html/index.html file:
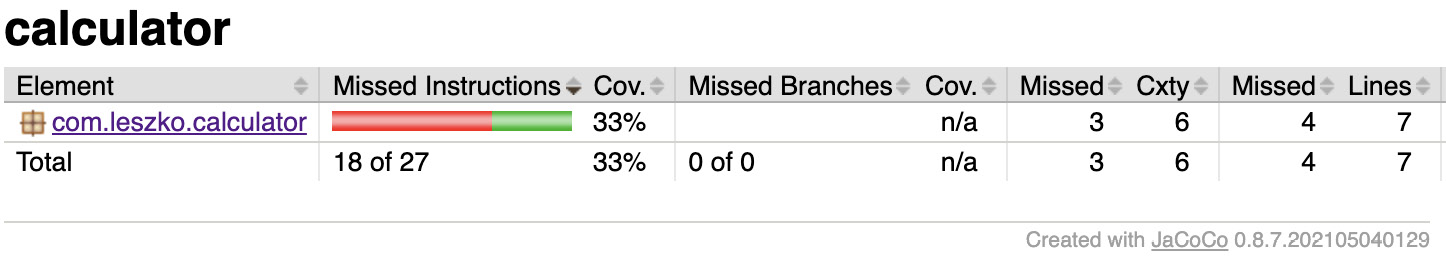
Figure 4.6 – JaCoCo code coverage report
Let's now add the coverage stage in our pipeline.
Adding a code coverage stage
Adding a code coverage stage to the pipeline is as simple as the previous stages:
stage("Code coverage") {
steps {
sh "./gradlew jacocoTestReport"
sh "./gradlew jacocoTestCoverageVerification"
}
}
After adding this stage, if anyone commits code that is not well covered with tests, the build will fail.
Publishing the code coverage report
When coverage is low and the pipeline fails, it is useful to look at the code coverage report and find what parts are not yet covered with tests. We can run Gradle locally and generate the coverage report; however, it is more convenient if Jenkins shows the report for us.
In order to publish the code coverage report in Jenkins, we require the following stage definition:
stage("Code coverage") {
steps {
sh "./gradlew jacocoTestReport"
publishHTML (target: [
reportDir: 'build/reports/jacoco/test/html',
reportFiles: 'index.html',
reportName: "JaCoCo Report"
])
sh "./gradlew jacocoTestCoverageVerification"
}
}
This stage copies the generated JaCoCo report to the Jenkins output. When we run the build again, we should see a link to the code coverage reports (in the menu on the left-hand side, below Build Now).
Information
To perform the publishHTML step, you need to have the HTML Publisher plugin installed in Jenkins. You can read more about the plugin at https://www.jenkins.io/doc/pipeline/steps/htmlpublisher/. Note also that if the report is generated but not displayed properly in Jenkins, you may need to configure Jenkins Security, as described here: https://www.jenkins.io/doc/book/security/configuring-content-security-policy/.
We have created the code coverage stage, which shows the code that is not tested and therefore vulnerable to bugs. Let's see what else can be done in order to improve the code quality.
Tip
If you need code coverage that is stricter, you can check the concept of mutation testing and add the PIT framework stage to the pipeline. Read more at http://pitest.org/.
Static code analysis
Your code coverage may work perfectly fine; however, what about the quality of the code itself? How do we ensure it is maintainable and written in a good style?
Static code analysis is an automatic process of checking code without actually executing it. In most cases, it implies checking a number of rules on the source code. These rules may apply to a wide range of aspects; for example, all public classes need to have a Javadoc comment, the maximum length of a line is 120 characters, or if a class defines the equals() method, it has to define the hashCode() method as well.
The most popular tools to perform static analysis on Java code are Checkstyle, FindBugs, and PMD. Let's look at an example and add the static code analysis stage using Checkstyle. We will do this in three steps:
- Adding the Checkstyle configuration
- Adding the Checkstyle stage
- Optionally, publishing the Checkstyle report in Jenkins
We will walk through each of them.
Adding the Checkstyle configuration
In order to add the Checkstyle configuration, we need to define the rules against which the code is checked. We can do this by specifying the config/checkstyle/checkstyle.xml file:
<?xml version="1.0"?>
<!DOCTYPE module PUBLIC
"-//Puppy Crawl//DTD Check Configuration 1.2//EN"
"http://www.puppycrawl.com/dtds/configuration_1_2.dtd">
<module name="Checker">
<module name="TreeWalker">
<module name="ConstantName" />
</module>
</module>
The configuration contains only one rule – checking whether all Java constants follow the naming convention and consist of uppercase characters only.
Information
The complete Checkstyle description can be found at https://checkstyle.sourceforge.io/config.html.
We also need to add the checkstyle plugin to the build.gradle file:
plugins {
...
id 'checkstyle'
}
Then, we can run checkstyle with the following command:
$ ./gradlew checkstyleMain
In the case of our project, this command should complete successfully because we didn't use any constants so far. However, you can try adding a constant with the wrong name and checking whether the build fails. For example, if you add the following constant to the src/main/java/com/leszko/calculator/CalculatorApplication.java file, checkstyle fails:
@SpringBootApplication
public class CalculatorApplication {
private static final String constant = "constant";
public static void main(String[] args) {
SpringApplication.run(CalculatorApplication.class, args);
}
}
Adding a Static code analysis stage
We can add a Static code analysis stage to the pipeline:
stage("Static code analysis") {
steps {
sh "./gradlew checkstyleMain"
}
}
Now, if anyone commits any code that does not follow the Java constant naming convention, the build will fail.
Publishing static code analysis reports
Very similar to JaCoCo, we can add the Checkstyle report to Jenkins:
publishHTML (target: [
reportDir: 'build/reports/checkstyle/',
reportFiles: 'main.html',
reportName: "Checkstyle Report"
])
This generates a link to the Checkstyle report.
We have now added the static code analysis stage, which can help to find bugs and standardize the code style inside a team or organization.
Let's see one more option we have when it comes to implementing code analysis.
SonarQube
SonarQube is the most widespread source code quality management tool. It supports multiple programming languages and can be treated as an alternative to the code coverage and static code analysis steps we looked at. Actually, it is a separate server that aggregates different code analysis frameworks, such as Checkstyle, FindBugs, and JaCoCo. It has its own dashboards and integrates well with Jenkins.
Instead of adding code quality steps to the pipeline, we can install SonarQube, add plugins there, and add a sonar stage to the pipeline. The advantage of this solution is that SonarQube provides a user-friendly web interface to configure rules and show code vulnerabilities.
Information
You can read more about SonarQube on its official page at https://www.sonarqube.org/.
Now that we have covered the code quality stages, let's focus on triggers and notifications.
Triggers and notifications
So far, we have always built the pipeline manually by clicking on the Build Now button. It works completely fine but may not be very convenient in practice. All team members would have to remember that after committing to the repository, they need to open Jenkins and start the build. The same applies to pipeline monitoring; so far, we have manually opened Jenkins and checked the build status. In this section, we will see how to improve the process so that the pipeline will start automatically and, when completed, notify team members regarding its status.
Triggers
An automatic action to start the build is called the pipeline trigger. In Jenkins, there are many options to choose from; however, they all boil down to three types:
- External
- Polling Source Control Management (SCM)
- A scheduled build
Let's take a look at each of them.
External
External triggers are easy to understand. They mean that Jenkins starts the build after it's called by the notifier, which can be the other pipeline build, the SCM system (for example, GitHub), or any remote script.
The following diagram presents the communication:

Figure 4.7 – An external trigger
GitHub triggers Jenkins after a push to the repository and the build is started.
To configure the system this way, we need the following setup steps:
- Install the GitHub plugin in Jenkins.
- Generate a secret key for Jenkins.
- Set the GitHub webhook and specify the Jenkins address and key.
In the case of the most popular SCM providers, dedicated Jenkins plugins are always provided.
There is also a more generic way to trigger Jenkins via the REST call to the <jenkins_url>/job/<job_name>/build?token=<token> endpoint. For security reasons, it requires setting token in Jenkins and then using it in the remote script.
Information
Jenkins must be accessible from the SCM server. In other words, if we use the public GitHub repository to trigger Jenkins, our Jenkins server must be public as well. This also applies to the REST call solution, in which case, the <jenkins_url> address must be accessible from the script that triggers it.
Polling SCM
Polling the SCM trigger is a little less intuitive. The following diagram presents the communication:

Figure 4.8 – Polling the SCM trigger
Jenkins periodically calls GitHub and checks whether there was any push to the repository. Then, it starts the build. It may sound counter-intuitive, but there are at least two good cases for using this method:
- Jenkins is inside the firewalled network (which GitHub does not have access to).
- Commits are frequent and the build takes a long time, so executing a build after every commit would cause an overload.
The configuration of pollSCM is also somehow simpler because the way to connect from Jenkins to GitHub is already set up (Jenkins checks out the code from GitHub, so it knows how to access it). In the case of our calculator project, we can set up an automatic trigger by adding the triggers declaration (just after agent) to the pipeline:
triggers {
pollSCM('* * * * *')
}
After running the pipeline manually for the first time, the automatic trigger is set. Then, it checks GitHub every minute, and for new commits, it starts a build. To test that it works as expected, you can commit and push anything to the GitHub repository and see that the build starts.
We used the mysterious * * * * * as an argument to pollSCM. It specifies how often Jenkins should check for new source changes and is expressed in the cron-style string format.
Information
The cron string format is described (together with the cron tool) at https://en.wikipedia.org/wiki/Cron.
Scheduled builds
The scheduled trigger means that Jenkins runs the build periodically, regardless of whether there were any commits to the repository.
As the following screenshot shows, no communication with any system is required:

Figure 4.9 – The scheduled build trigger
The implementation of Scheduled build is exactly the same as polling SCM. The only difference is that the cron keyword is used instead of pollSCM. This trigger method is rarely used for the commit pipeline but applies well to nightly builds (for example, complex integration testing executed at night).
Notifications
Jenkins provides a lot of ways to announce its build status. What's more, as with everything in Jenkins, new notification types can be added using plugins.
Let's walk through the most popular types so that you can choose the one that fits your needs.
The most classic way to notify users about the Jenkins build status is to send emails. The advantage of this solution is that everybody has a mailbox, everybody knows how to use it, and everybody is used to receiving information in it. The drawback is that, usually, there are simply too many emails, and the ones from Jenkins quickly become filtered out and never read.
The configuration of the email notification is very simple:
- Have the SMTP (Simple Mail Transfer Protocol) server configured.
- Set its details in Jenkins (in Manage Jenkins | Configure System).
- Use the mail to instruction in the pipeline.
The pipeline configuration can be as follows:
post {
always {
mail to: '[email protected]',
subject: "Completed Pipeline: ${currentBuild.fullDisplayName}",
body: "Your build completed, please check: ${env.BUILD_URL}"
}
}
Note that all notifications are usually called in the post section of the pipeline, which is executed after all steps, no matter whether the build succeeded or failed. We used the always keyword; however, there are different options:
- always: Execute regardless of the completion status.
- changed: Execute only if the pipeline changed its status.
- fixed: Execute only if the pipeline changed its status from failed to success.
- regression: Execute only if the pipeline changed its status from success to failed, unstable, or aborted.
- aborted: Execute only if the pipeline was manually aborted.
- failure: Execute only if the pipeline has the failed status.
- success: Execute only if the pipeline has the success status.
- unstable: Execute only if the pipeline has the unstable status (usually caused by test failures or code violations).
- unsuccessful: Execute only if the pipeline has any status other than success.
Group chats
If a group chat (for example, Slack) is the first method of communication in your team, it's worth considering adding the automatic build notifications there. No matter which tool you use, the procedure to configure it is always the same:
- Find and install the plugin for your group chat tool (for example, the Slack Notification plugin).
- Configure the plugin (the server URL, channel, authorization token, and so on).
- Add the sending instruction to the pipeline.
Let's see a sample pipeline configuration for Slack to send notifications after the build fails:
post {
failure {
slackSend channel: '#dragons-team',
color: 'danger',
message: "The pipeline ${currentBuild.fullDisplayName} failed."
}
}
Team spaces
Together with the agile culture came the idea that it's better to have everything happening in a team space. Instead of writing emails, meet together; instead of online messaging, come and talk; instead of task tracking tools, have a whiteboard. The same idea came to continuous delivery and Jenkins. Currently, it's very common to install big screens (also called build radiators) in the team space. Then, when you come to the office, the first thing you see is the current status of the pipeline. Build radiators are considered one of the most effective notification strategies. They ensure that everyone is aware of failing builds and, as a beneficial side effect, they boost team spirit and favor in-person communication.
Since developers are creative beings, they invented a lot of other ideas that play the same role as the radiators. Some teams hang large speakers that beep when the pipeline fails. Others have toys that blink when the build is done. One of my favorites is Pipeline State UFO, which is provided as an open source project on GitHub. On its page, you can find a description of how to print and configure a UFO that hangs off the ceiling and signals the pipeline state. You can find more information at https://github.com/Dynatrace/ufo.
Information
Since Jenkins is extensible by plugins, its community wrote a lot of different ways to inform users about the build statuses. Among them, you can find RSS feeds, SMS notifications, mobile applications, and desktop notifiers.
Now that we have covered triggers and notifications, let's focus on one more important aspect – team development strategies.
Team development strategies
We have covered everything regarding how the continuous integration pipeline should look. However, when exactly should it be run? Of course, it is triggered after the commit to the repository, but after the commit to which branch? Only to the trunk or to every branch? Or, maybe it should run before, not after, committing so that the repository will always be healthy? Or, how about the crazy idea of having no branches at all?
There is no single best answer to these questions. Actually, the way you use the continuous integration process depends on your team development workflow. So, before we go any further, let's describe the possible workflows.
Development workflows
A development workflow is the way your team puts code into the repository. It depends, of course, on many factors, such as the SCM tool, the project specifics, and the team size.
As a result, each team develops the code in a slightly different manner. We can, however, classify them into three types: a trunk-based workflow, a branching workflow, and a forking workflow.
Information
All workflows are described in detail, with examples, at https://www.atlassian.com/git/tutorials/comparing-workflows.
The trunk-based workflow
The trunk-based workflow is the simplest possible strategy. It is presented in the following diagram:

Figure 4.10 – The trunk-based workflow
There is one central repository with a single entry for all changes to the project, which is called the trunk or master. Every member of the team clones the central repository to have their own local copies. The changes are committed directly to the central repository.
The branching workflow
The branching workflow, as its name suggests, means that the code is kept in many different branches. The idea is presented in the following diagram:
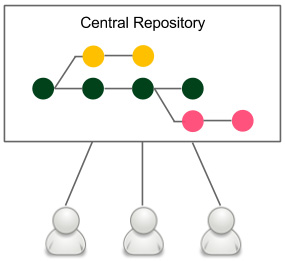
Figure 4.11 – The branching workflow
When developers start to work on a new feature, they create a dedicated branch from the trunk and commit all feature-related changes there. This makes it easy for multiple developers to work on a feature without breaking the main code base. This is why, in the case of the branching workflow, there is no problem in keeping the master healthy. When the feature is completed, a developer rebases the feature branch from the master and creates a pull request that contains all feature-related code changes. It opens the code review discussions and makes space to check whether the changes disturb the master. When the code is accepted by other developers and automatic system checks, it is merged into the main code base. The build is run again on the master but should almost never fail, since it didn't fail on the branch.
The forking workflow
The forking workflow is very popular among open source communities. It is presented in the following diagram:
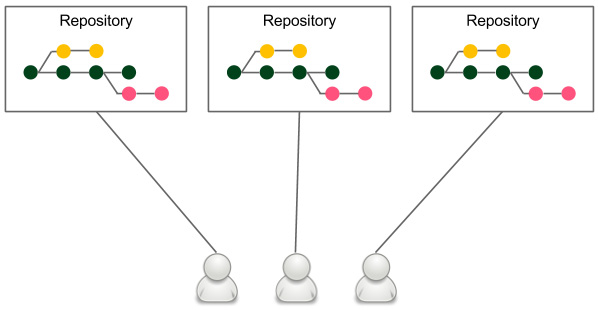
Figure 4.12 – The forking workflow
Each developer has their own server-side repository. It may or may not be the official repository, but technically, each repository is exactly the same.
Forking means literally creating a new repository from another repository. Developers push to their own repositories, and when they want to integrate code, they create a pull request to the other repository.
The main advantage of the forking workflow is that the integration is not necessarily via a central repository. It also helps with ownership because it allows the acceptance of pull requests from others without giving them write access.
In the case of requirement-oriented commercial projects, a team usually works on one product and therefore has a central repository, so this model boils down to having a branching workflow with good ownership assignment; for example, only project leads can merge pull requests into the central repository.
Adopting continuous integration
We have described different development workflows, but how do they influence the continuous integration configuration?
Branching strategies
Each development workflow implies a different continuous integration approach:
- Trunk-based workflow: This implies constantly struggling against the broken pipeline. If everyone commits to the main code base, the pipeline often fails. In this case, the old continuous integration rule says, If the build is broken, the development team stops whatever they are doing and fixes the problem immediately.
- Branching workflow: This solves the broken trunk issue but introduces another one: if everyone develops in their own branches, where is the integration? A feature usually takes weeks or months to develop, and for all this time, the branch is not integrated into the main code. Therefore, it cannot really be called continuous integration – not to mention that there is a constant need for merging and resolving conflicts.
- Forking workflow: This implies managing the continuous integration process by every repository owner, which isn't usually a problem. It does share, however, the same issues as the branching workflow.
There is no silver bullet, and different organizations choose different strategies. The solution that is the closest to perfection uses the technique of the branching workflow and the philosophy of the trunk-based workflow. In other words, we can create very small branches and integrate them frequently into the master. This seems to take the best aspects of both. However, it requires either having tiny features or using feature toggles. Since the concept of feature toggles fits very well into continuous integration and continuous delivery, let's take a moment to explore it.
Feature toggles
Feature toggles is a technique that is an alternative to maintaining multiple source code branches, such that the feature can be tested before it is completed and ready for release. It is used to disable the feature for users but enable it for developers while testing. Feature toggles are essentially variables used in conditional statements.
The simplest implementation of feature toggles are flags and the if statements. A development using feature toggles, as opposed to a feature branching development, appears as follows:
- A new feature has to be implemented.
- Create a new flag or a configuration property – feature_toggle (instead of the feature branch).
- All feature-related code is added inside the if statement (instead of committing to the feature branch), such as the following:
if (feature_toggle) {
// do something
}
- During the feature development, the following takes place:
- Coding is done in the master with feature_toggle = true (instead of coding in the feature branch).
- The release is done from the master with feature_toggle = false.
- When the feature development is completed, all if statements are removed and feature_toggle is removed from the configuration (instead of merging feature to the master and removing the feature branch).
The benefit of feature toggles is that all development is done in the trunk, which facilitates real continuous integration and mitigates problems with merging the code.
Jenkins multi-branch
If you decide to use branches in any form, either the long-feature branches or the recommended short-lived branches, it is convenient to know that the code is healthy before merging it into the master. This approach results in always keeping the main code base green, and luckily, there is an easy way to do it with Jenkins.
In order to use multi-branch in our calculator project, let's proceed with the following steps:
- Open the main Jenkins page.
- Click on New Item.
- Enter calculator-branches as the item name, select Multibranch Pipeline, and click on OK.
- In the Branch Sources section, click on Add source, and select Git.
- Enter the repository address in the Project Repository field:
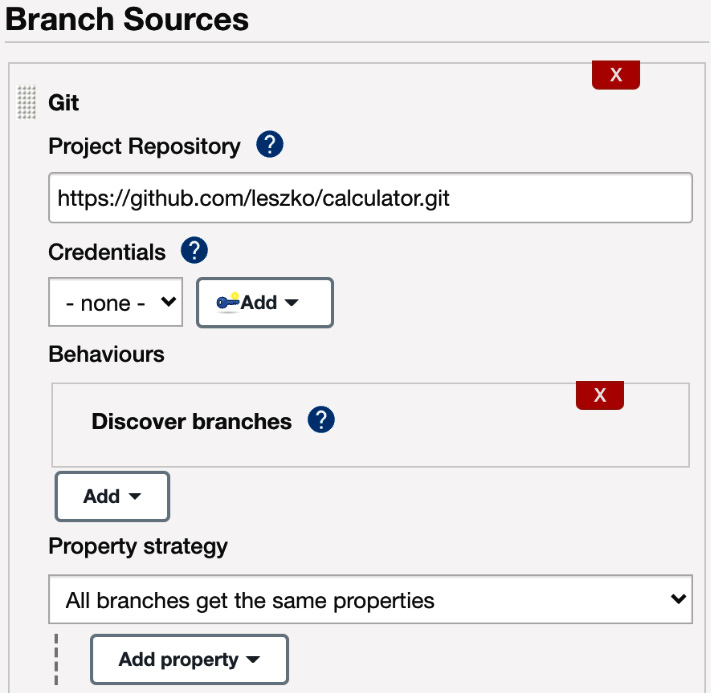
Figure 4.13 – The multi-branch pipeline configuration
- Tick Periodically if not otherwise run and set 1 minute as the interval.
- Click on Save.
Every minute, this configuration checks whether there were any branches added (or removed) and creates (or deletes) the dedicated pipeline defined by Jenkinsfile.
We can create a new branch and see how it works. Let's create a new branch called feature and push it into the repository:
$ git checkout -b feature
$ git push origin feature
After a moment, you should see a new branch pipeline automatically created and run:
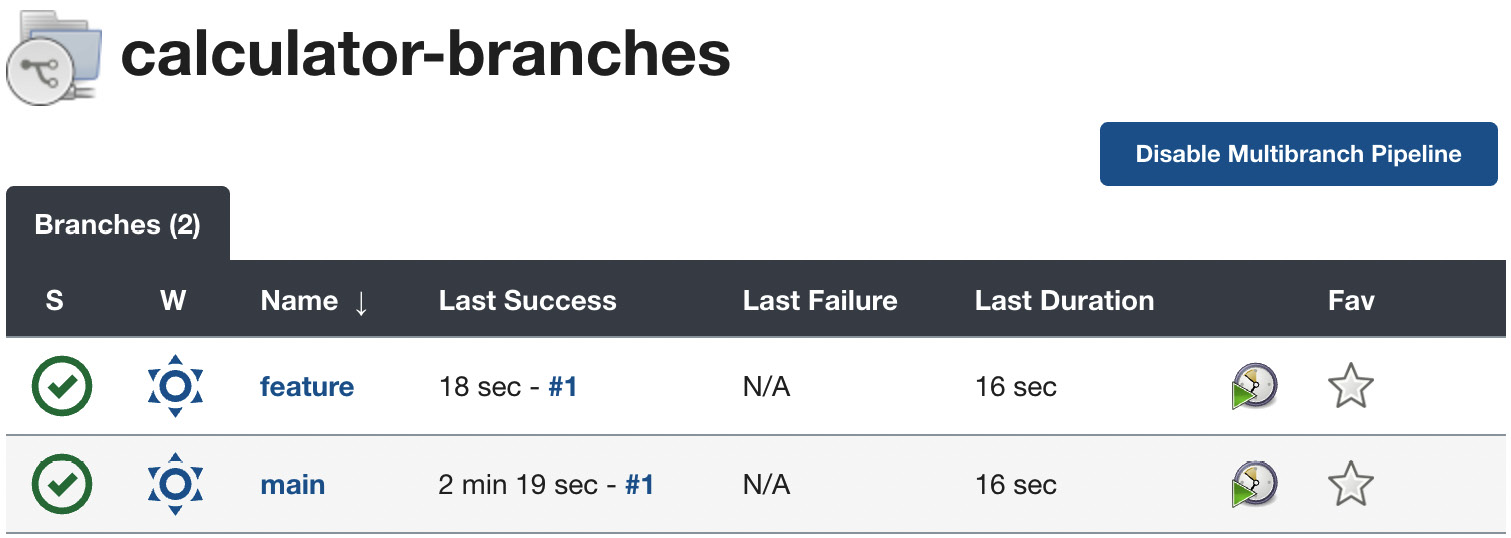
Figure 4.14 – The multi-branch pipeline build
Now, before merging the feature branch to the master, we can check whether it's green. This approach should never break the master build.
A very similar approach is to build a pipeline per pull request instead of a pipeline per branch, which gives the same result – the main code base is always healthy.
Non-technical requirements
Last but not least, continuous integration is not all about technology. On the contrary, technology comes second. James Shore, in his Continuous Integration on a Dollar a Day article, described how to set up the continuous integration process without any additional software. All he used was a rubber chicken and a bell. The idea is to make the team work in one room and set up a separate computer with an empty chair. Put the rubber chicken and the bell in front of that computer. Now, when you plan to check in the code, take the rubber chicken, check in the code, go to the empty computer, check out the fresh code, run all tests there, and if everything passes, put back the rubber chicken, and ring the bell so that everyone knows that something has been added to the repository.
Information
Continuous Integration on a Dollar a Day by James Shore can be found at http://www.jamesshore.com/v2/blog/2006/continuous-integration-on-a-dollar-a-day.
The idea is a little oversimplified, and automated tools are useful; however, the main message is that without each team member's engagement, even the best tools won't help. In his book, Jez Humble outlines the prerequisites for continuous integration:
- Check in regularly: To quote Mike Roberts, continuously is more often than you think; the minimum is once a day.
- Create comprehensive unit tests: It's not only about high test coverage; it's possible to have no assertions and still keep 100% coverage.
- Keep the process quick: Continuous integration must take a short time, preferably under 5 minutes. 10 minutes is already a lot.
- Monitor the builds: This can be a shared responsibility, or you can adapt the build master role that rotates weekly.
Summary
In this chapter, we covered all aspects of the continuous integration pipeline, which is always the first step for continuous delivery. Here are the key takeaways:
- The pipeline provides a general mechanism for organizing any automation processes; however, the most common use cases are continuous integration and continuous delivery.
- Jenkins accepts different ways of defining pipelines, but the recommended one is the declarative syntax.
- The commit pipeline is the most basic continuous integration process, and as its name suggests, it should be run after every commit to the repository.
- The pipeline definition should be stored in the repository as a Jenkinsfile file.
- The commit pipeline can be extended with the code quality stages.
- No matter what the project build tool, Jenkins commands should always be consistent with local development commands.
- Jenkins offers a wide range of triggers and notifications.
- The development workflow should be carefully chosen inside a team or organization because it affects the continuous integration process and defines the way code is developed.
In the next chapter, we will focus on the next phase of the continuous delivery process – automated acceptance testing. This can be considered the most important and, in many cases, the most difficult step to implement. We will explore the idea of acceptance testing and a sample implementation using Docker.
Exercises
You've learned a lot about how to configure the continuous integration process. Since practice makes perfect, I recommend doing the following exercises:
- Create a Python program that multiplies two numbers passed as command-line parameters. Add unit tests and publish the project on GitHub:
- Create two files: calculator.py and test_calculator.py.
- You can use the unittest library at https://docs.python.org/3/library/unittest.html.
- Run the program and the unit test.
- Build the continuous integration pipeline for the Python calculator project:
- Use Jenkinsfile to specify the pipeline.
- Configure the trigger so that the pipeline runs automatically in case of any commits to the repository.
- The pipeline doesn't need the Compile step since Python is an interpretable language.
- Run the pipeline and observe the results.
- Try to commit the code that breaks the pipeline build and observe how it is visualized in Jenkins.
Questions
To verify the knowledge acquired from this chapter, please answer the following questions:
- What is a pipeline?
- What is the difference between a stage and a step in the pipeline?
- What is the post section in the Jenkins pipeline?
- What are the three most fundamental stages of the commit pipeline?
- What is Jenkinsfile?
- What is the purpose of the code coverage stage?
- What is the difference between the following Jenkins triggers – external and polling SCM?
- What are the most common Jenkins notification methods? Name at least three.
- What are the three most common development workflows?
- What is a feature toggle?
Further reading
To read more about the continuous integration topic, please refer to the following resources:
- Continuous Delivery, Jez Humble and David Farley: https://continuousdelivery.com/
- Continuous Integration: Improving Software Quality and Reducing Risk, Andrew Glover, Steve Matyas, and Paul M. Duvall: https://www.oreilly.com/library/view/continuous-integration-improving/9780321336385/