
Chapter 10: AIOps with Amazon DevOps Guru and Systems Manager OpsCenter
This chapter will introduce you to the concepts of artificial intelligence (AI) and machine learning (ML). We will also learn about AIOps, why we need it, and how it is applied to IT operations. We will cover some of the areas where AIOps can be helpful. We will learn about the AWS DevOps Guru AIOps tool and implement two use cases. We will deploy a serverless application and inject some failure, and then analyze the insights and remediation provided by Amazon DevOps Guru. Then, another use case will be covered about identifying anomalies in CPU, memory, and networking within an Elastic Container Service for Kubernetes (EKS) cluster.
This chapter contains the following main sections:
- AIOps and how it helps in IT operations
- AIOps using Amazon DevOps Guru
- Enabling DevOps Guru on EKS cluster resources
- Injecting failure and then reviewing the insights
- Deploying a serverless application and enabling DevOps Guru
- Integrating DevOps Guru with Systems Manager OpsCenter
- Injecting failure and then reviewing the insights
Technical requirements
To implement the solutions mentioned in this chapter, you will need an AWS account with DevOps Guru enabled.
The github repo for this chapter can be found here:
https://github.com/PacktPublishing/Accelerating-DevSecOps-on-AWS/tree/main/chapter-10
AIOps and how it helps in IT operations
AI is a hot topic everywhere and, unlike previously, lots of people now really understand the meaning of AI and how it is applied in real-life scenarios or use cases. Before jumping right to AIOps, we first need to set the context by understanding AI and ML.
AI is the broadest term and has been around for decades as a research topic. AI allows a computer to perform any task that normally requires human intelligence. ML is a subset of AI that solves specific tasks by learning from patterns and data and making predictions without explicitly being programmed. This phrase of explicitly being programmed is the key factor that translates some huge opportunities to transform how we do IT operations today. ML is one approach to AI, recently popular due to big data and cheap compute through cloud computing. Broadly, there are two types of ML algorithms:
- Supervised learning algorithms take the raw data that you are inputting, and they also have a set of training labels or examples that provide the algorithm with an illustration of how you correctly interpret that data and create correct outputs.
- Unsupervised learning algorithms take only the raw data and analyze and cluster the unlabeled datasets. These algorithms find hidden patterns or data grouping without human intervention. Most of the time in IT operations, we generally have data that is not labeled.
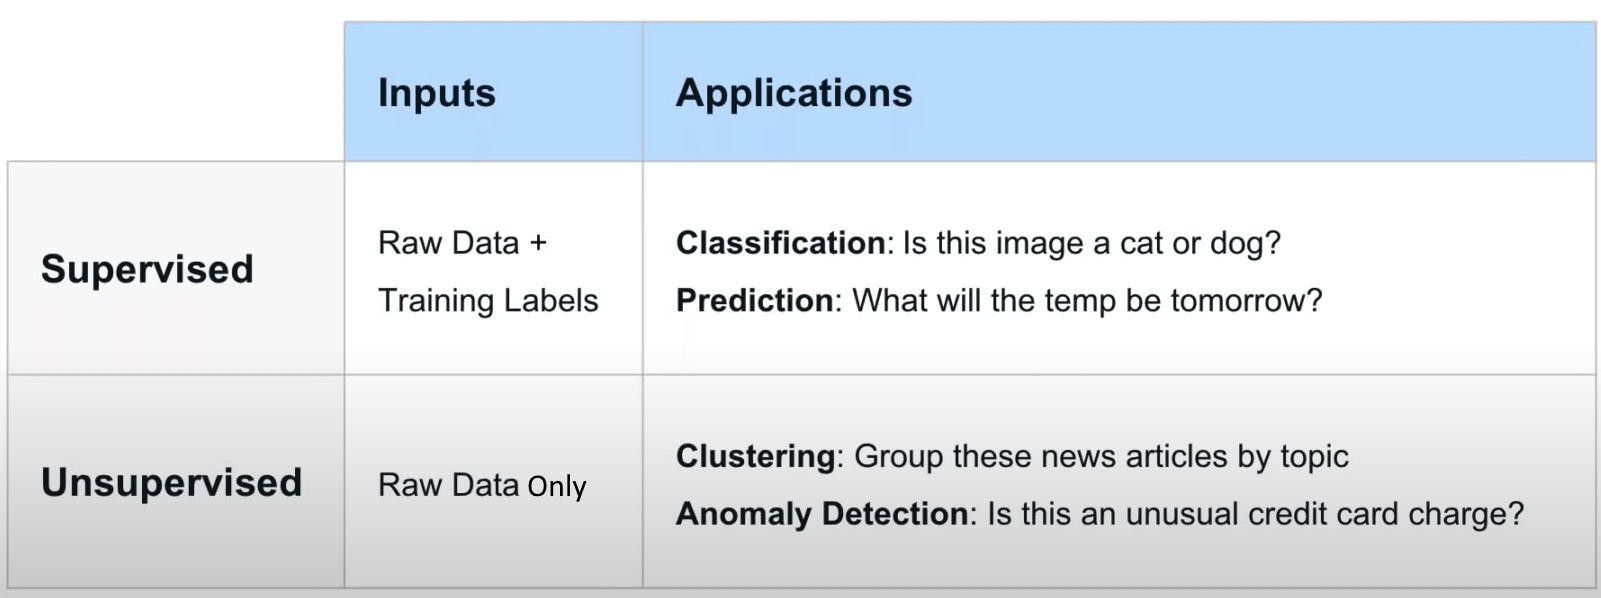
Figure 10.1 – Examples of supervised and unsupervised learning
Different types of input data are usually a better fit for one approach or the other and result in different end user experiences, but ultimately, supervised and unsupervised are just implementation details. Two things impact the IT operations team every day, which are the open box and black box approaches to ML.
A black box approach means an algorithm where you give it an input and you get an output, but you don't know anything about exactly how that output was arrived at. In some cases, this could have serious implications; for example, a credit card company might use ML to provide credit, and they might be compliant with foreign regulations that require them to be able to go back and explain to someone who applies for a credit card why an algorithm may have reached a certain decision.
An open box approach to ML is easy to explain and for the IT operations team, the openness is really an important property to improve adoption and outcomes. In brief, open box ML is explainable, editable, and insightful, as follows:
- Explainable: The logic produced by ML is expressed in a format that humans can see and understand.
- Editable: The logic produced by ML can be edited, so you can tweak it based on human knowledge and experience.
- Insightful: You can preview the results of the ML logic against a historical dataset (for example, monitoring alerts collected during a critical outage window).
So, basically, there are three factors that are important while adopting ML-based tools for IT operations, and those are transparency, control, and trust.
AIOps is a term coined by Gartner and it originally meant algorithmic IT operations, but later changed to artificial intelligence for IT operations. It's a new label for the category of tools that take ML capabilities and applies to the IT operations space. There are three main categories in IT operations where we can apply ML:
- Monitoring and dealing with alert and metrics data
- IT service desk or IT Service Management (ITSM)
- Automation in general
The following diagram shows the workflow of AIOps:
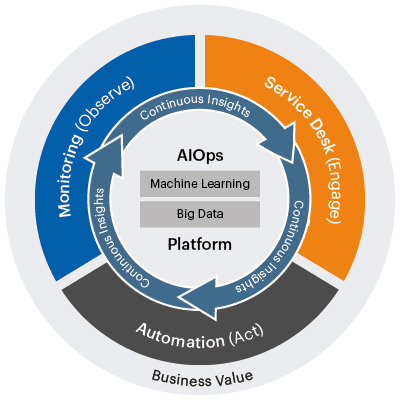
Figure 10.2 – Core workflow of AIOps
But why do we need AIOps? Everything is working fine right now. What are the challenges that lead us to use AIOps-powered tools?
In the past, IT teams have been very internally oriented, meaning that they mostly think about what they can accomplish with the technology, how can they reduce and control the cost structures, and how to organize all the processes within IT to be the most efficient organization.
But in the age of digital transformation, IT teams are more focused on where the business is going. Instead of thinking about cost reduction, they are focusing on revenue generation. There are lots of changes happening throughout the business. In any software development organization, they are incorporating lots of automated processes, such as Infrastructure as Code (IaC) to spin up the application infrastructure and CI/CD (Continuous Integration/Continuous Delivery or Deployment) to deliver the new features quickly. We are also seeing lots of changes in the infrastructure models of the public cloud and hybrid cloud. All these changes are creating a seismic shift. Ten years ago, we had fewer tools, and application delivery was a bit slow, but nowadays we have so many tools and every now and then new features are released. These things create lots of noise, issues, and maintenance, and we can't simply employ more and more people to resolve and maintain this. Now the question remains: what is happening to IT and IT operations and how is it impacting IT operations? What sort of changes are required in IT operations to support this large infrastructure, smooth application delivery, and the maintenance of it?
IT operations teams must keep up with a more dynamic IT landscape, including containers, serverless functions, microservices, cloud-native architectures, and public and hybrid cloud deployments. IT operations teams also must support innovation and digital transformation but at the same time they still need to maintain the legacy and traditional infrastructure because IT operations is additive so they still have to maintain previous responsibilities. Now, at this point, IT operations teams leverage automation and ML-based tools and capabilities to ensure that they can handle the scale and complexity.
IT operations teams are already using some tools such as rule-based engine automation, which works for now, but it just doesn't handle all scenarios. The rule-based tools work in the following manner:
- Select a specific subset of your data to focus on.
- Experts help determine how to process that data.
- Translate expert process to rules.
- The machine follows the rules.
- Observe and refine rules to deal with exceptions.
But the problem is, when you scale, you have tens and thousands of those rules. Another problem is how to manage those thousands of rules, and how those rules are aligned with the subset of target data. Now, at this juncture, ML can help.
As the data comes to your system, ML can learn about your environment. It can leverage all the institutional knowledge to handle the known knowns, but also leverage the intelligence in the system to be able to handle the unknown unknowns at a large scale. It can autonomously respond 24 hours a day, 365 days a year. Most importantly, if you are using open-box ML, you can control and modify the logic as well.
Now that we understand how ML-based tools or AIOps tools help IT operations teams, let's discover how AIOps works.
AIOps tools comprise three fundamental technology components, and those are big data, ML, and automation. It uses a big data platform to aggregate siloed IT operations data in one place. This data can include historical performance, event data that streams real-time operation events, system logs and metrics, and network data. Then, AIOps applies focus analytics and ML capabilities to separate significant event alerts from the noise. It uses analytics such as application rules and pattern matching to comb through the operational data and separate signals from the noise and significant abnormal event alerts. It then helps in identifying and proposing solutions. It uses industry-specific or environment-specific algorithms to correlate abnormal events with other event data across environments to identify the cause of an outage or performance problem, and eventually suggests remedies or solutions. AIOps then automates responses as well as a real-time proactive resolution. AIOps also automatically routes alerts and recommended solutions to the appropriate IT teams or even creates response teams based on the nature of the problem and the solution. In lots of scenarios, AIOps processes the results from ML to trigger automatic system responses that address problems in real time, before IT teams are even aware of them. AIOps also learns continuously and independently in order to improve how it handles future problems. It uses the results of the analytics to change the algorithm or create a new one to identify the problem even earlier and recommend more effective solutions.
AIOps encompasses a broad category of tools that IT operations face today, such as the following:
- AIOps for incident and problem management
- AIOps for IT operations analytics
- AIOps for infrastructure management
- AIOps for capacity management
There are some amazing companies that provide effective AIOps tools, such as Splunk, Moogsoft, and BigPanda. AWS has recently announced an AIOps service, DevOps Guru, which is at an early stage but is improving quite rapidly. In the next section, we will learn more about Amazon DevOps Guru and how we can use it to improve IT operations.
AIOps using Amazon DevOps Guru
AWS has been hearing customers' feedback and acting on it by providing amazing managed services. One of the recently launched AWS services is Amazon DevOps Guru, which is powered by ML to improve an application's operational performance and availability. It helps detect behaviors that act differently from normal operating patterns so that you can easily identify operational issues long before they impact your application.
DevOps Guru uses ML models built on information that has been collected by years of Amazon and AWS operation excellence to identify anomalous application behavior (for example, resource constraints, error rates, and increased latency) and raise critical issues beforehand so that they do not cause any potential outages or service disruptions. Once DevOps Guru identifies an issue, it automatically sends an alert and provides information and a summary related to anomalies, root cause, timestamp, and the location where the issue has occurred. It also provides recommendations on how to remediate the issue.
DevOps Guru has the following main features:
- Aggregate operational data from multiple sources: DevOps Guru analyzes and composes streams of operations and maintenance data from multiple sources, such as CloudWatch metrics, AWS Config, CloudFormation, and X-Ray, and provides you with a dashboard to browse for and observe anomalies in your operational information, expelling the need for multiple tools. This delegated administrator may then browse, sort, and filter insights from all accounts within your company to create an organization-wide snapshot of the health of all monitored apps without any extra modification.
- Provide ML-powered insights: ML-powered advice helps DevOps Guru increase application availability and resolve operational issues faster and with less human work. It continually collects and analyzes metrics, logs, events, and traces in order to define typical application behavior boundaries. DevOps Guru then searches for outliers and combines anomalies to generate operational insights based on component interactions in your application. Using CloudTrail events, the insights show which components are impacted, the identification of associated problems, and advice on how to address them.
- Automatically configure alarms: DevOps Guru can be used by developers and operators to customize and set up alerts for their applications. DevOps Guru automatically identifies new resources and ingests associated metrics as your applications change and you accept new services. It then notifies you when a change occurs from regular operating patterns, without needing any manual rule or alarm modifications.
- Detect critical issues with minimal noise: DevOps Guru leans on years of expertise running widely accessible applications such as Amazon.com, as well as ML models built on internal AWS operational data, to deliver accurate operational insights for crucial application issues.
- Integrate with AWS services and third-party tools: Amazon DevOps Guru directly interacts with CloudWatch, Config, CloudFormation, and X-Ray to discover and track interconnections and dependencies between application components. AWS Systems Manager and EventBridge can also be integrated with DevOps Guru. DevOps Guru produces an OpsItem in OpsCenter for each insight it generates due to the interface with AWS Systems Manager. This allows you to make use of OpsCenter's capability to gain a better understanding of, investigate, and resolve operational issues more quickly. DevOps Guru also provides integration with third-party incident management systems such as PagerDuty and Atlassian, which can ingest SNS notifications from DevOps Guru and manage incidents for you automatically.
DevOps Guru is a managed service so you can enable it's feature with a single click. It doesn't need any additional software to deploy and manage. Before jumping to perform any operation on DevOps Guru, let's get familiar with some terminologies related to DevOps Guru:
- Anomaly: An anomaly is one or more connected metrics recognized by DevOps Guru that are strange or unexpected. DevOps Guru produces anomalies by analyzing metrics and operational data linked to your AWS resources using ML. When you set up Amazon DevOps Guru, you define which AWS resources you want to be evaluated.
- Insight: An insight is a collection of abnormalities discovered during the investigation of the AWS resources specified when DevOps Guru is configured. Each insight includes observations, recommendations, and analytical data that may be used to improve operational performance. There are two types of insights:
- Reactive: A reactive insight detects unusual behavior as it occurs. It includes anomalies with recommendations, relevant data, and events to assist you in understanding and addressing the issues right now.
- Proactive: A proactive insight alerts you to unusual conduct before it occurs. It provides abnormalities as well as advice to assist you in addressing the issues before they occur.
- Metrics and operational events: Analyzing the data given by Amazon CloudWatch and operational events released by your AWS services generates the anomalies that comprise an insight. You may examine the metrics and operational events that generate an insight to assist you in better understanding issues in your application.
- Recommendations: Each insight includes tips to help you enhance the performance of your application.
In the next section, we will deploy a container-based application on an EKS cluster and detect the anomalies using DevOps Guru.
Enabling DevOps Guru on EKS cluster resources
Because of the vast number of abstractions and supporting infrastructure, observability in a container-centric system gives new issues for operators. Hundreds of clusters and thousands of services, tasks, and pods can operate concurrently in many companies. This section will demonstrate new features in Amazon DevOps Guru that will assist in simplifying and increasing the operator's capabilities. Anomalies are grouped by metric and container clusters to increase context and facilitate access, and more Amazon CloudWatch Container Insight metrics are supported.
We will first deploy an EKS cluster using eksctl and then deploy the OpenTelemetry Collector to aggregate all the metrics and provide them to CloudWatch. Then, we will enable DevOps Guru for the EKS cluster resources.
Perform the following steps to enable DevOps Guru on EKS cluster resources:
- Deploy an EKS cluster using the eksctl command:
$ eksctl create cluster --name=dgo-cluster --nodes=1
- The previous command will create an EKS cluster using two CloudFormation stacks. One stack creates an EKS cluster and another one creates a node group, which consists of a worker node:
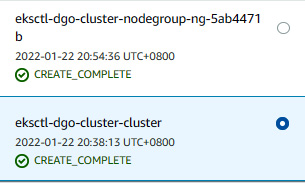
Figure 10.3 – CloudFormation stacks of an EKS cluster
- We will modify the Identity and Access Management (IAM) role of the worker node and attach a policy that allows CloudWatch to gather metrics from the worker node. Go to the EKS cluster console. Click on the dgo-cluster cluster. Then, click on Configuration, followed by Compute, as shown here:
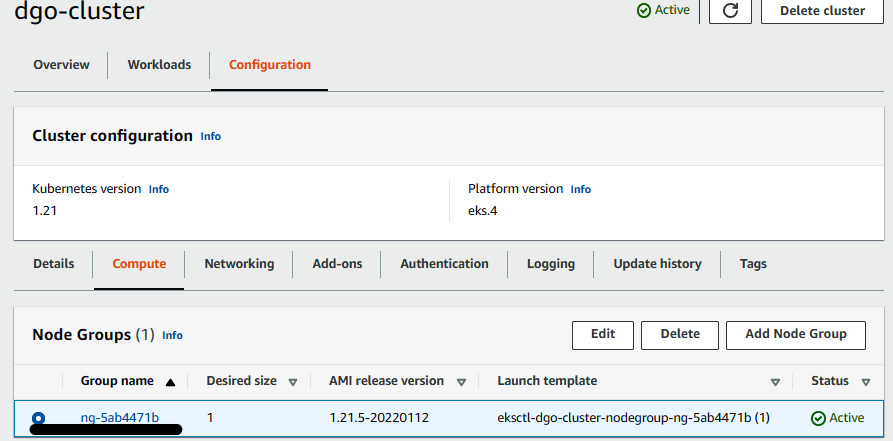
Figure 10.4 – An EKS cluster configuration showing the node group
- Click on the node group name and click on Node IAM role ARN value. You will be redirected to the IAM role permission page. Click on Attach policies and select CloudwatchAgentServerPolicy.
- Once you have attached the policy, deploy the OpenTelemetry Collector on the EKS cluster:
$ curl https://raw.githubusercontent.com/aws-observability/aws-otel-collector/main/deployment-template/eks/otel-container-insights-infra.yaml | kubectl apply -f -
- You can verify the pod by running the following command:
$ kubectl get pods -n aws-otel-eks
NAME READY STATUS RESTARTS AGE
aws-otel-eks-ci-rgt4l 1/1 Running 0 1h
- Once you have deployed the OpenTelemetry Collector, go to AWS CloudWatch and click on Metrics, then click on All metrics. You will be able to see ContainerInsights in Custom namespaces:
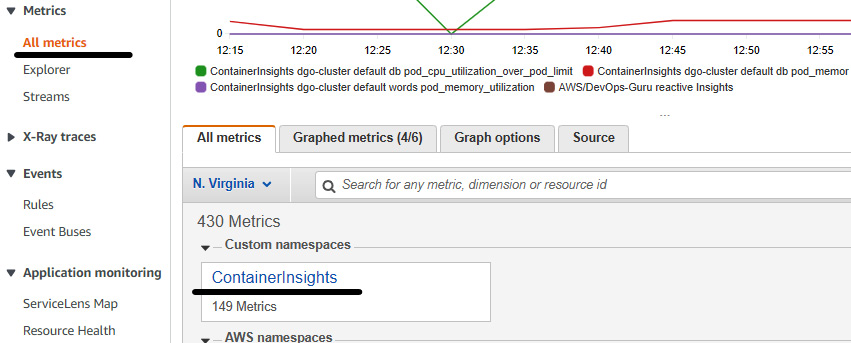
Figure 10.5 – The CloudWatch ContainerInsights metrics
- Now, go to the Amazon DevOps Guru home page and click on Get started to configure the DevOps Guru settings. It comes with a free tier for 3 months:
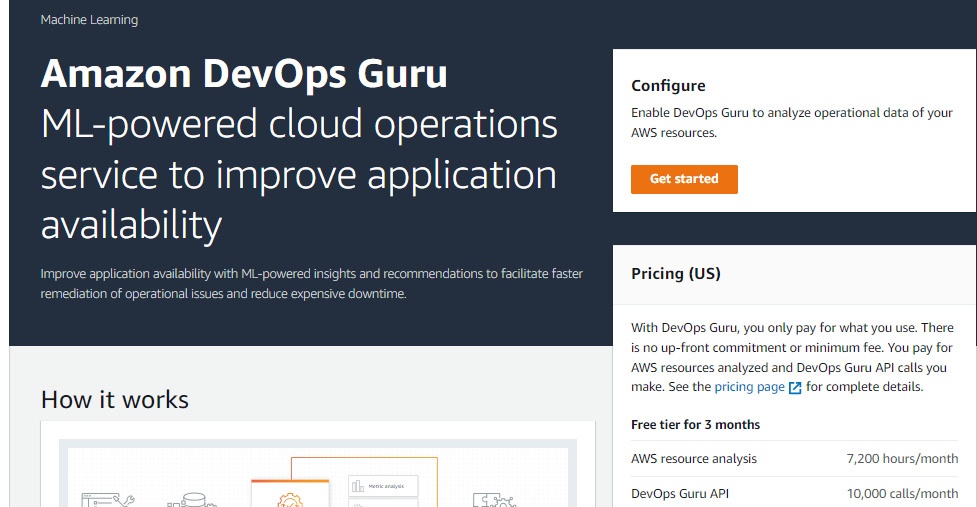
Figure 10.6 – The Amazon DevOps Guru home page
- You will see a Get started page where, under the Amazon DevOps Guru analysis coverage, you will be asked to select the resources that will be analyzed by DevOps Guru. Click on Choose later:
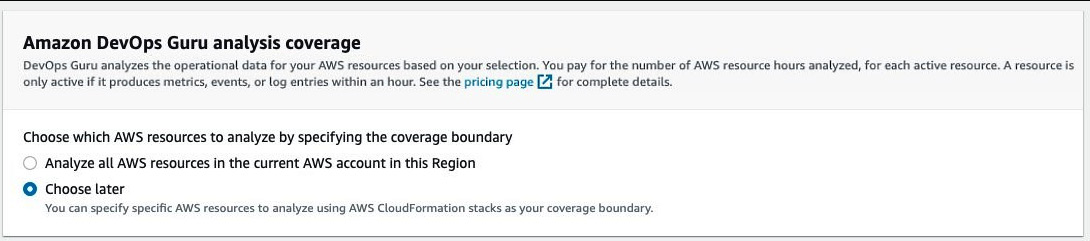
Figure 10.7 – Selecting resources for analysis coverage
- Under Specify an SNS topic, click on Create a new SNS topic, give it the name dgsns, and click on Enable.
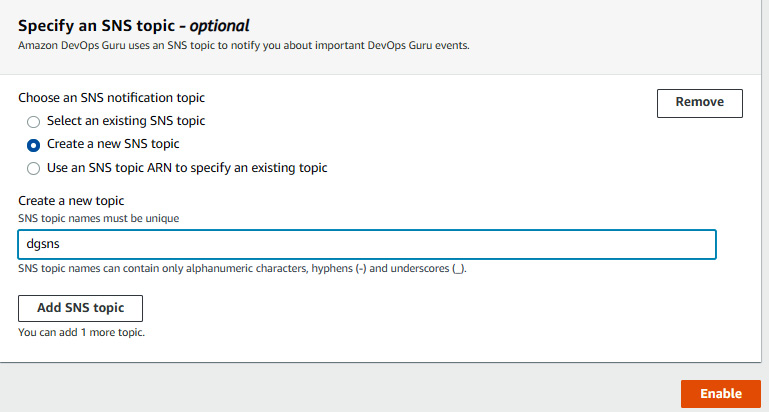
Figure 10.8 – Creating a new SNS topic
- Then, go to Settings and click on Analyzed resources. Click on Edit and select CloudFormation stacks. This basically allows DevOps Guru to choose the resources to analyze. Select the CloudFormation stack name that helped to create the EKS cluster and worker node. Then, click on Save:
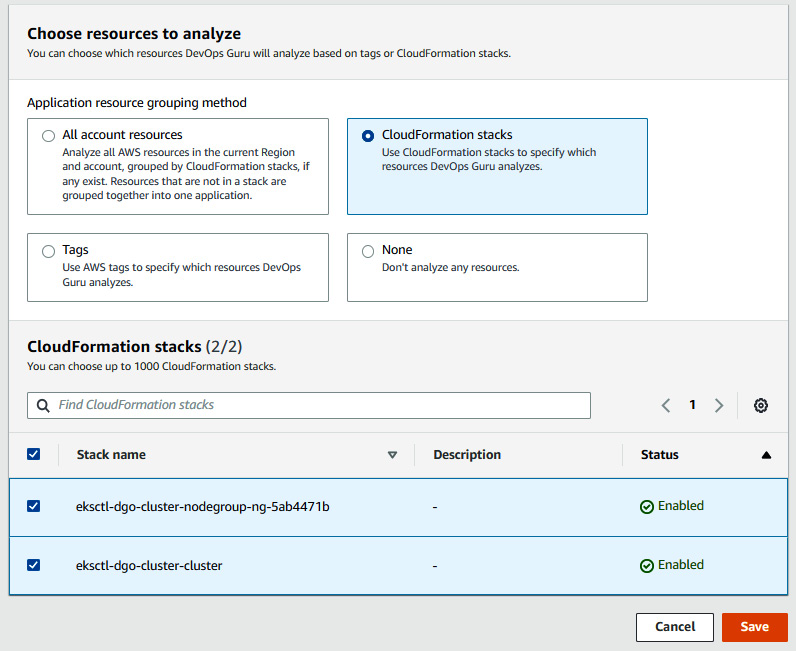
Figure 10.9 – Selecting the CloudFormation stack for analysis coverage
- Once we have configured that, DevOps Guru will analyze the resources created via the CloudFormation stack and show the health in the main Dashboard. As we can see, both of the resources are in a healthy condition:
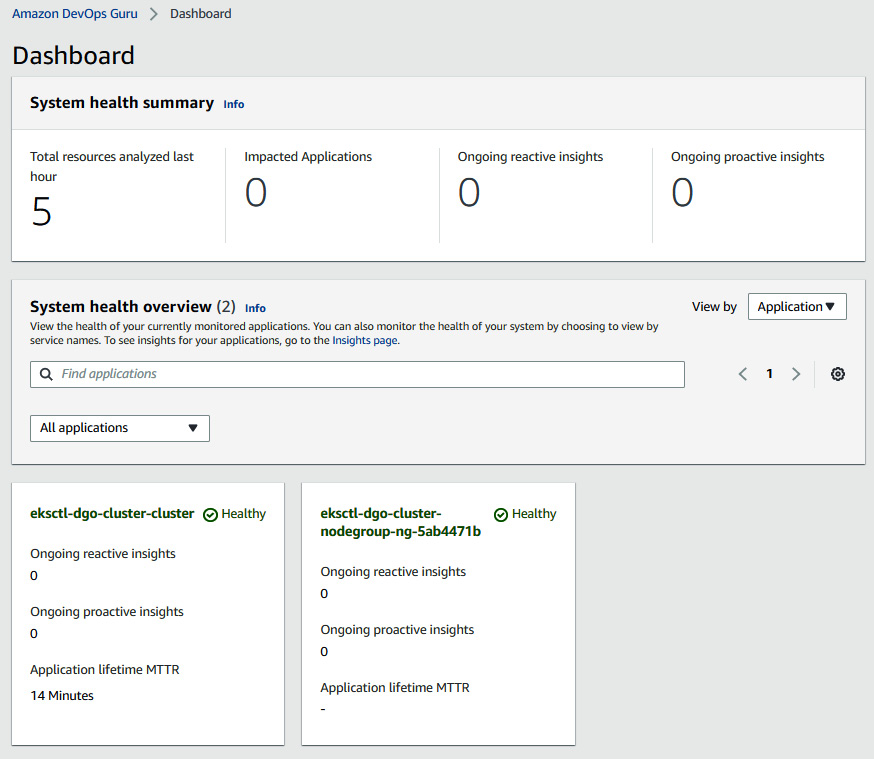
Figure 10.10 – Dashboard showing the health of resources after analysis
This way, we have enabled DevOps Guru on an EKS cluster. DevOps Guru will basically monitor and analyze the following metrics to detect the anomalies:
- cluster_failed_node_count
- cluster_node_count
- namespace_number_of_running_pods
- node_cpu_limit
- node_cpu_reserved_capacity
- node_cpu_usage_total
- node_cpu_utilization
- node_filesystem_utilization
- node_memory_limit
- node_memory_reserved_capacity
- node_memory_utilization
- node_memory_working_set
- node_network_total_bytes
- node_number_of_running_containers
- node_number_of_running_pods
- pod_cpu_reserved_capacity
- pod_cpu_utilization
- pod_cpu_utilization_over_pod_limit
- pod_memory_reserved_capacity
- pod_memory_utilization
- pod_memory_utilization_over_pod_limit
- pod_number_of_container_restarts
- pod_network_rx_bytes
- pod_network_tx_bytes
- service_number_of_running_pods
In the next section, we will deploy an application and inject a failure in it and see how DevOps Guru analyzes and provides the recommendation to resolve the anomalies.
Injecting a failure and then reviewing the insights
In this section, we will deploy an application that we deployed in previous chapters, and then we will inject a failure and validate how DevOps Guru analyzes those anomalies and provides the recommendation to resolve the anomalies.
Perform the following steps:
- Deploy the application on an EKS cluster:
$ curl -o starkapp.yaml https://raw.githubusercontent.com/nikitsrj/kube-app-golang/master/kube-deployment.yml
$ kubectl create -f starkapp.yaml
- Get the Elastic Load Balancer (ELB) endpoint and paste it in the browser to access the application:
$ kubectl get svc web
NAME TYPE CLUSTER-IP EXTERNAL-IP PORT(S) AGE
web LoadBalancer 10.100.1.2 a4ce7bd79683043d5ae122943d00d2c4-1894525087.us-east-1.elb.amazonaws.com 80:31536/TCP 85m
The following screenshot shows the application UI:
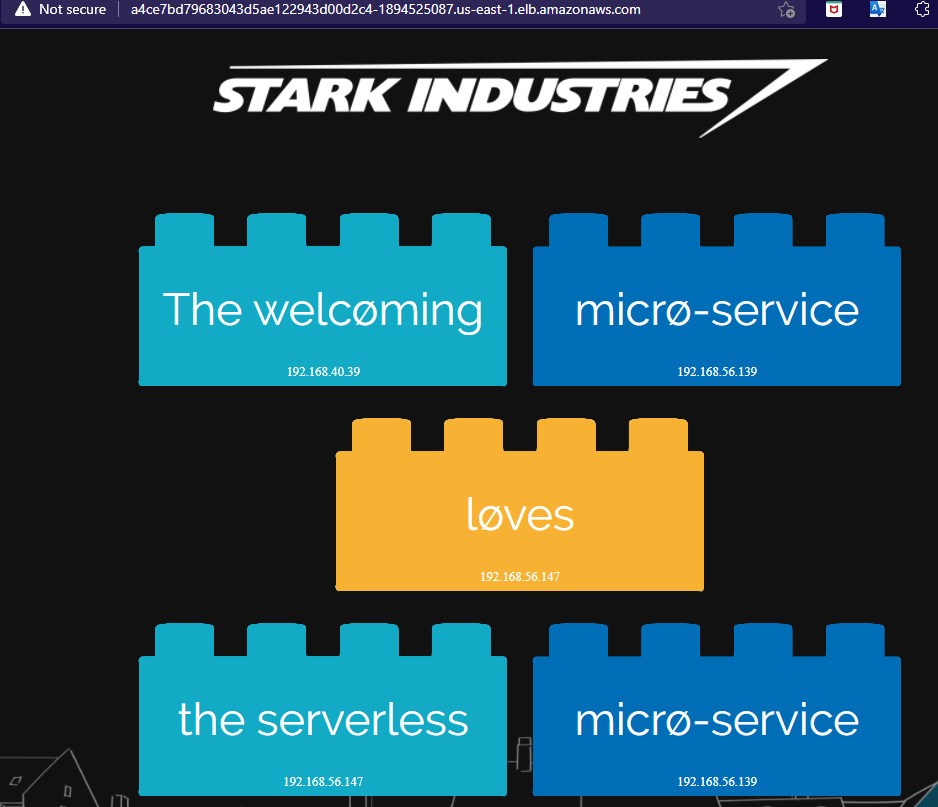
Figure 10.11 – The Stark app in the browser
- Now, we need to inject a failure by modifying the db pod resource limit. You need to add the resource limit in the deployment file and save the file as follows:
$ kubectl edit deployment db -o yaml
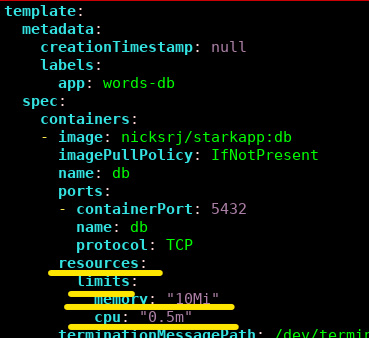
Figure 10.12 – Adding the resource limit in a db deployment
- Once you do the previous step, it will delete the db pod and create a new one.
- Now, you need to simulate minor traffic on the website. Enter the following command in your terminal, which will call the website every second. This will spike the CPU utilization of the pod more than the limit:
$ watch -n 1 curl http://<URLOFWEB>
- You will be able to see the db pod keep on restarting:
$ watch kubectl get pods -A
The following screenshot shows the db pod status:

Figure 10.13 – The db pod keeps on restarting
You can also check the application in the browser. The words in the application box will be missing:
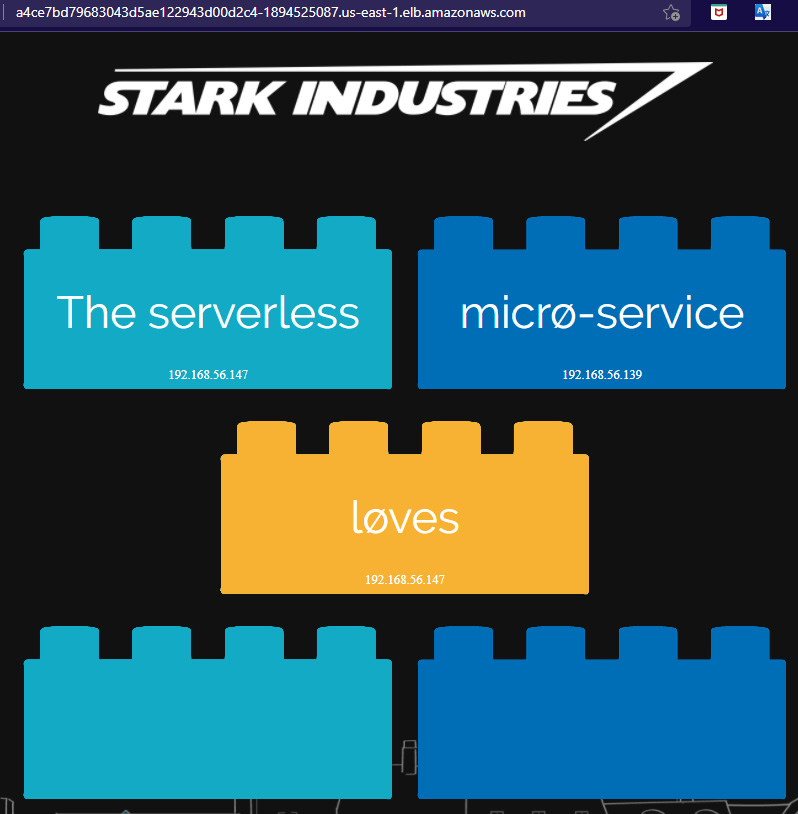
Figure 10.14 – The Stark app UI without words in the box
- Now, if you go to the DevOps Guru dashboard, you will see one of the application systems is unhealthy:
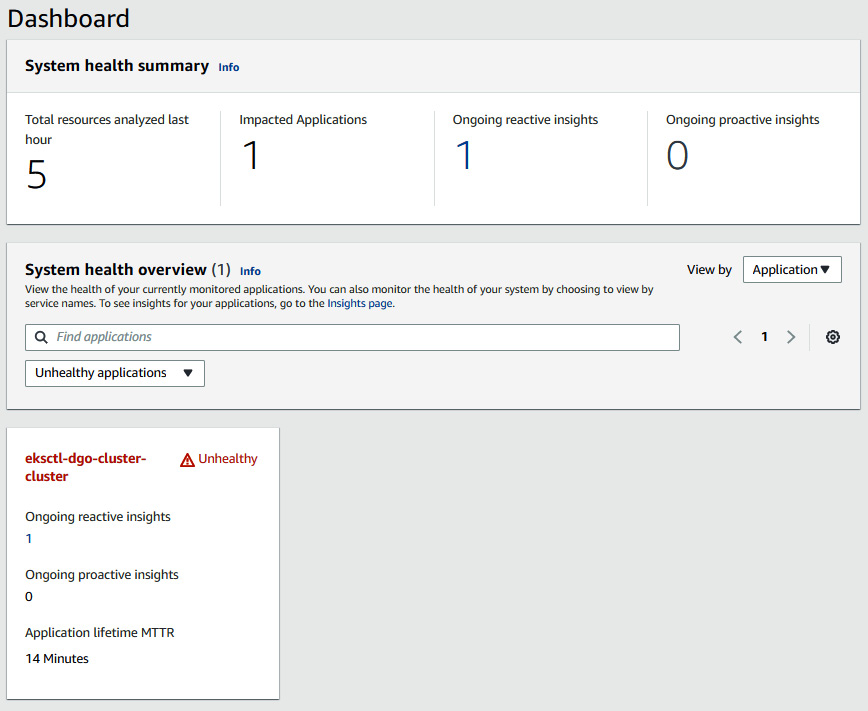
Figure 10.15 – The DevOps Guru dashboard
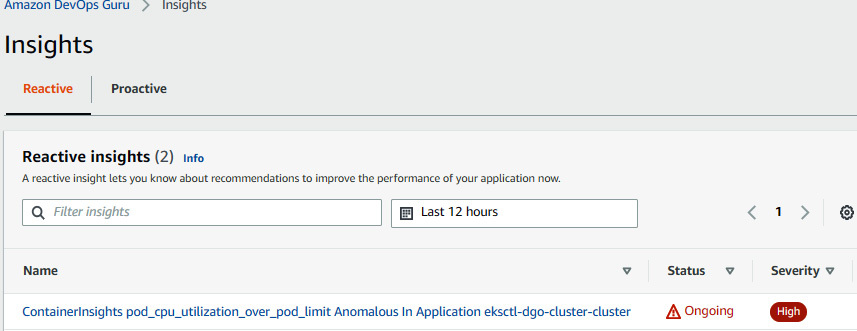
Figure 10.16 – The DevOps Guru Insights page showing reactive insights
- Click on the insight name, and you will be able to see the metrics and the pod that is affected:
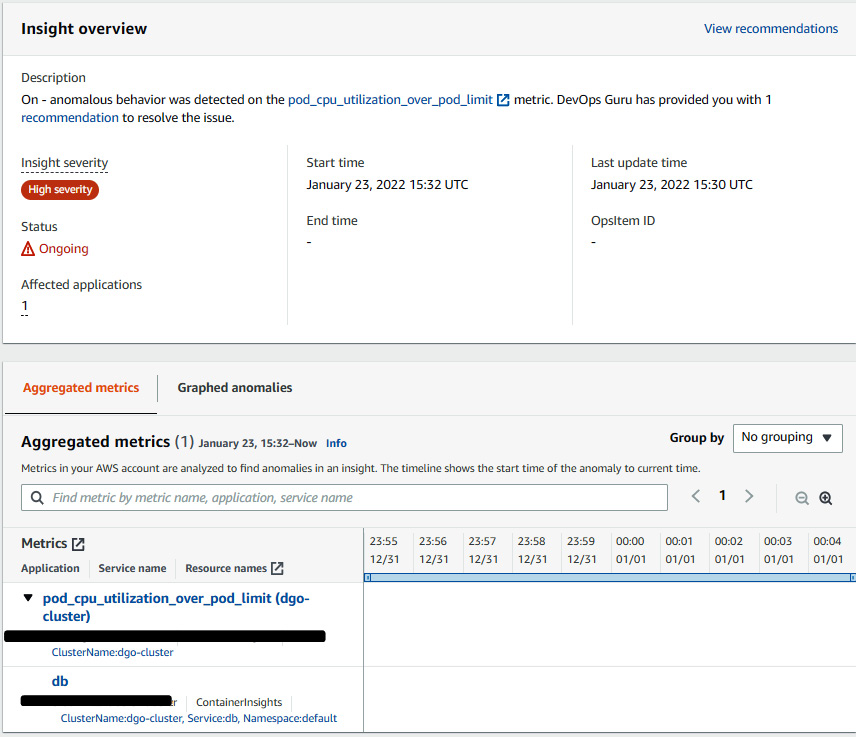
Figure 10.17 – Insight overview with Aggregated metrics
- We can see that the pod_cpu_utilization_over_pod_limit metric raised this anomalous behavior. We can also see that the pod affected is db. Click on Graphed anomalies to see the graph of CPU utilization with a timestamp:
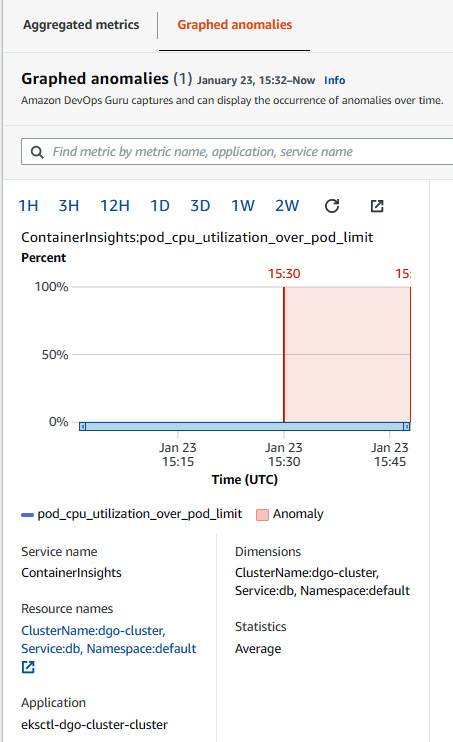
Figure 10.18 – Insight overview with Graphed anomalies
- Amazon DevOps Guru also provides the recommendation for this anomaly. Since, in this case, the problem occurred because of CPU utilization, it is recommended to scale the deployment. So, DevOps Guru recommended automatic scaling:
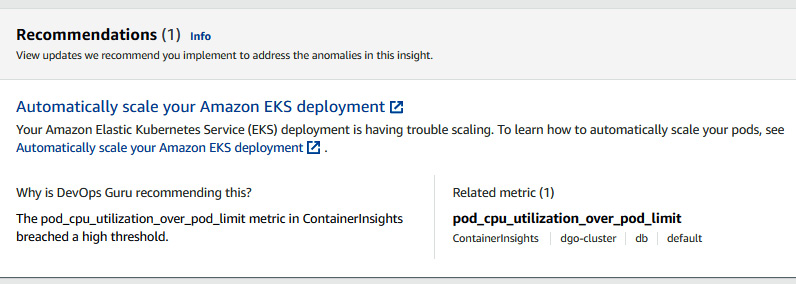
Figure 10.19 – A DevOps Guru recommendation
We just saw how DevOps Guru caught anomalies in the insight and provided a recommendation. We can configure this step in CI/CD to have a strong AIOps solution along with the application delivery. In the next section, we will deploy a serverless application and enable DevOps Guru on the serverless stack.
Deploying a serverless application and enabling DevOps Guru
In this section, we will deploy a serverless application using a CloudFormation template. This CloudFormation template will create a few resources, as follows:
- A DynamoDB table
- Two Lambda functions and some roles
- One API gateway and methods
This CloudFormation template has been cloned and modified from the AWS DevOps Guru sample repository provided by AWS, but we will be using this only to create application-related AWS resources with some modification. After that, we will enable DevOps Guru on the application stack.
Perform the following steps to deploy the stack:
- Configure the awscli credentials and configure the output as json. Install jq by running the following command:
$ sudo yum install jq -y
- Install python3.6 and pip 20.2.3:
$ sudo yum install python36 -y
$ sudo python3 -m pip install --upgrade pip
- Install Python modules:
$ pip3 install requests
- Clone the sample code:
$ git clone https://github.com/PacktPublishing/Accelerating-DevSecOps-on-AWS.git
$ cd Modern-CI-CD-on-AWS/chapter-10
- Before we deploy this application, let's take a look into the dynamodb table resource configuration of cfn-cartoon-code.yaml. The readcapacity parameter is set to 1:
Resources:
ShopsTableMonitorOper:
Type: AWS::DynamoDB::Table
Properties:
KeySchema:
- AttributeName: name
KeyType: HASH
AttributeDefinitions:
- AttributeName: name
AttributeType: S
ProvisionedThroughput:
ReadCapacityUnits: 1
WriteCapacityUnits: 5
- Deploy the application infrastructure using CloudFormation. It will take few minutes to deploy all the resources:
$ aws cloudformation create-stack –stack-name gdo-serverless-stack –template-body file://cfn-cartoon-code.yaml –capabilities CAPABILITY_IAM CAPABILITY_NAMED_IAM
- You can go to the AWS CloudFormation console and see the status. Once it's completed, then get the DynamoDB table name.
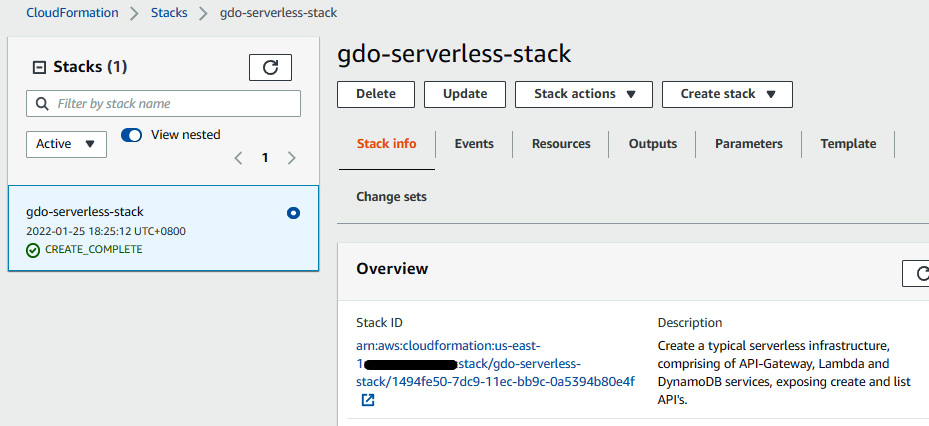
Figure 10.20 – The CloudFormation stack of a serverless application
The following command gives you the DynamoDB table name:
$ dynamoDBTableName=$(aws cloudformation list-stack-resources --stack-name gdo-serverless-stack | jq '.StackResourceSummaries[]|select(.ResourceType == "AWS::DynamoDB::Table").PhysicalResourceId' | tr -d '"')
- Update the database table name in the json file and populate the table using the json file data:
$ sudo sed -i s/"<YOUR-DYNAMODB-TABLE-NAME>"/$dynamoDBTableName/g cartoon-shops-dynamodb-table.json
$ aws dynamodb batch-write-item --request-items file://cartoon-shops-dynamodb-table.json
{
"UnprocessedItems": {}
}
- Get the API gateway ListRestApiEndpointMonitorOper OutputValue URL and paste it in the browser to view the data:
$ aws cloudformation describe-stacks --stack-name gdo-serverless-stack --query 'Stacks[0].Outputs'
[
{
"OutputKey": "ListRestApiEndpointMonitorOper",
"OutputValue": "https://unuoirftn0.execute-api.us-east-1.amazonaws.com/prod/",
"ExportName": "ListRestApiEndpointMonitorOper"
},
{
"OutputKey": "CreateRestApiEndpointMonitorOper",
"OutputValue": "https://lq8d1zs36m.execute-api.us-east-1.amazonaws.com/prod/",
"ExportName": "CreateRestApiEndpointMonitorOper"
}
]
The following screenshot shows the application output in the browser:
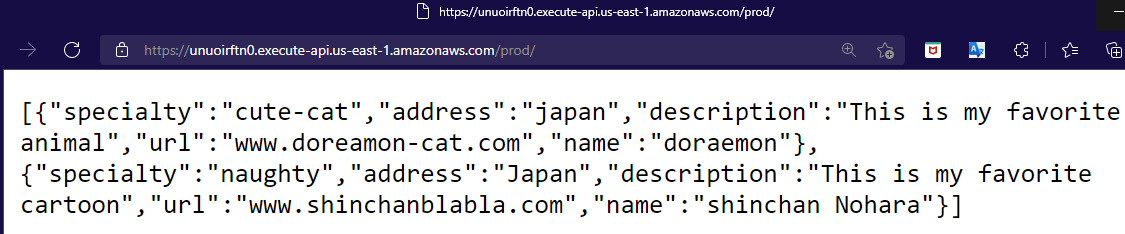
Figure 10.21 – Serverless application output
- At this point, the application is running fine. Now, let's put this application's CloudFormation stack under the analysis coverage of DevOps Guru. Go to the DevOps Guru console, click on Analyzed resources, and select CloudFormation stacks. Then select the name of the stack and click on Save:
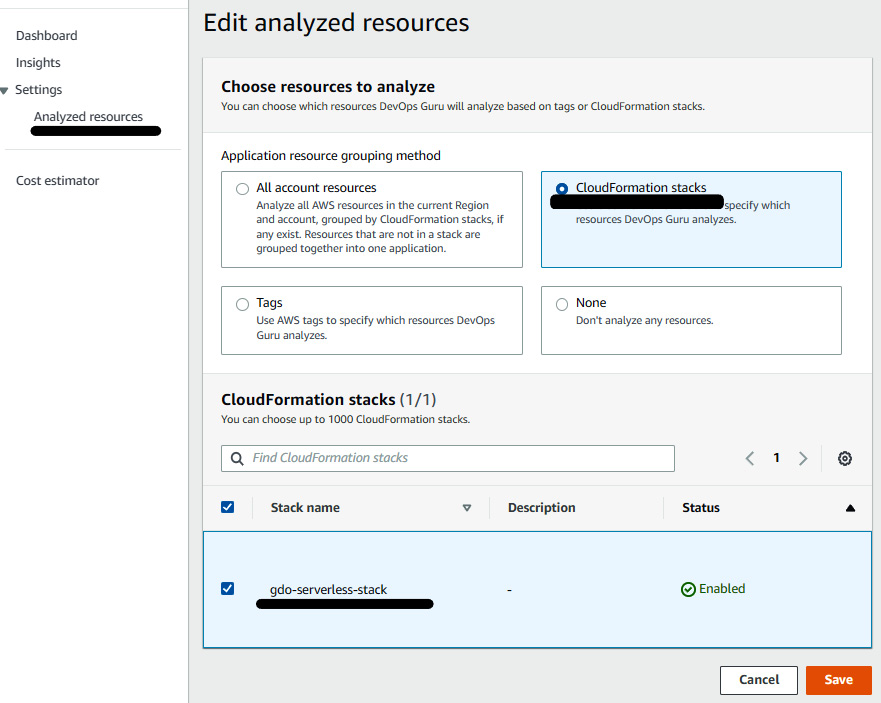
Figure 10.22 – Adding a serverless stack under analysis coverage
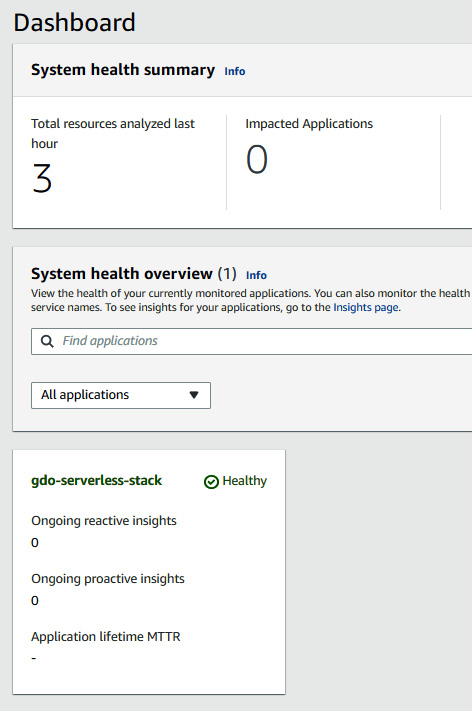
Figure 10.23 – The DevOps Guru dashboard showing the healthy status
Let DevOps Guru analyze the application for at least 2 hours for a baseline before injecting any failure. Sometimes it takes 4-5 hours to analyze. It is very important for DevOps Guru to understand the current working metrics of the application. In the next section, we will be integrating DevOps Guru with Systems Manager OpsCenter.
Integrating DevOps Guru with Systems Manager OpsCenter
Whenever there is any insight taking place within DevOps Guru, it is recommended that some engineer is at least aware of the insight status. With the integration of DevOps Guru and OpsCenter, the response team can easily be notified with an OpsItem whenever there is a new insight taking place in DevOps Guru.
AWS has made it simple when it comes to integration between the services. To enable DevOps Guru to create an OpsItem in OpsCenter, go to the DevOps Guru console, click on Settings, and click on the checkbox under Service: AWS Systems Manager:
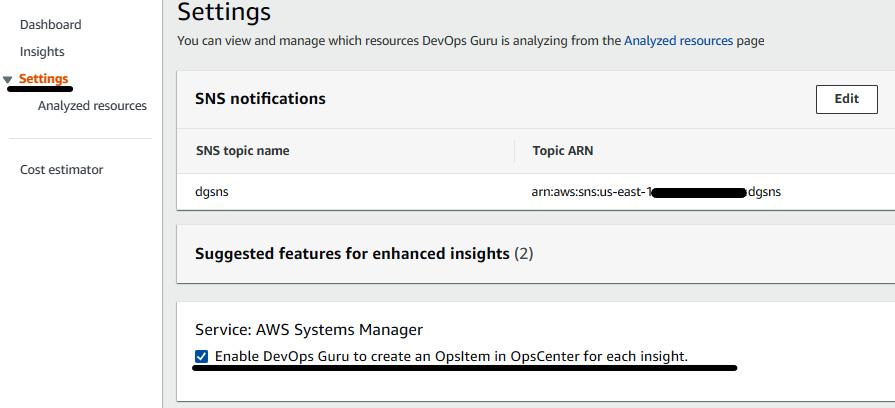
Figure 10.24 – Enabling DevOps Guru to create an OpsItem
Any new insight will automatically lead DevOps Guru to create an OpsItem in OpsCenter. In the next section, we will inject a failure and analyze the recommendation from DevOps Guru.
Injecting a failure and then reviewing the insights
In the previous section, we enabled DevOps Guru on the gdo-serverless-stack serverless application. We also enabled the integration between DevOps Guru and Systems Manager OpsCenter. Now, let's inject some failure and see the insight.
Perform the following steps to inject the failure:
- Edit the Python script and place the ListRestApiEndpointMonitorOper URL as the url variable value and save the file.
- Run the following Python script in four different tabs of your terminal to inject the large traffic. You need to keep this script running for at least 10 minutes. You will see there will be lots of failure requests with a 502 error code:
$ python3 sendAPIRequest.py
- After some time, you will be able to see the anomaly insight in the DevOps Guru console. The total analyzed resources may vary in your scenario:
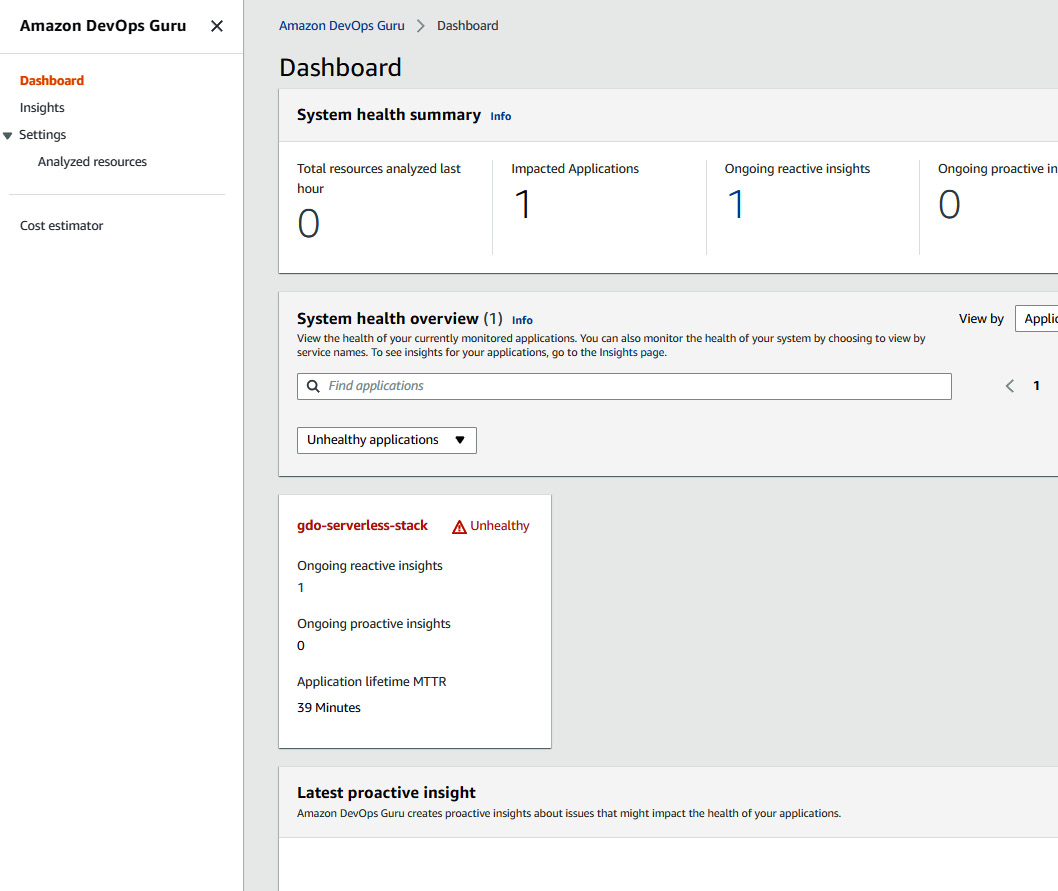
Figure 10.25 – The DevOps Guru dashboard showing the unhealthy status
- Once you click on Insights, you will be able to see an insight. The insight status is Closed in the following screenshot because I kept it for a longer period and stopped the traffic injection, so it automatically turned into a Closed state. But, if you keep monitoring it, you may see it with an Ongoing status:
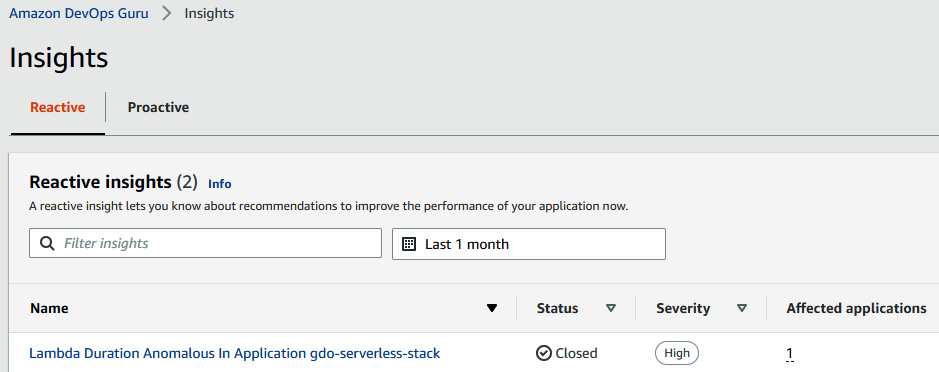
Figure 10.26 – DevOps Guru showing reactive insight anomalies
- Click on the insight and see the exact reason and recommendations. We can see that there were anomalous behaviors detected on five metrics, which were mostly related to 5XX errors and the Lambda Duration sum:
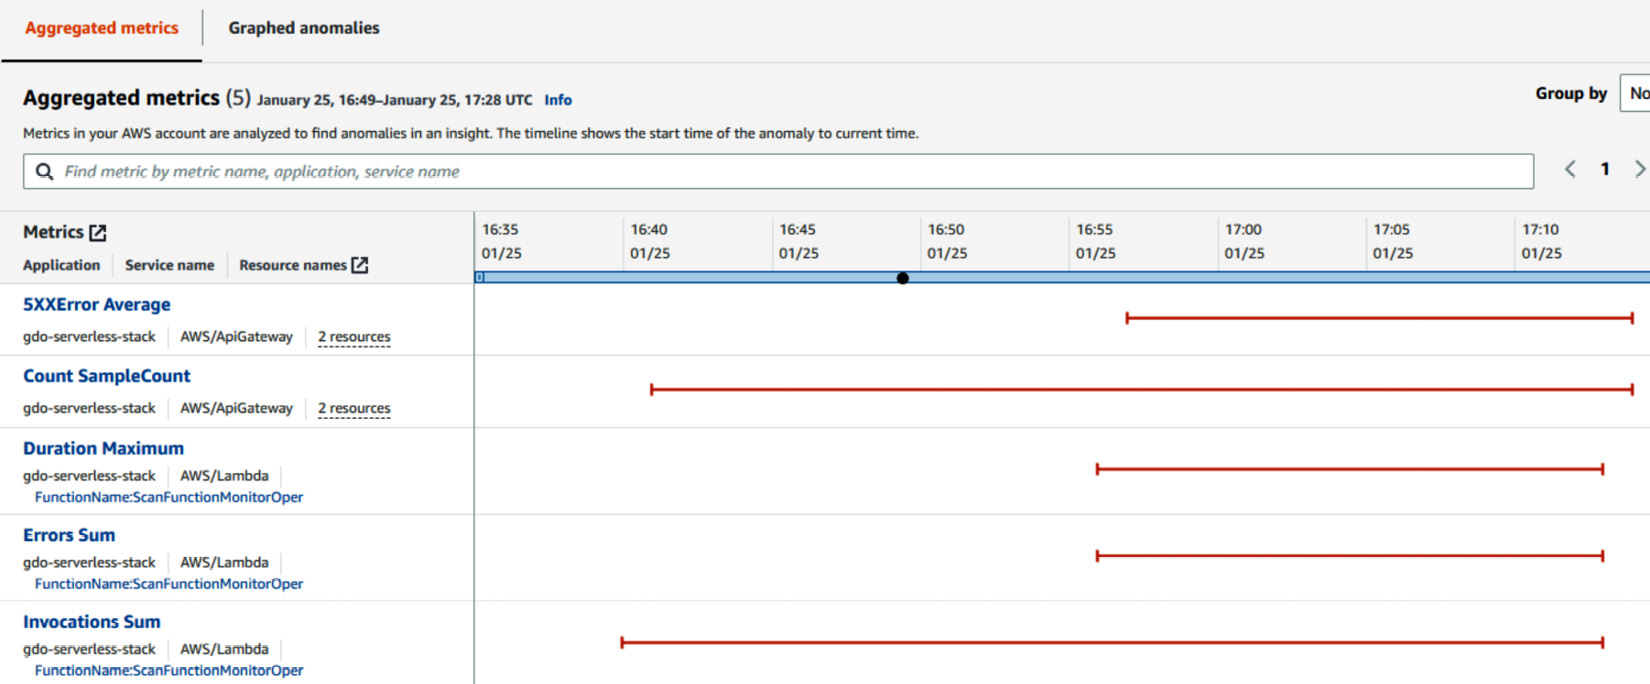
Figure 10.27 – An insight overview with Aggregated metrics
- We can also have a look at graphed anomalies by clicking on Graphed anomalies next to Aggregated metrics, which shows a snippet of API gateway 5XX errors and Lambda errors:
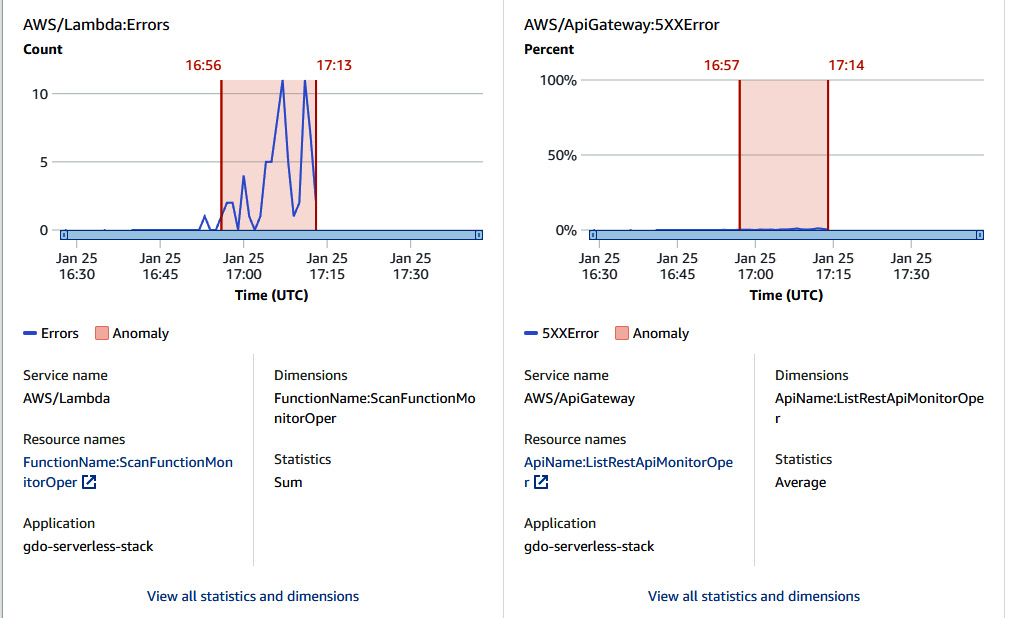
Figure 10.28 – Insight overview with graphical statistics
- When you scroll down, you will see the Recommendations section, where you will find a few recommendations provided by DevOps Guru:
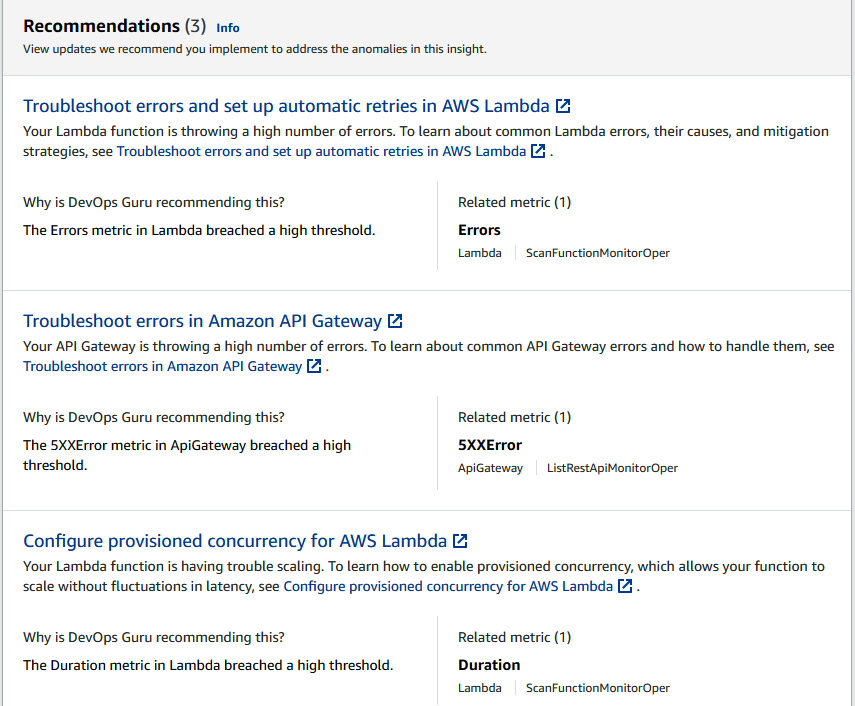
Figure 10.29 – Recommendations provided by DevOps Guru to address anomalies
- Now, let's have a look at the top section of the page, Insight overview, where you will see OpsItem ID:
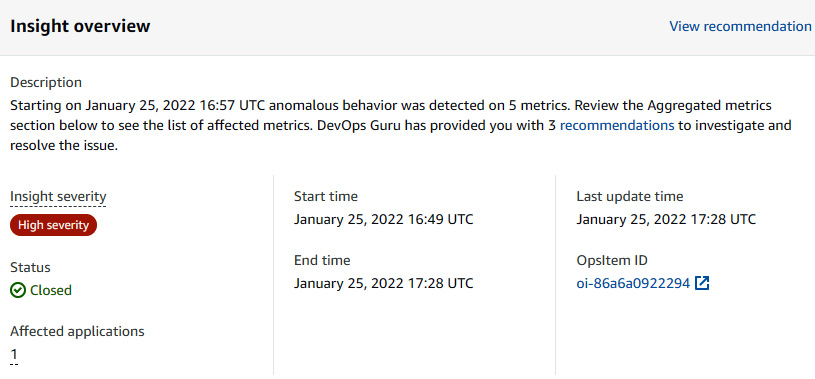
Figure 10.30 – Insight overview showing OpsItem ID
- Once you click on OpsItem ID, you will be redirected to the Systems Manager OpsCenter console, where you can see details of the anomaly. If OpsCenter is integrated with Incident Manager, then the incident team will get a notification or SMS based on the incident configuration, after which the incident team can investigate this issue immediately:

Figure 10.31 – The OpsItem console
So far, we have seen that DevOps Guru created an insight because of a 5XX error. The reason was the ReadCapacityUnits value for the DynamoDB table was 1. Let's change it to 5 and let DevOps Guru baseline for a while. Then, we will change ReadCapacityUnits back to 1 and inject the traffic again and see what sort of insight and recommendation DevOps Guru produces. Perform the following steps to change ReadCapacity to 5 and inject traffic:
- Edit the cfn-cartoon-code.yaml template file and change ReadCapacityUnits to 5:
Resources:
ShopsTableMonitorOper:
Type: AWS::DynamoDB::Table
Properties:
KeySchema:
- AttributeName: name
KeyType: HASH
AttributeDefinitions:
- AttributeName: name
AttributeType: S
ProvisionedThroughput:
ReadCapacityUnits: 5
WriteCapacityUnits: 5
- Update the dgo-serverless-stack CloudFormation stack:
$ aws cloudformation update-stack --stack-name gdo-serverless-stack --template-body file:///$PWD/cfn-cartoon-code.yaml --capabilities CAPABILITY_IAM CAPABILITY_NAMED_IAM
- Once the stack is updated, inject a minor amount of traffic for a while and stop the traffic, so that DevOps Guru baselines the condition of the application.
- Repeat Step 1, but with a ReadCapacityUnits value of 1, and update the stack again by running the command from Step 2.
- Now, inject the traffic again by running the following command in four different tabs of the terminal for at least 10 minutes:
$ python3 sendAPIRequest.py
- You will see a new insight in DevOps Guru caused by the ReadThrottleEvents sum:

Figure 10.32 – Different reactive insight generated for a serverless application stack

Figure 10.33 – Insight overview page showing the metrics for anomalies
- You can also see the recommendation of rolling back the DynamoDB table configuration, which caused this anomaly:
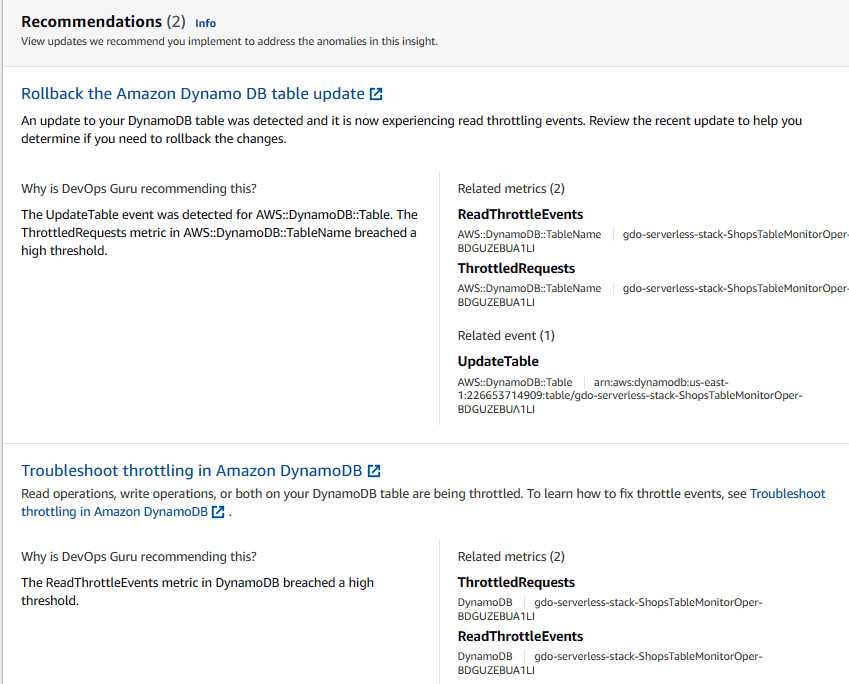
Figure 10.34 – Recommendation from DevOps Guru to address anomalies
So, you can see that DevOps Guru also analyzes the changes before and after the insight and gives the recommendation.
DevOps Guru is still at an early phase, but AWS is continuously adding new features to this service. Recently, they also added metrics such as database load and wait time to analyze the RDS anomalies. DevOps Guru is a black box AIOps tool, but there are lots of other features such as seamless integration, which is a good reason to opt for this service.
Summary
AIOps is the upcoming important thing for IT operations teams to manage their activity. In this chapter, we looked at the need for AIOps tools and how they help in revolutionizing IT operations. We learned some important concepts of ML, which also helps you analyze which AIOps tool to use, based on the open box and black box approaches. We learned about the new and managed AIOps service DevOps Guru and enabled it on containerized applications. We also enabled DevOps Guru on a serverless application and integrated it with OpsCenter to create an OpsItem for a generated insight. After reading all the chapters of this book, you should be able to create successful, secure, and intelligent CI/CD pipelines for applications as well as infrastructure.