
Chapter 7: Advanced Dynamic Analysis Part 2 – Refusing to Take the Blue Pill
In the previous chapter, we discussed advanced dynamic analysis techniques for collecting tools, techniques, procedures, and other intelligence from malicious samples.
We'll build on techniques we've covered previously in order to examine some of the more advanced topics available to us as malware analysts in the dynamic analysis of samples we may obtain during our tenure.
After we cover each of these topics, you'll also have the opportunity to try your luck against a sample that will allow you to practice each of these techniques and check your understanding of the topics covered. While not a real-world sample of malware, the tricks and techniques utilized in its creation are reflective of real-world samples.
We will cover the following topics:
- Leveraging API calls to understand malicious capabilities
- Identifying common anti-analysis techniques
- Identifying instructions indicative of packed samples
- Debugging and manually unpacking a sample
Technical requirements
- Flare VM
- An internet connection
- The malware sample pack from https://github.com/PacktPublishing/Malware-Analysis-Techniques
Leveraging API calls to understand malicious capabilities
While it is not, strictly speaking, a component of dynamic analysis, techniques identified within this chapter will make broad use of the APIs offered by Windows in order to achieve their goals.
To this end, it is important to have a basic understanding of how we may leverage Windows API calls in malicious programs to better understand what the capabilities of these programs may be, and at what point in their execution flow they may make use (malicious or otherwise) of these APIs offered by the Windows environment. Before we begin, we'll take a quick primer on x86 assembly to understand what may be occurring within these calls.
x86 assembly primer
32-bit malware still comprises the large majority of malware seen in the wild today, and for good reason. Malware operators wish to maintain the broadest compatibility possible for their payloads. 64-bit computers are able to run the x86 instruction set, but the inverse is not true.
To understand API calls within the Windows world of malware, it is not necessary to have a massively in-depth knowledge of x86 assembly instructions, nor is it necessary to be a world-class reverse engineer. We'll cover a few of the instructions and registers that need to be understood in order to make the best use of the information provided to us in Ghidra regarding the calls a malicious program may be making.
Important CPU registers
There are a few CPU registers that it is important to be aware of in x86. These registers are spaces within the processor's cache, and outside of RAM. These registers are much faster than RAM, and are utilized by the compiler to store data and results of logical operations much more quickly than if traditional volatile memory was utilized.
ESP
The ESP register, or extended stack pointer, points to the current instruction. This is the top of the "stack" of instructions to be executed by the processor.
EIP
The EIP register, or extended instruction pointer, points to the memory address of the next instruction to be executed. This can be the next address on the stack, or an entirely separate memory address if a function call is to be executed.
EAX
Here, naming conventions break down a bit. EAX stands for extended AX, the original name of the register on 16-bit assembly assigned by Intel. It's easiest to think of the "A" as standing for "Accumulator." This register is where the results of API calls will be stored.
Important x86 instructions
x86 assembly language is comprised of several sets of instructions that instruct the processor how to handle, change, or otherwise operate on data that it is provided with by either user input or by the programmer when a variable was set. We'll go over a few of the instructions that are critical to understanding how API calls are utilized within a malicious program.
PUSH
The PUSH instruction is utilized in moving data or variables to the stack. This will put the data into memory on the stack to then later be referenced by an API call or an operation within a function.
POP
The inverse of PUSH, POP, removes an item or data from the stack – it pops the data off the stack.
CALL
This is an instruction for the program to jump to a specified memory address and carry out the instructions there until it is instructed to return to its caller – the address that contains the call. This is utilized to facilitate calls to functions written by the malware author as well as to utilize API functions.
NOP
Short for No operation – fairly self-explanatory. This instruction instructs the CPU to perform no operation and proceed to the next instruction.
Various jump calls
In addition to CALL instructions, JUMP instructions are also utilized for coordinating the logical flow of a program by the compiler. Outlined here are a few of these instructions that may prove useful to be aware of during your journey:
- JNE: Jump if Not Equal
A comparative operator that will jump to the specified address if the operands compared are not equal to one another.
- JNZ: Jump if Not Zero
An operator that checks whether the result of the previous comparison is zero or non-zero and jumps to the specified memory address accordingly.
- JZ: Jump if Zero
The inverse of JNZ.
With an understanding of this amount of assembly, it should be possible for an analyst to gain a reasonable understanding of the tricks a malware author may utilize to prevent analysis, and the API calls they are utilizing to do so.
Identifying anti-analysis techniques
In creating their malware, it's in the author's best interest to do everything possible to increase the difficulty of analyzing the sample for malware analysts.
To this end, malware authors sometimes employ tricks that allow them to check whether the machine is a VM, what tools are running, whether the mouse is moving, and several other tactics for ascertaining whether or not the binary is being analyzed.
Examining binaries in Ghidra for anti-analysis techniques
Some malware will utilize several API calls baked-in to Microsoft Windows to obtain a list of running processes. As malware analysts, we are far more likely to be running "suspicious" processes that are meant to monitor the behavior of malicious executables on our systems.
As we've seen in previous chapters, tools such as RegShot, WireShark, and Process Monitor are often running on our machines as analysts. It only makes sense for a malware author to check for these processes and terminate execution of the program if they are found to make life more difficult for an interested party such as ourselves.
Let's take a look at an example piece of malware.
With a new project created in Ghidra, and our code browser opened, begin analysis on the binary. Before clicking Analyze, however, ensure that the WindowsPE x86 Propagate External Parameters option is checked, as shown. This will allow Ghidra to automatically provide some information on arguments that are passed to called API functions within the program:
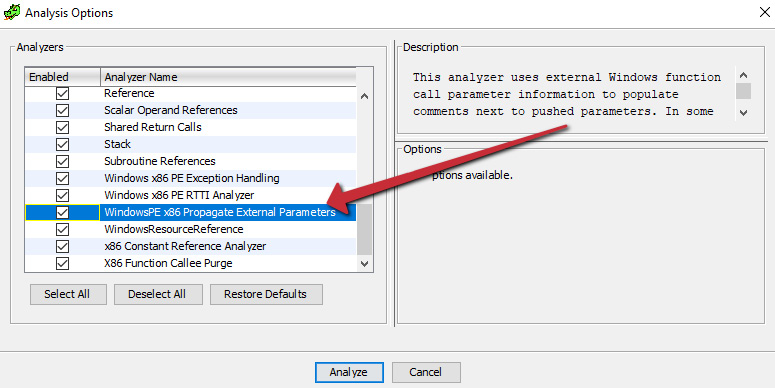
Figure 7.1 – Propagating external parameters allows Ghidra to display more information regarding arguments
Once the analysis is complete, we can utilize Window > Symbol References within Ghidra to examine the APIs that are utilized within the sample to see what the malicious executable may be doing:

Figure 7.2 – Looking at symbol references is often helpful in understanding malicious capabilities
Here, we can see a call to CreateToolHelp32Snapshot, which, we've previously learned, allows a program to generate a list of currently running processes on the system. Let's take a look at the calls to this API within the main code disassembly window.
In the second reference, we can see a CALL to CreateToolhelp32Snapshot from the function at 00401724:
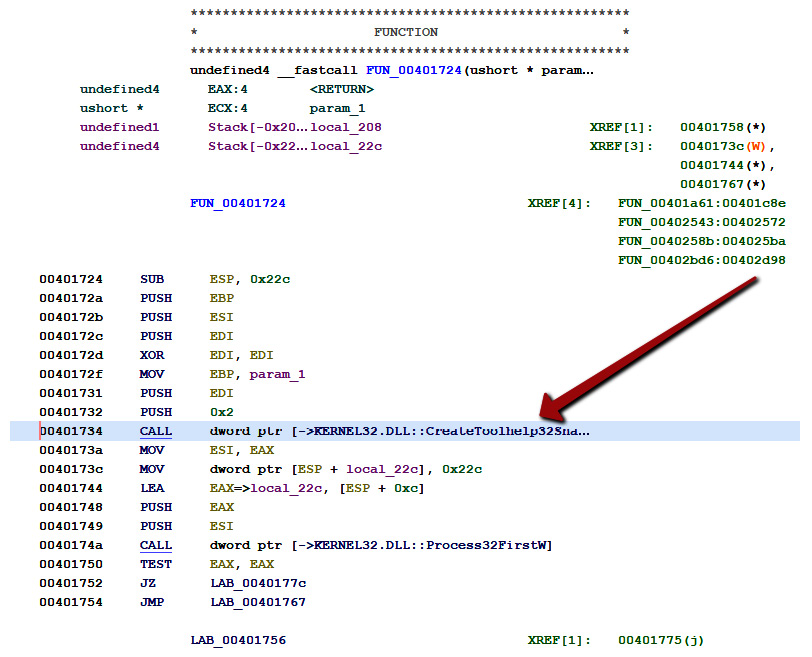
Figure 7.3 – A call to CreateToolHelp32Snapshot
If we utilize the Function Call Trees in Ghidra, we can see an incoming reference to this function from the function at memory address 00402bd6:
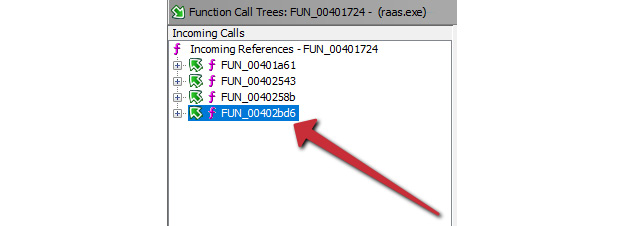
Figure 7.4 – An incoming call from another function within the program
So, with this knowledge, we know that the function at 00401724 is calling the API to create lists of running processes, and returning those results to the function at 00402bd6.
There are only a few reasons why a malware author cares about the list of running processes on a machine – general reconnaissance for determining the value or data types present on a target, avoiding detection or analysis, or migrating the malicious code via process injection. Let's examine the function at 00402bd6 to see whether we can ascertain what the code is doing with the information supplied:
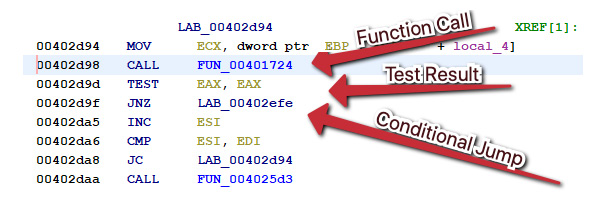
Figure 7.5 – The call to our function, followed by a conditional jump JNZ
Here, we can see the caller of the function creating the list of currently running processes, followed by testing EAX to ascertain whether the value of EAX is zero, and then a conditional jump if it is not.
However, diving into the target of the conditional jump shows code of no particular interest, just what appears to be a counter of some variety, first setting EAX to zero by XORing it with itself, and then incrementing the value by one. Perhaps the resultant data from CreateToolHelp32Snapshot is returned to the caller.
Utilizing Function Graphs again, we can check to see what the caller of the function at 00402bd6 is:

Figure 7.6 – The only incoming reference is from the entry point!
Interestingly, the caller for this function is the entry point. Let's double-click on that and examine the code surrounding the call to our function:
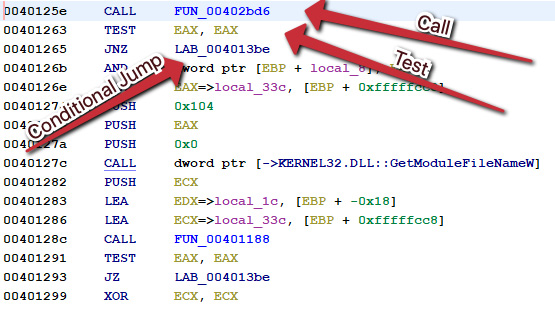
Figure 7.7 – Another call, test, and then conditional JNZ jump in the entry point
Again, here, we can see a call to the function that calls the function that calls CreateToolHelp32Snapshot, followed by testing EAX (the register that holds the results of a function), and a conditional jump.
However, following the conditional jump this time leads us to a much more interesting result:

Figure 7.8 – The malware self-terminates if it does not receive a satisfactory result from the function call
Here, we can see that the program pushes 0x0 to the stack, and calls ExitProcess(), terminating itself with code zero.
If we wanted to obtain specifics regarding which tools the sample was specifically looking for in order to terminate its process, we could load the executable in a debugger. However, if we only wanted to patch this function out, Ghidra makes that fairly easy.
We can return to the conditional jump, which is responsible for exiting the process, right-click on the instruction, and then select Patch Instruction:
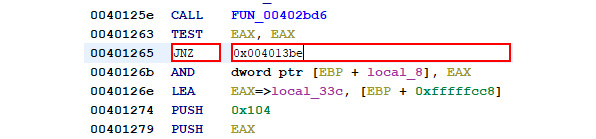
Figure 7.9 – Patching the conditional jump
Here, we can merely substitute the inverse of the instruction to reverse the logic in place. The inverse of JNZ – Jump if Not Zero – is JZ: Jump if Zero:

Figure 7.10 – Writing out the patched binary
Therefore, we can replace JNZ with JZ and reverse the logic of the tool check. From there, we can export the file using File > Export Program to be presented with the following window and save our patched binary to disk.
Analysis tip
Instead of altering the jump condition, it's also possible to just fill the corresponding instruction with 0x90 – the hexadecimal for the x86 instruction NOP – no operation, meaning that this instruction will be ignored altogether.
Another methodology we could utilize is to take the information we have learned from this analysis within Ghidra and apply it by utilizing a debugger instead – true dynamic analysis. To do this, we can load the binary into x32dbg and utilize Ctrl + G to go to the location where our conditional jump is located:

Figure 7.11 – Jumping to the memory address in x32dbg
After jumping here, we can see the call, followed by testing EAX, and then the conditional jump:

Figure 7.12 – The corresponding conditional jump to be filled with NOPs
If we highlight the conditional jump instruction, right-click, and choose Binary > Fill with NOPs, we can bypass this jump totally by filling the instruction with four 0x90 bytes!
As you can see, it can be an arduous process to follow API calls back to their source callers and understand how the data that is returned by the API is being leveraged by the malicious program. However, even knowing which API calls are being utilized is a powerful tool. We'll additionally go over some further avoidance techniques that may be utilized by malware authors. While we will not deconstruct each one in depth, as we have done here, each one may be defeated in similar ways.
Other analysis checks
Obviously, checking for running tools is not the only way that adversaries may attempt to find out whether or not their binary is in an analysis environment. Several other methodologies exist and are in wide employ among malware authors. Let's take a look at some of the ways in which adversaries are known to make our lives more difficult as analysts.
MAC address checking
One of the techniques that can be utilized to verify whether a machine is a VM is checking the physical address of the network connection. All MAC addresses start with three colon (:)-separated bits of information, known as an OUI, or Organizationally Unique Identifier. This can be utilized to ascertain the manufacturer of the network card.
In VM implementations, the virtual NIC is generally assigned to one of a few vendors via OUI, listed in the following table:
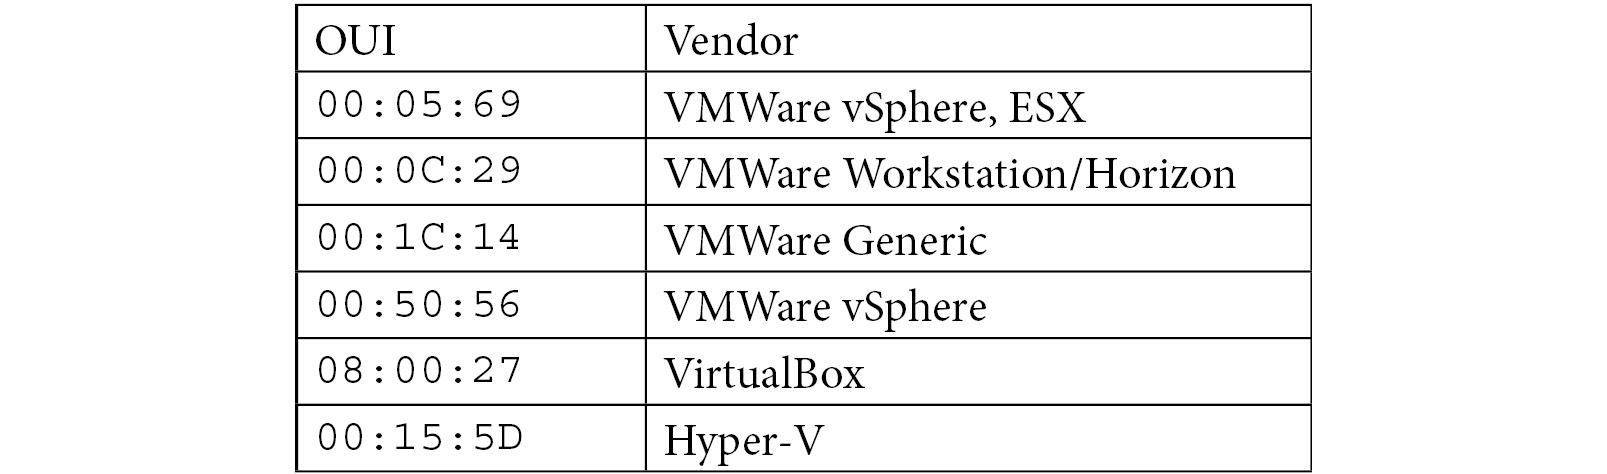
As you can see, this information can be utilized to ascertain not only whether a physical machine is being used to run the program, but also which vendor is being utilized to facilitate the VM, and branch instructions in the malware accordingly.
Analysis tip
Although VMs are in common use at this point for everyday infrastructure and end workstation workloads, the granularity of OUIs can tell the author whether it is likely an analysis workstation or a high-value target, such as a Hyper-V Domain Controller or vSphere server in a farm.
If this methodology is being utilized by the threat actor, you'll likely see an API call to the built-in GetAdaptersInfo API function within Windows.
Checking for mouse activity
Other implementations of anti-analysis techniques have hinged on detecting input from the end user in order to ensure that the sample is being detonated in an active environment. A key difference between automated malware detonation environments and active, user-utilized computers is that on a user-utilized computer, activity will be almost constant, especially if the user has just opened a malicious document or attachment.
While mouse activity is easy to emulate from a detonation environment standpoint or from an analysis standpoint, it is not always done, and can be a rather efficacious way to detect analysis environments, particularly when chained with other methodologies outlined.
SetWindowsHookEx calls are also utilized by keylogger-style malware to monitor keystrokes. It's important to monitor which arguments are pushed onto the stack prior to the call to SetWindowsHookEX, as well as what the program does with the returned values from the call to the API within the EAX register.
API calls to SetWindowsHookEx, particularly with arguments corresponding to WH_MOUSE and WH_MOUSE_LL, are indicative of this type of activity, but are also indicative of general monitoring of the keyboard and mouse, so it is important to note the context in which these APIs are called within the program.
Checking for an attached debugger
Perhaps one of the simplest checks that adversaries perform when checking whether or not a sample is being analyzed is the check for a debugger currently attached to their running process.
Whether a good thing or not, depending on your perspective, the Windows APIs have made it incredibly easy to check whether a process is currently being debugged. A simple call to the IsDebuggerPresent API will return a Boolean (0 for false, 1 for true) that indicates whether the currently executing program has a debugger attached. The simplest way to bypass this check is to allow the check to execute, and NOP the corresponding conditional jump.
Checking CPUID values
A methodology that does not require calls to any Windows API is checking the values of the CPUID. This will allow the malware to see whether the CPU corresponds to a known sandbox or VM value that they have stored within the stack.
CPUID is an opcode built directly into the x86 assembly language, thereby requiring no external calls, and can be executed in line with the program. Any calls to CPUID within a malicious sample should immediately be met with suspicion.
There are multiple ways to defeat this call; however, an analyst could debug and NOP any conditional jump that takes place based on the results of the CPUID check, or simply alter their CPUID by editing their VMX or corresponding VM file to return a different value altogether, thus bypassing the detection of the VM or sandbox.
While perhaps not an exhaustive list of anti-analysis techniques that are in utilization by threat actors today, these techniques comprise a large majority of those that are most easily bypassed within the Ghidra or debugger-related environment.
In addition, armed with the knowledge that we have from analyzing API calls in an attempt to perform anti-anti-analysis, we've also gained the ability to understand other API calls the malware may make within the Windows environment, and how those may relate to the malware's ability to create persistence, monitor user activity, encrypt files, or whatever method the threat actor has chosen to create an impact within the environment.
Tackling packed samples
Perhaps one of the more common problems faced by analysts during the dynamic analysis phase of malware analysis is the encountering of samples that are packed, either by a commercially available packer such as UPX, or from a custom "roll-your-own" implementation from the threat actor.
In the case of a packed malware sample utilizing a commercial packer such as UPX or Themida, the easiest way is obviously to utilize the commercial unpacking tool to simply obtain the raw binary.
However, in some instances, this may not necessarily be possible, particularly if it is an altered version of a commercial packer, or if it is a custom-written packer for the piece of malware in question.
Recognizing packed malware
We've previously discussed how to recognized packed malware via entropy. However, there are a few other ways as well. If strings are run on a packed sample, there will often be no recognizable strings that are found within the sample, other than perhaps those inserted by the packer in question.
Additionally, there are patterns to instructions that are utilized by a packer in assembly language. Most packers will start with a PUSHAD instruction. In x86 assembly, this pushes the values of all eight CPU registers onto the stack at once, an instruction rarely used within x86 assembly otherwise. One other final trick for assembly is that the IAT (import address table) will be rather sparse, only utilizing the imports necessary for the binary to unpack itself upon execution, usually VirtualAlloc (to allocate space within memory to write the unpacked binary).
Let's now take a dive into how, without utilizing any of the automated tools at our disposal, we may manually unpack a piece of malware and obtain the raw executable for analysis and study.
Manually unpacking malware
As previously alluded to, malware must first unpack itself before beginning execution. Armed with this information, we know it should be possible to step into the execution of the program with a debugger, allow the program to write the unpacked version of itself into memory, and then write the resultant binary to disk.
We'll start by attaching our debugger, x32dbg, to a packed sample of malware. The debugger will automatically pause itself at the entry point to our application:

Figure 7.13 – Paused at the entry point in x32dbg
Once we are paused at the entry point, we can begin looking for the end of the unpacker code within our binary. In this instance, it will be near the very end of the code – one final JMP instruction before the rest of the space is filled with zeroed-out operations:
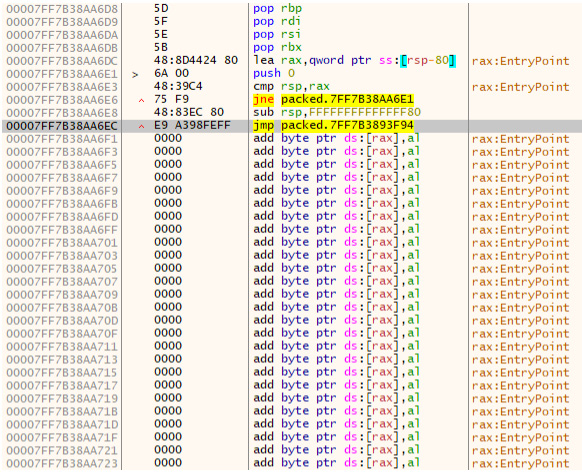
Figure 7.14 – The final jump before a large portion of empty address space
Logically, if a jump is taking place at the very end of the program, we can assume that the jump is going to be pointed to at the beginning of the address space that the binary will be utilizing to write the raw, unpacked executable. Here, we can set F2 and set a breakpoint. Now, we can simply press F9 to allow the executable to unpack itself and pause before continuing execution!
With the packed binary paused on the breakpoint of the jump to the raw binary loaded into memory, we need to actually execute this final instruction to get to the correct address. For this, we'll press F7 and take a single step into the next instruction and follow the jump.
After following the jump, we are now placed at the OEP – original entry point – and are looking at the unpacked version of the code!
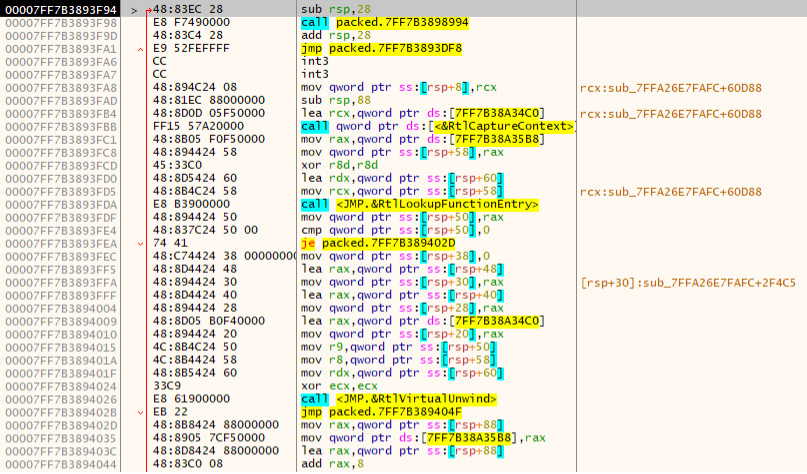
Figure 7.15 – Following the jump to the unpacked code
To write the unpacked version of the binary to disk, we can utilize a plugin for x64dbg called Scylla. To use this, we'll go to Plugins > Scylla. Opening it will automatically fill out some information. All we need to do is click IAT AutoSearch, which will automatically search for the import address table, and should successfully locate it. After the IAT is located, click Get Imports to build the IAT for the binary:
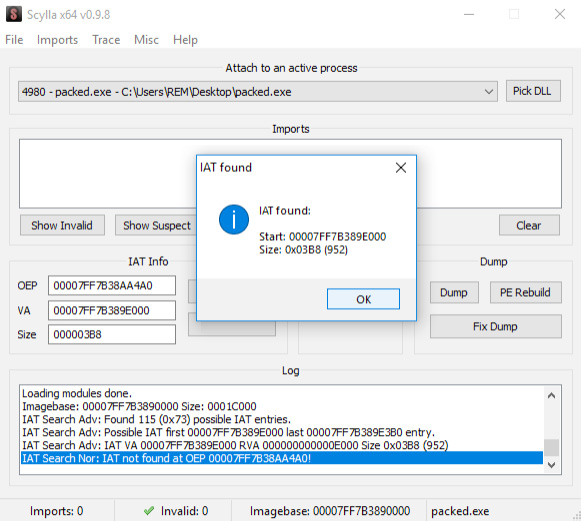
Figure 7.16 – Searching for the IAT with Scylla
Once we've done this, we can click Dump to dump the binary contents to disk:
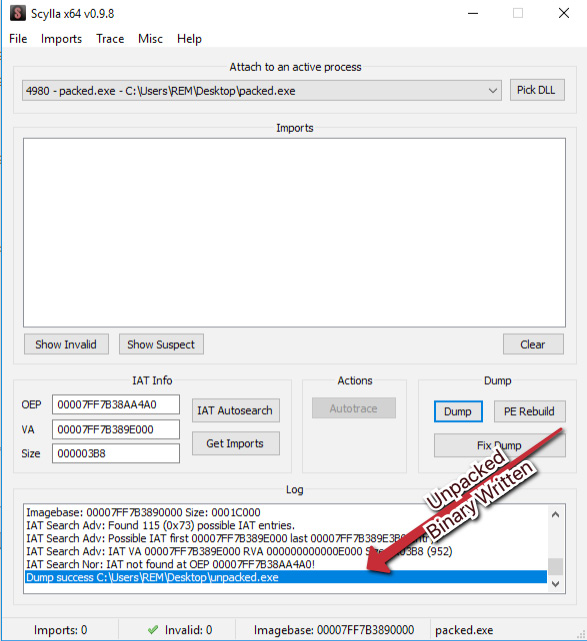
Figure 7.17 – Writing the unpacked binary to disk with Scylla
We have now written the unpacked binary to disk, and can validate that the binary is unpacked utilizing previously covered methods of checking the entropy of the binary utilizing tools such as DetectItEasy:

Figure 7.18 – Checking our work by utilizing DetectItEasy's entropy tool
As we can see, the entropy here is significantly low, and DetectItEasy does not appear to believe that the sample is packed. Based on what we know and what we have done, it is safe to assume that we have successfully unpacked the binary!
Challenge
Utilizing the malware sample pack provided for this chapter, attempt to answer the following questions:
- Is the sample packed? If so, with what packer?
- Were you able to unpack the sample? What is the SHA256 of the unpacked sample?
- What DLLs/libraries exist within the IAT?
- What APIs are referenced that you would deem suspicious or possibly related to anti-analysis techniques, if any?
Summary
In this chapter, we've discussed several fairly complex ideas revolving around the dynamic and hybrid analysis of malware, ranging from understanding API calls that malware may utilize to further its ends, avoid analysis, and generally wreak havoc within our environment, to how malware may utilize commercial and custom packers to attempt to obfuscate their true nature or make analysis more difficult.
We've also discovered how we may leverage this knowledge and defeat these mechanisms with tools such as x32 and x64dbg, as well as plugins such as Scylla, and tools such as the NSA's Ghidra. While these are complex topics, they become far easier the more they are practiced – the more time you spend in Ghidra or a debugger, the more comfortable the tools become, regardless of the relative complexity of the ideas surrounding them.
In the next chapters, we'll take a few steps back from the technical complexity and focus on easier-to-understand and practice reporting and attack-mapping methodologies.