
During execution, SOA Suite collects statistics on the number of messages received in a time period, the number of faults, and the execution time for the composites. These statistics are available through the EM console and provide a real-time updating view of the performance of SOA Suite. In this recipe, we will see how to monitor these statistics in real time by monitoring the number of messages processed by the SOA infrastructure over the last 5 minutes.
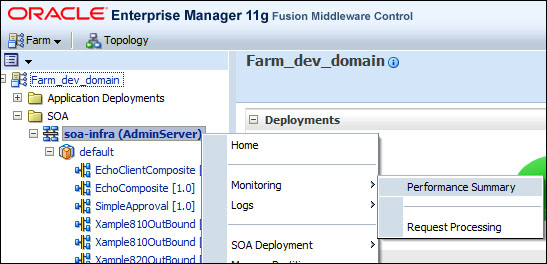
- From Enterprise Manager, right-click on the soa-infra element in the tree and choose Monitoring | Performance Summary in the pop-up menu.
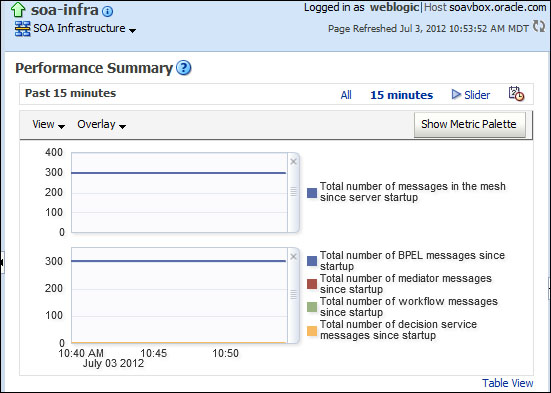
This brings up the Performance Summary screen that initially shows the total number of messages processed since the server startup.
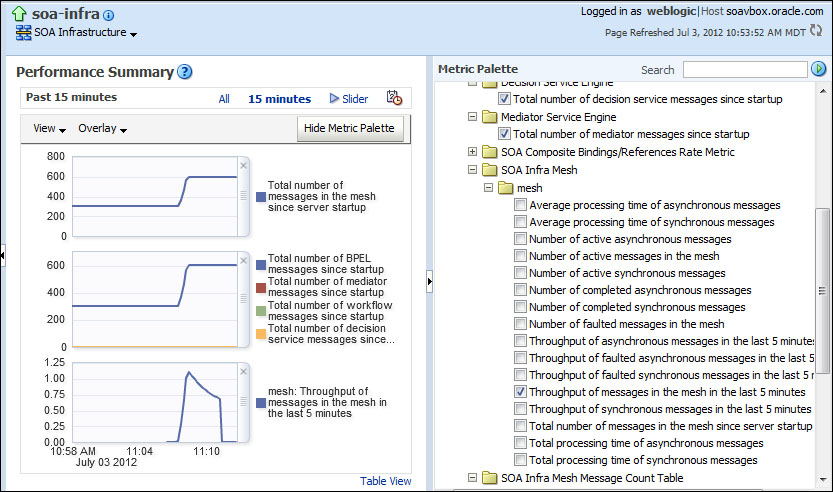
- On the Performance Summary screen, click on the Show Metric Palette button in the upper-right corner to bring up a list of available metrics.
- Navigate the tree to SOA Infra Mesh | mesh and select Throughput of messages in the mesh in the last 5 minutes. This will add a throughput chart to the Performance Summary screen. Throughput is measured by messages per second.
The Performance Summary screen is continuously updated with the metrics requested by the observer. Unfortunately, it is not possible to save a list of metrics to monitor for later use; they must be added each time the user logs in to Enterprise Manager.
The Performance Summary screen normally has a 15-minute window. However, it is possible to use the slider to zoom in on a smaller window within the last 15 minutes. To do this, click on the Slider link in the Performance Summary pane and adjust the slider to show the desired time range.
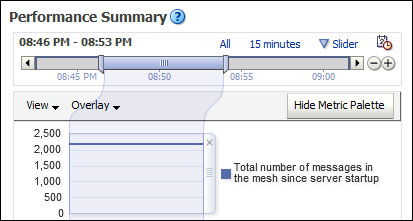
The time period can be set to 15 minutes by clicking on the 15 minutes link, or it can be reset to all metrics since monitoring started by clicking on the All link.
Metrics are split into different types, such as:
- Metrics that provide a number that starts when the SOA infrastructure is started, such as:
- The total processing time of synchronous messages
- The average processing time of asynchronous messages
- The total number of mediator messages since startup
- Metrics that provide a point-in-time view, such as:
- The number of active messages in the mesh
- The number of active trading partners (a B2B metric)
- Metrics that cover the last 5 minutes, such as:
- The throughput of asynchronous messages in the last 5 minutes
- The throughput of faulted requests in the last 5 minutes
Metrics come from different sources, and the source is represented by its position in the metric tree. For example, B2B metrics can be found under the nodes in Metric Palette that start with B2B.
In addition to core SOA infrastructure (mesh) and service engines (BPEL, Mediator, rules, and so on), metrics are also collected for specific service and reference interfaces, allowing the monitoring of input requests and external calls.