Starting with WebLogic Server 12c, there is a feature that enables us to monitor several aspects of a running domain, including its clusters, server instances, applications, and data sources, without resorting to the administration console or management scripts.
Tip
For a full list of resources that can be monitored through RESTful management services, check the documentation at http://docs.oracle.com/cd/E24329_01/web.1211/e26722/toc.htm.
WebLogic Server provides an address that can be queried to get information about specific components. The general format of this URL is http(s)://[host]:[port]/management/tenant-monitoring/[path] where:
- If the server is configured to enforce SSL communication, you must use
httpsto access the service - The
hostandportvalues must point to the host and port where the administration server is running - The
pathparameter will tell WebLogic which kind of resource you want to monitor, and also name a specific resource, such asservers/AdminServeror onlyserversto list all servers available
To enable the service, open the administration console and perform the following steps:
- Go to the navigation tree—the Domain Structure box—and then click on the domain name, tickets.
- Click on the Configuration tab, and then click on General.
- Scroll down to show the Advanced link, and then click on it.
- Scroll down to the end of the page and locate the Enable RESTful Management Services entry.
- Click on its checkbox, and then click on Save.
- The page will be reloaded, and a message stating that the server must be restarted will be presented.
- Click on the Control tab on the same page, click on the checkbox right next to the AdminServer entry, and then click on Shutdown and Force Shutdown Now from the pop-up menu, or just go to Eclipse's Server view and command a restart from there.
With the server running again, we can proceed and test the management services.
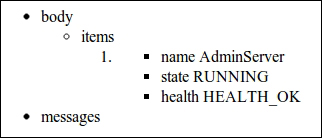
When you first access the URL, the server asks for a user credential. This user must belong to either the Administrators or the Monitors group to get proper access. Type http://localhost:7001/management/tenant-monitoring/servers in a new browser window and enter the appropriate credentials. A page with the following content will be presented:
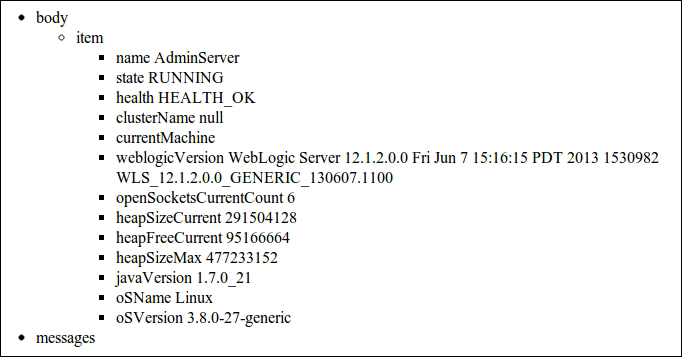
This command lists all servers of the domain. If you want to see details about a specific server, just add a slash at the end of the URL and type the name of the instance you want to check— for example, http://localhost:7001/management/tenant-monitoring/servers/AdminServer. The resulting page will show the basic information already presented—name, state, and health, along with several other entries.
As you may have noticed, there are two ways of querying the management service—by a collection and by a specific item. The collection view is a condensed one, showing all available objects of that specific kind, for instance, servers.
Here's a list of all currently available resources—collections and items that can be monitored:
/servers/server/[server name]/clusters/cluster[cluster name]/applications/application/[application name]/datasources/datasource/[data source name]
Each resource query returns a specific set of information. For instance, a query to a named data source returns this set of live data, among others:
activeConnectionsCurrentCountcurrCapacitynumAvailablenumUnavailableprepStmtCacheAccessCountprepStmtCacheCurrentSizeprepStmtCacheHitCountprepStmtCacheMissCountwaitingForConnectionCurrentCountxconnectionsTotalCount
Check the official documentation at http://docs.oracle.com/middleware/1212/wls/RESTS/index.html to get a complete list of item attributes and their meaning.
Hopefully, in the future, the development team will add more resources to this list, JMS being the most missed of them.
As this feature is enabled by Jersey, the JAX-RS reference implementation, the output can be generated as plain HTML—the format we used here is JSON or XML. To receive the response as JSON or XML, you must set the Accept header to application/json or application/xml respectively.
You can't change this flag using the standard features of a browser, so if you don't use a plugin like Tamper Data for Firefox or Request Maker for Google Chrome, you may want to know that WebLogic provides a web client that allows us to test these other formats in an easy way. To use it, just point your browser to http://localhost:7001/management/ajaxtest.html.
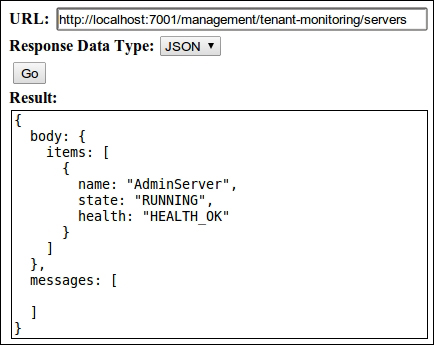
The host and port must point to the administration server of the domain, as we are already using it to access the RESTful management services.
You just need to enter the query's URL, as you did before, and select the appropriate response data type. Here's how the same query would look like using the Ajax client to retrieve a JSON structure: