
The following steps can be performed to check the SQL Apply service status:
- Use the following query on the logical standby database, to check the general SQL Apply status:
SQL> SELECT * FROM V$LOGSTDBY_STATE;

   PRIMARY_DBID SESSION_ID REALTIME_APPLY  STATE
--------------- ---------- --------------- ---------------
     1319333016          1 Y               APPLYING
At the
STATEcolumn, we can seeINITIALIZING,WAITING FOR DICTIONARY LOGS,LOADING DICTIONARY,WAITING ON GAP,APPLYING, andIDLEvalues, which describe the status of the SQL Apply clearly with their names. - The
DBA_LOGSTDBY_LOGview, that we have queried in the Checking the Redo Transport Service Status action, will be very helpful to find the last applied archived log sequence and to check if there are archived log sequences that were received but not applied. Another viewV$LOGSTDBY_PROCESSis helpful to control the status of the processes responsible for SQL Apply.SQL> SELECT TYPE, STATUS_CODE, STATUS FROM V$LOGSTDBY_PROCESS; TYPE STATUS_CODE STATUS ------------ ----------- ---------------------------------------- COORDINATOR 16116 ORA-16116: no work available ANALYZER 16116 ORA-16116: no work available APPLIER 16123 ORA-16123: transaction 11 22 786 is waiting for commit approval APPLIER 16117 ORA-16117: processing APPLIER 16117 ORA-16117: processing APPLIER 16117 ORA-16117: processing APPLIER 16123 ORA-16123: transaction 11 25 786 is waiting for commit approval READER 16127 ORA-16127: stalled waiting for additional transactions to be applied BUILDER 16116 ORA-16116: no work available PREPARER 16117 ORA-16117: processing
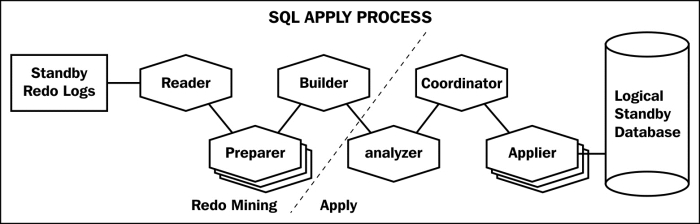
Output shows all the processes in the SQL Apply and their status. The READER, PREPARER, and BUILDER processes are responsible for the mining of the redo. On the other side, COORDINATOR, ANALYZER, and APPLIER processes work together to apply the changes to the database. We can see that the READER process is waiting for the transactions to be applied, so that memory will become available and it will read more redo. On the other side, some APPLIER processes apply redo and some wait for commit approval to continue applying redo as shown in the following diagram:
We have seen several queries to gather information about the logical standby configuration. We have verified that the newly created logical standby is synchronized with the primary and everything works fine.
Redo transport and SQL Apply, which are the two main services of logical standby, can be monitored at any time using the mentioned methods.
Now stop the listener on the logical standby site and run some operation on the primary database. New archived logs will be created but primary would not send these logs to standby. This will cause a gap between primary and standby. In the case of a gap, query redo transport and SQL Apply services with the same queries. Start the listener and continue checking the status.