
Most often, to look up the variables' values in the debugging mode, it is enough to resort to the Watch List and Locals possibilities. For more complex tasks, we can use the Evaluate window.
Create the following function:
function testEvaluate()
{
  var pEx = Sys.Process("explorer");
  Log.Message("");
}
and set the breakpoint on the second line of the function (set the cursor on this line and press F9).
To get acquainted with the possibilities of the Evaluate window, we will need to implement the following actions:
- Launch the created
testEvaluatefunction. Its execution will be stopped and TestComplete will switch to the debugging mode. - Navigate to Debug | Evaluate or press the following combination of keys: Ctrl + F12. In the result, the Evaluate window will appear on the screen.
- Input
pExinto the Expression field and click on the Evaluate button. In the result, the Result field will get the current value of thepExvariable ([Object]) inputted.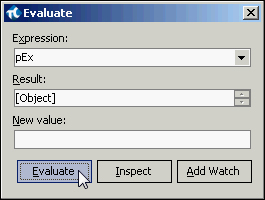
- If we click on the Inspect button, the screen would have the Inspect window displayed, which is analogous to that of Object Browser, where all the properties and methods are viewable.
- Close the Inspect window and input the
"string value"string (by all means, with the quotation marks!) into the New value field and press Enter.In the result, the string value line will show up in the Result field. Now, the
pExvariable contains a new value.
The Evaluate window extends wider possibilities of working with various expressions as compared to that of the Watch List list:
- The first major difference consists in the possibility of assigning the variables with the new values, while the variables' types can be altogether different (for example, in our case, the variable of
pExfirst contained the object, and then the line). - The second difference consists in the Inspect window. In this sense, it resembles Object Browser; however, we can use it to look up not only the sibling objects of the
Syselement, but rather any other objects as well. For example, it is possible to enter theBuiltInvalue into the Expression field and look up all the properties and methods of theBuiltInobject, which are extended by TestComplete.
Also, from the Evaluate window, one can add a current expression to the Watch List list (with the help of Add Watch) for further tracking.