
Courage is knowing what not to fear.
—Plato (427 BC–347 BC)
Greek philosopher
Strategy to Professional Status: Part II
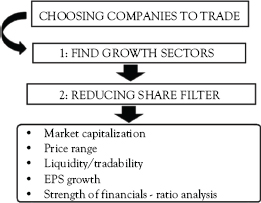
Aim of step 2: The work begins. You have established a portfolio strategy. This now needs to be honed in on what companies to trade.
Embarrassment of the Novice
There I was standing in front of the entire stockbroking firm’s elite. The directors were there and so were portfolio managers, traders, arbitrageurs, corporate finance and commodity and bond traders. In fact, I lost count at 30 members of this particular very large stockbroking firm.
It was the morning meeting, and it was my turn to stand up and tell everybody what equities I thought they should be investing and trading in. This was my first morning meeting and a test of endurance, but also an opportunity to make an early impression as an industrial analyst.
The boardroom was large, extremely ornate in dark wood and black leather. It is easy to get intimidated when you are young. I had my list of shares to recommend to the crowd—now starting to crowd me in. I stood up, said a quick “morning everyone” and introduced myself. I started with a market overview, a detailed analysis of companies’ results released the day before—I had been up until 2:00 in the morning preparing for that meeting.
I had only 15 min allocated to me, but I did manage to get through the detailed analysis clearly and to the point. There were a few questions and then a silence seemed to fill the room. I supposed it could have freaked me out, but thankfully, it did not.
Then, a trader lifted his hand and asked the question that boiled all the research down to a single bullet point: “What do you expect the price to do today?”
There was no interest in the analysis or how the stock related to its peers or the overall market. It was a simple question, but one that highlighted that this was a money game, not an analytical one. Who cares if you spent two weeks in in-depth analysis or that your computer model is so complex and sophisticated that you had to have it trademarked.
The only interest was: what would the company do today? My allocated time was over and the next analyst stood up and started to outline mining results, which I thankfully used as a cue to sit down.
The True Issue: Be Prepared
The lesson was well learned. The art of being successful in stockbroking is to prioritize, whether it is analysis of corporate results or technical analysis. Be protective and selfish with your time; ensure that you have all the elements in place to make quick and decisive trading or investment decisions. Nobody cares how you come to your decisions. It is, therefore, up to you to become proficient as a trader.
However, this does not mean that carelessness can become the order of the day. Instead, it directs you to develop a system that you can rely on to use continuously to enable you to make constant profits.
How you do that should be your secret.
So, where do you start in your establishment of Part II? In the previous chapters, Part I outlined the portfolio strategy, which is not in isolation to Part II. Remember that each step in the process outlined in this volume for you to become a successful trader is inextricably linked to other steps.
As such, a strategy to identify companies to trade (Part II) must be in sync with your personally defined portfolio approach. This chapter sets out two linked methods to choosing stocks. Understand that these methods are meant as filters to select many stocks and then to remove those that do not meet your trading or investment criteria. There may be stocks that you wish to add to your watch list, which have been eliminated by the filter—that is your prerogative.
Where should you start? I believe that a good place to commence is with a company search and a scan of general market conditions. The decision process in trading any market should always include a top-down logic, which essentially means scanning the global economic and market arena, honing that down to the region and then the country in which you wish to trade. This macro-economic search is then filtered down to micro-economic conditions, which includes company analysis.
• Macro-economic conditions: These involve analysis of the whole economy and includes the total amount of goods and services produced, income earned, level of employment of productive resources, and general behavior of prices.
• Micro-economic conditions: These involve analysis of individual consumers, firms, and industries in relation to distribution of the total production and income.
The variables you select to enable you to ultimately filter down hundreds of companies to a reasonable few are entirely subjective, and admittedly, no single approach is wrong or right. For instance, there are traders who will only buy an exchange’s blue-chip stocks or mining shares or higher-risk so-called penny stocks. That is their filter. What I am proposing is a filter to enable you to choose shares from the entire spectrum of companies listed on any stock exchange.
Finding interesting patterns to some traders is the same as to finding enlightenment. For some, an interesting pattern may be a share at a high level or a break in a resistance peak. For others, it may be the shape of a set of candles. Once selection of the trading instrument has occurred, determining the entry and exit points is the logical next step. The resulting trade can be a win, a loss, or a break-even. At any period of time, the trader needs to be able to assess the total performance and identify strengths and weaknesses that occurred.
Note that the following proposed filter is aimed at reducing the vast number of investments and trading potential to a select few. It is my recommendation that traders use the following filter to hone down to those few stocks and then to implement their personal filters.
Aim of filters: To reduce the emotive element when choosing companies to trade.
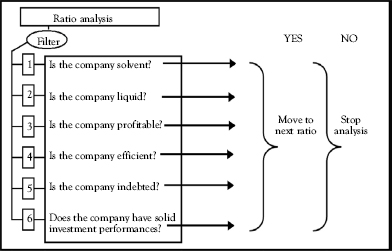
A filter is a cold factual tool that ignores the host of conflicting forecasts, bullish or bearish fever. In addition, many professional traders say that developing and implementing a filter is equal to having a plan, which is better than novice traders who simply throw themselves into the market armed with a few “well-chosen” technical indicators. The preceding table is an example of a basic and quick-to-implement filter. All you have to do is tick off the yes or no answers. If your answers equal more No than Yes, then you do not buy the stock. Conversely, if there are more Yes answers than No, then you buy the stock. At least, the filter identifies stocks that should be further analyzed.
Therefore, traders are not asked or advised to ignore events that take place in the market, such as strike action hampering share prices or natural disasters influencing corporate action. It is suggested that a filter incorporate such events as an additional plan and not be the sole means of trading.
The main thrust of the proposed macro-filter is to identify sectors or indices that are showing high growth potential when compared with other indices. Why would a trader want to trade or invest in property companies if the sector is telling him or her that the market is sluggish, or in a downward motion?
The aim is, therefore, to first select sectors by identifying indices that are showing positive growth.
The question that must be asked, therefore, is where are the professional investors and traders buying? Will such trading, as a combined number, surely reflect in a growth in the overall sector? How do we find what traders’ sentiment is toward shares?
The answer is to identify sectors that are growing by looking at volume growth in the indices. The secret is that not all companies listed in a sector form part of the index. So, we are immediately eliminating smaller, and thus, higher-risk shares within sectors by choosing indices. The first filter is, therefore, to identify which indices have the highest volume growth.
Volume-Based Technical Analysis
Sentiment indicators are not easy to employ, as they tends to be developed for specific purposes by the global stockbroking firms. The essence of such indicators is to quantify the levels of optimism or pessimism present in various sectors or overall markets. Consequently, I found a number of indicators that can be used to highlight investor sentiment, and thus index growth.
These include economic variables (money flow and supply and demand balances) and technical indicators (Chaikin Money Flow). I prefer more simplistic volume-related indicators, which highlight three main factors that traders must assess:
• Money flow identifier.
• Volume of net trades.
• Volume surge identifier.
• Money flow identifier: This is used to identify whether there are more buyers than sellers entering a security’s position.
![]() SBV Oscillator and Money Flow Index (MFI) are used to define:
SBV Oscillator and Money Flow Index (MFI) are used to define:
![]() Positive (bullish) money flows.
Positive (bullish) money flows.
![]() Negative (bearish) money flows.
Negative (bearish) money flows.
![]() MFI: This is a momentum indicator that takes volume and high, low, and close prices into the calculation.
MFI: This is a momentum indicator that takes volume and high, low, and close prices into the calculation.

![]() It gives traders a sense of the strength of the traded volume.
It gives traders a sense of the strength of the traded volume.
![]() A better definition: Look at this indicator and the price will move in the opposite direction.
A better definition: Look at this indicator and the price will move in the opposite direction.
![]() Therefore, if the MFI is down (A–B), money is entering the share and the share rises (C–D).
Therefore, if the MFI is down (A–B), money is entering the share and the share rises (C–D).
![]() Alternatively, if the MFI is up (E–F), money is leaving the share and the share falls (G–H).
Alternatively, if the MFI is up (E–F), money is leaving the share and the share falls (G–H).
• Volume of net trades: Bullish and bearish volume accumulation can also be assessed by analyzing volume.
![]() Volume of net trades, also called bearish and bullish volume accumulations, is used to assess how strongly net buyers over sellers are influencing a stock, index, or overall market.
Volume of net trades, also called bearish and bullish volume accumulations, is used to assess how strongly net buyers over sellers are influencing a stock, index, or overall market.
![]() Examples: SBV Oscillator and Volume Accumulation Oscillator (VAO).
Examples: SBV Oscillator and Volume Accumulation Oscillator (VAO).
• Volume surge identifier: When sectors are dominated by institutions or large organizations, volume surges are extremely critical, as they can highlight or signal major institutional trader actions.
Indices: Three Identifying Trend Indicators
Indicator 1: The Advance-Decline Line
Indicator 1 |
|
Name |
The advance-decline line |
Type of indicator |
A market breadth indicator |
Calculation |
Daily or weekly data |
Aim |
Define general market action |
Trader perspective |
Watch for divergences |
If the overall index of an exchange and Indicator 1 are moving in the same direction, traders can assume that the current trend will continue. However, if the index does achieve a new high or low without a corresponding move by Indicator 1, a warning trigger is issued.
The reason for advocating Indicator 1 is that traders can calculate and draw their own chart. All you have to do is calculate the net difference between increases and declines, and then adding the net amount to an index, which you make up. For example, if you decide on an index number of 1,000 and the net difference between buyers and sellers today is a number of 10 (buyers are 90 and sellers 80 = 10), then your index has risen to 110. Continue to do that daily and quickly you establish your own Indicator 1.
Indicator 2: Upside-Downside Volume Ratio
Indicator 2 |
|
Name |
Upside-downside volume ratio. |
Type of indicator |
Market breadth indicator. |
Calculation |
Divide volume of increasing issues by volume of declining issues. Daily or weekly data is used. |
Aim |
Determine overbought/oversold positions. |
Trader perspective |
The indicator provides traders with an understanding as to whether a stock has momentum. |
The Share Filter
The following may seem too simplistic. However, the aim is to move rapidly through a host of companies to see which you have picked to conduct proper analysis and technical assessments, as set out in the following chapters.
The way that traders can do this is via a filter to set the parameters according to their specific strategies. This includes market cap, price range, liquidity or tradability, earnings growth, and strength of financials—ratio analysis.
Market Cap
• Decide on the size of company you wish to invest in. Remember that the larger the company is, the less the risk associated to trading that stock.
• The size of the company (in dollar terms) is calculated by multiplying the number of shares in issue with the company’s share price. This is called the company’s market capitalization.
• If you choose a figure that is too high, you will have too few companies to select. The aim is to look at companies within a market cap range. For example, Trader A wishes to select companies with a market cap of between US$500 million and US$1 billion.
• If you move your parameter up, the companies become larger and less risky.
• If you move the parameter down, the companies become smaller and more risky.
Share Price
• Now that you have selected a range of companies according to market cap, you need to decide how much you are willing to spend per share. This means that, if you want to buy shares in US$100,000 lots and you want 10 shares in your portfolio, you will need US$1 million to trade.
• If you do not have that amount of cash, reduce the amount of cash you wish to spend per share. This enables you to reduce the selected shares by looking at price per share.
• At this point, you have not even looked at the strength of the company.
• There is no point in selecting companies to trade if these have no shares to trade.
• Traders suggest that the average number of shares that needs to be traded per week is at least 400,000. Some say that this figure should be per day.
• If there is no tradability, buying the share may be easy, but getting out is often impossible.
Earnings Growth
• Always buy shares in companies that have positive earnings per share growth.
• Decide on the growth (in percentage terms) that will make you feel comfortable and filter out shares that do not meet that criterion.
• The norm is to immediately eliminate all shares that will show growth that is less than the money market rate. This rate is also called the risk-free rate. For instance, if you can invest your money in the money market at 4 percent a year interest, why would you invest in shares that have less growth?
Now: you have selected shares from growth indices. You have filtered these down according to your risk profile (size of company), then you looked at the price of the company and removed those companies that are too expensive. After that, you eliminated illiquid stocks and those that have low profit rates.
Now comes the section that is a little more difficult, but remember that you have reduced every 100 shares down to a possible six shares. This is the rate at which your filter should work and you are yet to conduct any analysis.
Step 5 is the use of ratios to eliminate—or determine strength—of the remaining stocks in your filter.
Strength of Financials: Ratio Analysis
• I have a computerized system to conduct ratio analysis rapidly; send me a request on [email protected] for a copy.
• Get hold of a company’s annual results, either the hard copy or the electronic version. All companies have websites from which you can access annual reports.
• The following filter is simple. If a company’s ratios do not meet industry norms, stop the analysis.
• These norms do differ between industries. If you want a copy of current industry norms, contact me on [email protected].
Area |
Ratios used |
Solvency |
General solvency check |
Liquidity |
Current asset ratio Quick ratio (acid test) Stock to working capital ratio Defensive interval ratio |
Profitability |
Profit margins Return on shareholders’ equity Return on net assets Return on capital employed |
Efficiency |
Stock turn Accounts receivable days Accounts payable days |
Gearing |
Debt:equity (gearing) Proportional debt ratio Ordinary shareholders’ interest Long-term debt to capital employed Interest cover Gross cash flow to total debt ratio |
Earnings per share Dividend per share Dividend cover Earnings yield Dividend yield Price to earnings ratio |
The mathematics behind the aforementioned ratios is set out hereunder:
Solvency Check
Ratio |
||
1 |
General solvency check = |
[(Fixed assets + investments + current assets) ÷ (Long term loans + current liabilities)] × 100 |
This is a broad indicator to assess how many times total assets cover total liabilities. A ratio of less than 2:1 is a warning that there could be serious problems with the company’s financial strength.
If the ratio is displaying such tendencies, look at the company for break-up value; buy certainly not as a long-term portfolio asset. However, a problem could arise if the solvency ratio is taken at face value. It could create a totally incorrect impression. If the company recently started operation or if it had to pay a substantial sum for an acquisition—which is perceived to have solid long-term prospects—the solvency ratio would be low. It is up to the investor to determine whether the ratio represented the true state of the company or not.
Liquidity Ratios
Ratios |
||
1 |
Current asset ratio |
= Current assets ÷ current liabilities |
2 |
Quick ratio (acid test) |
= (Current assets − stock) ÷ current liabilities |
3 |
Stock to working capital ratio |
= (Stock ÷ net current assets) × 100 |
4 |
Defensive interval ratio |
= Defensive assets ÷ projected daily operating expenses |
These ratios are a solid test to determine whether a company will meet its financial commitments on time. There are two major categories of liquidity ratios, namely, ratios to determine the overall position of the firm and those that help assess the liquidity of specific assets. The latter are also called activity ratios. The following ratios, therefore, concentrate on how to calculate the overall measure of a firm’s liquidity.
Current asset ratio: This easy-to-apply ratio is used to calculate a company’s short-term financial position by using current assets and liabilities. If the ratio is high, it indicates that the firm’s current assets cover current liabilities (at least 1.5:1) and that it is able to pay short-term debt with relative ease. The popular observation is to assume that, if the ratio is low, the company is without doubt unable to finance its day-to-day operations and could, therefore, be placed under liquidation at any time. While this is often the case, there are exceptions, for example, “accounts receivable” includes debtors. In a recessionary climate, can it be taken for granted that debtors will pay?
In addition, part of current liabilities includes bank overdraft, which has become an essential part of a firm’s debt funding program, and therefore, the current asset ratio plays a less significant role today.
Quick ratio (acid test): Although similar to the current asset ratio, it excludes stock, as this item is the least liquid asset under current assets. It, thus, provides a better measure of a firm’s liquidity. Some analysts believe that, in addition to excluding stock, the debtors’ book should be assessed to determine the reliability of future payment, that is, a divisional analysis of the quality of debtors should be carried out.
However, very few (if any) annual reports provide such information, and company directors are unlikely to divulge this type of detail. The assumption is, therefore, that this is a more accurate measure of liquidity than the current asset ratio.
Stock to working capital ratio: Another means to assessing liquidity is to do the opposite to the acid-test ratio. Instead of subtracting the stock item from current assets, this formula uses stock to determine a company’s liquidity position.
In the acid-test ratio, the assumption is that, because stock is the most illiquid current asset, it should be removed from a calculation to determine a firm’s liquid position. In using the stock to working capital ratio, the investor is able to confirm the acid-test ratio. Stock is divided by working capital, which is current assets less current liabilities, and the higher the ratio, the more illiquid the firm is.
Defensive interval ratio: This is not a well-known ratio, but is of significant importance. It shows the number of days in which a company can continue to operate without using cash flow generated from operations. It is a difficult ratio, to use as the variables involved are not displayed in the financial statements of listed companies. It can, however, be used by businessmen in the computation of their own finances, especially where the business is operated as a sole proprietor, closed corporation, or private company.
The variables involved in this ratio include:
Defensive assets |
= |
Cash + marketable securities # + accounts receivable |
Projected daily operating expenditures |
= |
Cost of goods sold + expenses*) ÷ 365 |
• # Any security that can be traded through an exchange, namely, shares, bonds, futures, options, and even Kruger Rands.
• Selling, delivery, and administration expenses (less depreciation).
Profitability Ratios
Ratios |
||
1 |
Profit margins |
= (Any profit figure ÷ turnover) × 100 |
2 |
Return on shareholders’ equity |
= (Attributable profits ÷ shareholders’ funds) × 100 |
3 |
Return on net assets |
= (Attributable profits ÷ net assets) × 100 |
4 |
Return on capital employed |
= (Operating income × capital employed) × 100 |
Profit margins: Any profit figure can be used to determine efficiency of operations.
For instance, if the operating profit figure is used, the ratio would indicate the level of productivity within a firm. The higher the ratio, the more profitable the firm is. If the ratio has been improving over a number of years, it could indicate improved work methods, reducing costs per sale, gaining market share, better internal controls over stock and expenses.
Return on shareholders’ equity (ROSE): This is a measure of a company’s profit in relation to the shareholders’ investment in that company, that is, ordinary shareholders’ funds. The use of attributable profit as a numerator in the equation indicates that the higher the profits achieved (after interest and tax), the higher the ratio will be. An exception would arise if the firm’s equity base (the denominator in the equation) was increased through a share issue. This would distort the ratio. This ratio is preferred by shareholders, as it excludes preference share capital, loans, and minority interests.
Return on net assets (RONA): It is also a measure of profits, but relates to total investment rather than only ordinary equity. This ratio is preferred by portfolio managers, as it indicates profit per net company asset. It is often used as a target setting for managers, who have to improve profits relative to its existing asset base.
Return on capital employed (ROCE): This ratio accounts for the total capital employed, rather than only ordinary shareholders’ funds. It indicates the profitability of the company in its use of all available funds, including borrowings. Unlike ROSE, this ratio is expected to be less likely to rise. This is due to companies being expected to increase borrowings over time, while ordinary share issues are not an annual occurrence.
If ROCE is increasing, investors are being warned that the level of borrowings is eating into profits attributable to ordinary shareholders. Ultimately, investors will receive less dividends.
Efficiency Ratios
Ratios |
||
1 |
Stock turn |
= Group turnover ÷ average stock |
2 |
Accounts receivable days |
= Accounts receivable ÷ (turnover ÷ 365) |
3 |
Accounts payable days |
= Accounts payable ÷ (turnover ÷ 365) |
Stock turn: The ratio is used to determine whether management is efficient in its control of particular current assets. Generally, the stock turn ratio reveals the ability of management to buy inventory that will sell and not rapidly become outdated. It also shows management’s inability to control different lines of stock.
However, it is imperative to look at trends over a number of years. The reason is that, an increase in the ratio may not mean that the problem is one limited to only a particular firm, but could be an industry trend, that is, sales falling off generally. Other reasons for a sudden increase in the ratio could be an isolated case, such as the introduction of a new export law that delays shipment of goods. Average stock is used to calculate this ratio and is computed by adding the previous year’s closing stock (which is this year’s opening stock figure), to the present year’s closing stock. This is then divided by two.
An example shows investors how to use this ratio:
• The turnover and current asset figures which appear in XYZ Company Ltd.’s income statement and balance sheet for the years 2015 and 2016:
R’000 |
2015 |
2016 |
Turnover |
50,000 |
60,000 |
Current assets: stock |
10,000 |
12,000 |
Calculation of ratio:
Ratio 1 |
Stock turn |
60,000 ÷ [(10,000 + 12,000) ÷ 2] = 5.5 times |
Ratio 2 |
Stock turn expressed in months |
12 ÷ 5.5 = 2.18 months |
The investor is able to assess that XYZ Company Ltd. sells entire stock on hand 5.5 times a year. Or, expressed in terms of months, it takes a fraction over two months to sell all stock on hand.
Accounts receivable days: The first step is to determine daily sales, which is achieved by dividing the company’s turnover figure by the number of days in the year (365), even if the firm does not operate every day of the year.
The accounts receivable figure, which is listed in the balance sheet, under current assets, is divided by the subdivided turnover figure. The answer is in days, and the higher the number, the longer it takes a company to collect its debt. Accounts receivable is an asset and liquidity can, thus, be impaired if debtors cannot be collected. The quality of a company’s debtor’s book is also important, but cannot be directly assessed.
One method that could be used to assess the possibility of debtors not paying their accounts is to investigate the growth in a firm’s bad debts. If this has been growing over a number of years, it can be determined that a company has an inadequate screening policy, and that bad debts are likely to continue growing.
Alternatively, if the level of bad debts incurred is diminishing, it is indicative that stricter policies are being administered.
Accounts payable days: This figure is obtained from the balance sheet, under current liabilities. It is calculated in the same manner as account receivable days. In this instance, the higher the number of days, the longer it takes the firm to pay its debts. The ideal is for a company to collect its debts at a quicker rate than it is paying creditors. This would release some pressure on cash flows and also assist in improving liquidity.
Gearing Ratios
Ratios |
||
1 |
Debt:equity (gearing) |
= [(long and short term loans + overdraft − cash) ÷ Ordinary shareholders’ funds] × 100 |
2 |
Proportional debt ratio |
= Long-term loans ÷ total assets |
3 |
Ordinary shareholders’ interest |
= ( Ordinary shareholders’ funds ÷ loans) × 100 |
4 |
Long-term debt to capital employed |
= (Long-term loans ÷ capital employed) × 100 |
5 |
Interest cover |
= Attributable income ÷ interest paid |
6 |
Gross cash flow to total debt ratio |
= [Gross cash flow (prior dividends) ÷ loan] × 100 |
The extent to which loans are used to finance company assets is calculated by using gearing ratios.
Debt:equity (gearing): The comparison of debt, made up of loans and overdraft, to equity (ordinary shareholders’ funds) is a popular method of measuring the level of debt in a company. The figures are obtained from a company’s balance sheet, and a number of ratio combinations can be used to highlight the extent to which assets are financed by loans.
These include the subtraction of cash on hand from total debt before dividing by ordinary shareholders’ funds. The reasoning is that cash-on-hand could be used to reduce loans. Note that the greater the proportion of borrowed funds to company assets, the higher the financial risk to lenders, and ultimately, to shareholders.
Proportional debt ratio: Sometimes, it is important to determine the proportion of the firm’s long-to-short-term loans. The necessity would arise in cases where a company has a high debt: equity ratio, say 50 percent, but also a high liquidity ratio, of which substantial short-term loans form a part of current liabilities.
In such an instance, it is possible that debt:equity is misleading. If most of the total loan debt is short term—these would have to be repaid within the firm’s operating cycle—then a high debt:equity ratio should not represent a threat to the financial stability of the company.
The method used to determine the proportion of long-to-short-term debt is to start by calculating the debt ratio. This is computed by dividing total liabilities (long and current) by total assets.
Secondly, calculate the long-term debt ratio. This is done by dividing long-term debt by total assets. If the debt ratio is 50 percent and the long-term debt ratio 30 percent, it shows that the company has financed 30 percent of its assets with long-term debt and 20 percent with short-term debt.
Ordinary shareholders’ interest: This is used to measure the risk inherent within a company’s financial organization. It is simply the inverse calculation to the debt:equity ratio, and therefore, the higher the percentage, the lower the risk associated with buying that company’s share.
Long-term debt to capital employed: This ratio is of particular interest to borrowers of loans. When a company approaches potential new investors—for loan capital—the investors would be keen to know how much of the company’s capital structure (capital employed) is made up of loans and how much from issued share capital.
The rule is not to provide companies with loans if they are already heavily geared, unless the loan is for a particular project, which the investor deems will have a short pay-back period and will be cash-generating. The reason is simple, the higher the ratio, the weaker the financial structure.
Interest cover: Once again, the higher the ratio, the less a company is able to meet its interest bill.
This is calculated by dividing pre-interest profit by net interest paid. It shows the company’s ability to meet interest payments. A low cover would show that the company is not achieving enough operating profits to pay its loans, or that loans are growing at a rate that the company is unable to contain.
Gross cash flow to total debt ratio: This is the one critical ratio that links the income statement to the balance sheet. It shows—as a percentage—how much of cash generated by a firm is used to pay debt. For instance, if a company’s gross cash flow (before paying dividend) is US$6 million, while total loans (long and short term) equal US$12 million, then—using the formula set out in the table—50 percent of the company’s cash flow is used to pay debt.
Alternatively, the inverse shows that it would take the firm two years to pay off all its loans, if dividends were continually passed. The rule is—the higher the ratio, the weaker the financial structure and the less attractive the investment opportunity becomes.
Investment Performance Ratios
Ratios |
||
1 |
Earnings per share |
= (Attributable profit ÷ issued ords) × 100 |
2 |
Dividend per share |
= (Dividends payable ÷ issued ords) × 100 |
3 |
Dividend cover |
= Earnings per share ÷ dividend per share |
4 |
Earnings yield |
= (Earnings per share ÷ share price) × 100 |
5 |
Dividend yield |
= (Dividend per share ÷ share price) × 100 |
6 |
Price:earnings ratio |
= Inverse of earnings yield |
Earnings per share (EPS): EPS is an indication of the firm’s profitability expressed per share. It, thus, shows an investor how much profit each share he or she possesses has achieved over the past year. If EPS has been increasing over a number of years, investors can say that their investment has shown growth.
Dividend per share (DPS): DPS is the amount of money paid to shareholders (expressed in cents per share) for their investment in the company. This can occur twice a year, at the companies’ interim and annual financial year ends.
Dividend cover: A trend over several years will reveal interesting factors. If a cover is, for instance, two times, it means that, for every 10 cents earned per share, five cents is paid to shareholders. There are a number of possibilities, if EPS is constant, but cover changes:
• If cover is increasing, it usually indicates that less dividends are being paid and that more money is placed into non-distributable profits. Companies could do this to bolster reserves prior a takeover bid or to offset economic downswings, and so on.
• In the case where cover is decreasing, it means that directors have taken a policy to pay shareholders more relative to the firm’s earnings.
• Companies usually aim to maintain a constant cover.
However, if EPS has increased or decreased, but the firm pays the same DPS as the previous year, warning signals are set off for investors. Problems arise when EPS falls, but directors decide to maintain the previous year’s DPS. This means that reserves are being used to satisfy shareholders at the expense of the firm’s financial profile. If this trend is continued over a number of years, the firm can be expected to run into financial solvency and liquidity problems.
Earnings yield (EY): The company’s EPS expressed as a percentage of its share price. It reflects earnings relative to market sentiment, and thus reveals the return that an investor can expect if he or she buys shares. If EY is increasing, shareholders’ capital growth is improving, while a decline in EY would indicate that the net effect of EPS to share price is falling, and therefore, the investment becomes less attractive.
Dividend yield (DY): Similarly, DY is the ratio of the firm’s annual cash payment to shareholders to the company’s share price.
The importance of DY is centered on the principle that only a part of profits achieved is paid out to shareholders. This is a more accurate measure—compared to ROSE—of a shareholder’s return on investment.
Price:earnings ratio (P:E): This ratio reveals the length of time that it will take an investor to recoup the cost of his or her investment in terms of earnings. Therefore, the higher the ratio, the longer it will take for an investor to re-coup his or her original investment, and thus the more expensive the investment is. If P:E is 10 times, it indicates that—if an investor buys a share—it will take 10 years before the amount of EPS achieved by the company equals the share price.
The following example explains:
• In 2015, Company XYZ Ltd. achieved attributable profits of US$10 million.
• The issued share capital was 2 million ordinary shares.
• In that year, the share price traded between 15 cents and 22 cents.
• At the end of the financial year, the share price was 20 cents.
A. Calculation
1 EPS |
= |
Attributable profits |
÷ |
shares in issue |
|
= |
US$10,000,000 |
÷ |
2,000,000 |
|
= |
5 cents per share |
|
|
2 P:E |
= |
Share price |
÷ |
EPS |
|
= |
20 cents |
÷ |
5 cents |
|
= |
4 times |
|
|
B. Conclusion
It will take four years for XYZ company’s profits (in EPS terms) to equal the cost of purchasing the share (the investor’s capital outlay).
Testing for Market Volatility
The final step is to ask: if the market is stable enough to invest now, or should I wait? Bollinger bands are used to measure a market’s volatility, as this tool warns traders as to whether the market is sluggish or fast paced.
• Sluggish: bands contract
• Fast paced: bands expand
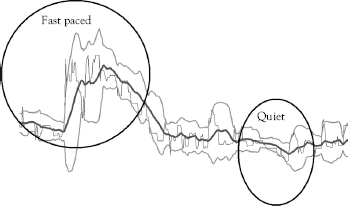
Invest when the market is fast and stay out when the market is slow!
Chapter 3 sets out how to calculate a fair value for a company’s share price.