
Not being able to govern events, I govern myself.
—Michel de Montaigne (1533–1592)
French philosopher
Strategy to Professional Status: Part IV—Phase 2
It is so easy to see patterns in graphs, even if they do not exist. Therefore, this chapter is dedicated to highlighting some essential charts that should assist traders to identify actual patterns and trends. The terms and jargons that are outlined in the following text are part of the excitement that novice traders expect in trading the markets.
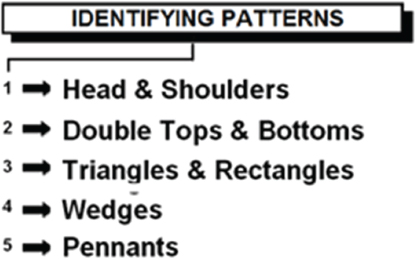
There are five basic and essential configurations that are pertinent to traders in today’s volatile investment environment.
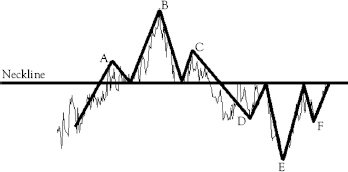
A head and shoulders pattern is formed by a peak (left shoulder and shown as A), followed by a higher peak (head and shown as B), and then another lower peak (right shoulder and shown as C). A neckline is drawn by connecting the lowest points of the two troughs. The slope of this line can either be up or down. Alternatively, a head and shoulder pattern can be displayed as D–E–F in the preceding graph.
• Traders trigger: When the slope is down, it produces a more reliable signal.
In the following example, traders can observe the head and shoulders pattern. As aforementioned, the head is the second peak and also the highest point in the pattern formation. The two shoulders should never be higher than the head. With this formation, traders should place their entry level just below the neckline. The strategy is twofold:
• Short positions: The entry level should be at your stop loss. If the neckline is at 200 cents, then your stop loss or entry point would be at 197 cents or 195 cents. The share will continue to fall as explained under the next heading.
• Long positions: Professional traders assess how far a share can fall by measuring the straight line from the high point of the head to the neckline (Points A–B). This distance is how far the price will move if it breaks though the neckline (Points C–D). Here you would place your entry level at price (Point D).
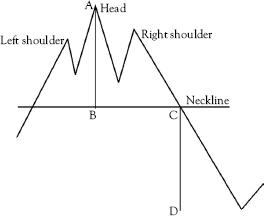
Note that lines AB and CD are same in length. This knowledge can be used effectively when trading once the price goes below the neckline.
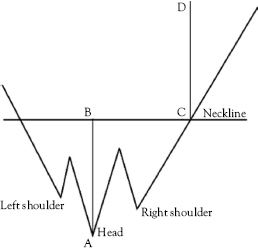
Inverse head and shoulders are essentially the opposite of the aforementioned trends. A valley is formed (right shoulder and shown as D), followed by an even lower valley (head and shown as E), and then another higher valley (left shoulder and shown as F). These formations tend to happen after downward movements.
The trading strategy is the opposite of the shorting position in the preceding diagram. When the share breaks upward through the neckline, the share is expected to move up by the same distance as the neckline–head (AB and CD). Measure the distance between the head and the neckline, and that is the expected distance that the share price should move after it breaks through the neckline going upward.
Double Tops and Bottoms
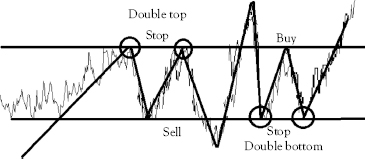
Before you throw your hands up in the air and give up, look at the preceding pattern. The double lines are just the support and resistance levels outlined in previous chapters. There will be times when the share price has hit the resistance level twice and then falls through the support level.
This tends to happen when a share price has hit the resistance level twice in quick succession, but that resistance level seems to be absolutely solid. Look at the price graph and you will probably see that the level was seldom broken. At this point, the share falls through the support level and this is called a reversal pattern.
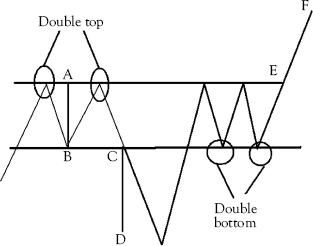
• Trader’s trigger: With the double top, short-term traders should place their entry levels below the neckline (at Point C) because the anticipated fall will be line CD (calculated from line AB). Long-term traders should calculate CD and place entry at such levels.
The double bottom is also a trend-reversal formation, and in essence, the exact opposite to the double top formation. Traders see a double bottom formation and go long instead of short at point E. the expected climb is line EF, as calculated by line CD.
Triangles and Rectangles
A rectangle is one of the simplest pattern formations: it is formed when prices become bound by parallel support and resistance levels. What such a pattern indicates is market indecision.
Resistance and support patterns have been amply defined in previous text, so let us concentrate on bearish and bullish rectangles.
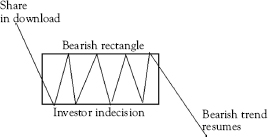
An obvious statement to make is that a bearish rectangle is created when investor indecision takes place at some point during the share’s fall. Often, it is an indication that investors and traders are wondering whether the share has fallen far enough.
In the preceding chart, the share falls, moves into a sideways motion, and then resumes its downtrend.
• Trader’s trigger: Once the share falls below the rectangle support line, it tends to make a sudden move that is similar in size of the rectangle.
In a bullish rectangle, a share in an uptrend pauses to consolidate.

The trend is the same as the bearish rectangle. Traders can expect the share to resume its uptrend and jump by at least as the same amount as the rectangle formation.
Wedges
Traders need to understand that trends do not go on forever, and trend patterns can change quickly, and that there will be times when shares and share price actions will stall due to trader indecision. Wedge pattern formation can be used as a trigger to identify a pause in the current trend. When a wedge is identified, traders will see that volume of trading has started to fall or has stalled. As such, wedges tend to be used by professional traders as either continuation or reversal signal triggers.
Rising Wedges
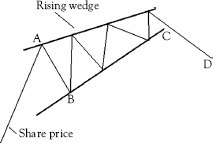
The definition of a rising wedge is when a share price consolidates between upward-moving wedge-type formations; see preceding diagram. In essence, a share price moves between support and resistance lines in a sloping formation.
Here, the slope of the support line is steeper than that of the resistance. This indicates that higher lows are being formed faster than higher highs. This leads to a wedge-like formation, with prices consolidating. Professional traders state that it is at this point that a breakout to either the top or bottom is expected.
• If the rising wedge forms after an uptrend, it is usually a bearish reversal pattern.
• Alternatively, if it forms during a downtrend, it could signal a continuation of the down move.
• Either way, the important thing is that, when you spot it, you are ready with your entry orders!
• Traders signal: a rising wedge = breakthrough the support line.
Falling wedges
Just like the rising wedge, the falling wedge indicates that a trend is about to change.

In the preceding chart, the falling wedge serves as a reversal signal. After the share has been falling (lower highs and lows), it seems to gather momentum. Upon breaking above the top of the wedge, the share moves upward from Point C to Point D. This movement is, in length, about equal to the height of the formation (line AB).
Traders should, thus, place their buy signal at Level C or just below that line, and a sell signal target would be the height of the wedge formation.
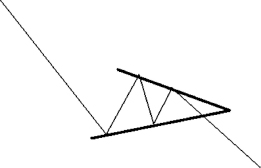
Pennants are also continuation patterns formed after a significant bullish or bearish movement.
The difference to the previous diagrams is that the consolidation is short-lived and the price jumps in on the strong move, forcing the price to burst out of the pennant formation. The calculation of this movement is at least the height of the earlier move, also called the mast.
Pennants can be either bearish or bullish.
Using Chart Patterns
It is not enough to know what the aforementioned charts mean. Traders have to understand their benefits.
To trade the aforementioned chart patterns:
• Place an order beyond the neckline; up or down.
• This must be in the direction of the new trend.
• Use the height of the formation as Buy or Sell signal; depending on whether you are going short or long.
• Always place your stop loss.
Magliolo’s Detection Strategies
As promised, I am making my personal trading strategies available to you. The following is a summary to help you remember all those chart patterns and what they signal.
Forms during |
Type of signal |
Expected next move |
|
Double top |
Uptrend |
Reversal |
Down |
Double bottom |
Downtrend |
Reversal |
Up |
Head and shoulders |
Uptrend |
Reversal |
Down |
Inverse head and shoulders |
Downtrend |
Reversal |
Up |
Rising wedge |
Downtrend |
Continuation |
Down |
Uptrend |
Reversal |
Down |
|
Falling wedge |
Uptrend |
Continuation |
Up |
Downtrend |
Reversal |
Up |
|
Bearish rectangle |
Downtrend |
Continuation |
Down |
Bullish rectangle |
Uptrend |
Continuation |
Up |
Bearish pennant |
Downtrend |
Continuation |
Down |
Bullish pennant |
Uptrend |
Continuation |
Up |
Notice that I did not include triangle formations, as these patterns can form either an uptrend or downtrend and can signal either a continuation or reversal.
Chapter 7 highlights the trader’s critical triggers of momentum and strength.