
If stock market experts were so expert, they would be buying stock, not selling advice.
—Norman Augustine (1935–Present)
U.S. aerospace businessman
Merging Moving Averages
Should You Trade or Invest?
Experts can take the simplest ratio, indicator, or trigger and complicate it to the extreme. For instance, they often use moving averages as support and resistance indicators. In this instance, you ignore traditional support and resistance lines and use signals based on specific moving averages.
The trick is to combine exponential with simple moving averages to get a moving average trigger.
A brief overview: simple versus exponential moving averages.
Moving average |
Explanation |
Simple |
• Basic lines based on a number of days taken as an average. • Indicate the average price paid for a share over time. • Used as a forewarning signal. • Susceptible to false signals. |
Exponential |
• H ave a greater weighting on recent prices as opposed to average prices. • This means signals are more accurate. • Used to detect changes in trends. |
Note |
• Simple moving averages are a smoother line than exponential moving averages. • Signals are for both short- and long-term trades. |
It must be stressed that there are no hard-and-fast rules as to the length of time used for both the simple and exponential moving averages. This depends solely on your trading style and strategy. Whatever timeframe you use, ensure that you test and re-test signals before you adopt these as part of your personal timing strategy.
Traders use their own timeframes, but for the purposes of this volume, the common combined averages are:
• Ten-day SMA and 30-day EMA to determine whether you should be focusing on long or short positions.
• Long: 10-day SMA is above the 30-day EMA.
• Short: 10-day SMA is below the 30-day EMA.
This simple technique identifies the underlying trend and helps traders quickly decide whether a position is right for them. Here is an example:
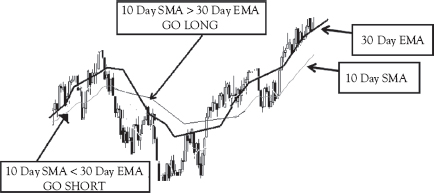
Looking at the preceding chart, a mere glance can tell you when to buy for the short term or as a long-term investment. The preceding strategy is fine and can be used without further signals being added. However, it is advisable to add an indicator to determine oversold or overbought positions.
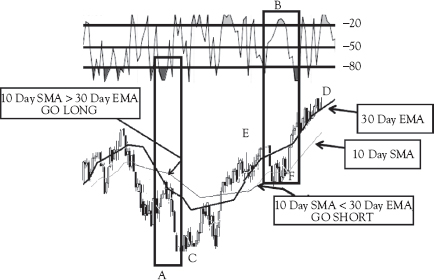
As moving averages are trend-following indicators, they only provide sound signals in trending markets and not when the share is moving sideways. At this point, it is imperative to establish whether the trigger is, in fact, a trend, and not a sideways movement. Traders do this by adding the Williams %R technical trigger.
Establish Substance
The Williams %R indicator is a momentum indicator and measures whether a position is overbought or oversold. The indicator is easy to use and the oscillator fluctuates between a zero level and 100.
• Oversold: when the indicator is between 80 percent and 100 percent.
• Overbought: when the indicator is between 0 percent and 20 percent.
The indicator uses the closing price relative to a price range over a predetermined period. While the default setting in most charting packages is 14, many professionals use a setting of 3, which is far more sensitive. When combined with the SMA and EMA, the following rules apply:
• Trigger indicating an oversold position: 10-day SMA > 30-day EMA and the Williams %R is less than −80.
• Trigger indicating an overbought position: 10-day SMA < 30-day EMA and the Williams %R is greater than −20.
• Comment: The greater the overbought or oversold position (as indicated by Williams %R), the greater the chance of a market reversal happening.
• Rule
![]() Go long: Williams %R is at −90 or below.
Go long: Williams %R is at −90 or below.
![]() Go short: Williams %R is at −10 or above.
Go short: Williams %R is at −10 or above.
Here is an example:
Block |
Explanation |
Share movement |
A |
• Long-term buy. • Supported by a Williams R% level of below −80%. |
Level C to level D. |
B |
• Short-term buy • Supported by a Williams R% level of below −20%. |
Level F to level D. |
Comment
• Triggers are used by day traders.
• Triggers forewarn of changing short-term trends.
Stated differently: Traders want to assess when to buy or sell in the short term.
Another point of advice from professionals:
• Traders tend to be bearish when the market moves strongly and gets near the top of the sell trigger.
• Speculators tend to be bullish when the price is climbing.
If you set triggers, then use them and avoid speculation. That is always a disaster for traders.
Part III, Chapter 12, is the start of day trading methodologies.