
chapter 3
DATA COLLECTION
Oxford dictionary defines data as “facts, figures and statistics collected together for analysis”. For most of the real-time projects, these facts and figures are unorganized and unprocessed. Consider a sentence, “the price of crude oil is $180 per barrel”. Can any specific information be gained from this sentence? Is it current price of the crude oil in India? Such questions cannot be answered from these data fragments. So, data can be a number, a word, an object, a picture, a graph or even a recorded sound, and it can also be characters, integers, real numbers, strings, etc. Data by itself has no meaning. These fragments fill the gap of some information, which is in an organized manner. These organized structures are called databases.
3.1 PRIMARY AND SECONDARY DATA
From a researcher’s point of view, data can be categorized into primary and secondary datasets. Researchers need to consider two choices of data sources: primary and secondary. Suppose a researcher prepares a questionnaire in his topic of research interest. The data thus obtained will be used in direct analysis; it is termed as primary dataset. If the researcher obtained the same data from some official documents, then it is called secondary dataset.
3.1.1 Primary Data
Primary data are generated by data gathering techniques. For example, an economics researcher preparing an analysis report from annual reports of companies or official statistics of the statistical office is considered as secondary data. Researchers use different methods in the collection of data sources and their usage. Figure 3.1 shows difference in primary and secondary data sources.

There exists a high-level link between primary and secondary data sources. Researchers can interchange and apply these links based on the way how data need to be used. If the researcher is seeking data directly, he/she makes use of primary data sources. The primary data collection methods are as follows:
- Questionnaire
- Interviews
- Observations
- Surveys
- Action research
- Longitudinal studies
- Life histories
Advantages
- Primary data is original and is apt to the research topic, as the degree of accuracy is high.
- A variety of methods are used to collect primary data, from a large population and geographical coverage is promised. For an instance, a web-based questionnaire gives a wide range of geographical coverage and border population. For example, a common question like, “Is Aadhar required for subsidies in domestic LPG cylinders?”
- Primary data provides a realistic view because the data is current in the selected topic.
- Primary data offers high reliability and robustness.
Disadvantages
- Interview is a primary data collection technique, which is limited and expensive when it needs a wider coverage or a massive number of requirements.
- More time is required for data collection. Even analysis and report generation from a primary source are time consuming.
- Many design problems are incorporated with primary data collection techniques. For example, to conduct a survey, high-level design is required because questions must be simple to understand and easy to answer.
- A timely response is inadequate in primary data collection. Respondent may give fake or sweet answers and try to cover up the facts or realities.
- Time, efforts and costs involved in data collection method are more and much man power is required.
- Concept of logic may be lost in some primary data collection techniques. This can cause some negative impact.
- Trained persons are required in the data collection steps. The availability of such personal is very less and also costly.
3.1.2 Secondary Data
Secondary data are generated by alternate methods. They are collected by the researcher for supporting purposes. For example, a researcher collects 2011 census data of India for his/her research purpose to study the impact of education in carrier selection and earning. Here, the census data is considered as the secondary dataset for his/her purpose. Thus, he/she got the primary data from the secondary sources.
A variety of secondary data are available in different sources in written, typed or in electronic forms. Researchers can gather these data from industries, organizations, databases, etc. This is used to gain initial insight into their research problems. The collected data may be in different forms, from different sources in the form of raw data, which needs to be organized for the research purpose.
Secondary data can be either internal or external. Internal data is acquired within an organization for a researcher. For example, a researcher is conducting his/her work in demography department; the department needs census data for analysis. Thus, this becomes an internal data. External data are those obtained from outside the department such as national population register, records from government of India and so on.
Secondary data are collected from internal and external sources (Fig. 3.2) such as accounts, periodicals, government records, internet sources and so on. Secondary documents can be generated from supporting documents, historical documents, etc. (Fig. 3.3).

Fig. 3.2 Types of secondary data sources
In essence, primary and secondary sources do not have any tight separation, but a researcher always keeps a narrow gap between the two while involved in deep research. For example, data collected from the internet is considered sometimes primary or secondary. So, shall we consider internet as a primary data source or secondary data source?
Advantages
- Data population is already available for the investigator, so that data collection time can be saved.
- It is less expensive and also there is a faster access in the data sources.

- Responsibility of the quality of data does not falls onto the investigator.
- Secondary data give a frame to the researcher’s mind, which has a direction for specific research.
- Secondary data are collective and voluminous.
Disadvantages
- Investigators may confuse what is to be collected due to its bulkiness.
- Quality of the data may be doubtful.
- Additional data that are related to the collected data may not be available.
- Due to variable environment factors, data collection locations may not be suitable.
- Special care should be required for secondary data modification, analysis and change, because it may be copyright protected.
Case Studies
- A researcher needs to conduct a social survey related to “requirement of bank account in Below Poverty Line (BPL) people”. Initially, how he/she can conclude that “these are the people who are under BPL category?” First, the researcher collects the relevant data as he/she wishes. In the next step, he/she collects the list of people who are under BPL category (address, location, house number or any other useful links). This source may be from the population register, voters register or from the panchayat register (any government record source). This dataset is the secondary data for his/her survey. He/She can prepare a set of questions or conduct personal meetings with the selected people (or family) for collecting the data regarding his requirements. The resultant dataset is primary data and is useful for analysis.
- Suppose an environment researcher wants to study “the corals in Lakshadweep”. Initially, he/she collects data with respect to coral types, geographical locations, availability, etc., from the internet or any government agencies. This is considered as secondary data source. In the next step, he/she may visit the selected locations of the Lakshadweep to collect his/her required samples. Features of the samples are primary data obtained from the primary data sources.
3.2 PRIMARY AND SECONDARY DATA SOURCES
A primary source is an original object or document. This is raw information or material or the first-hand account of an event. The primary source material may be created by participant or researchers at the time of their study. Some of the primary sources are interviews, current newspapers, manuscripts, government documents, etc.
Secondary sources are any published or unpublished work that may be removed from the original source. Usually these are obtained by summarization, analysis, evaluation or even derived from primary source materials. The secondary source may be obtained from a criticism or interpretation of primary course. Some examples of secondary sources are text books, review articles, biographies, music clips, article about events etc.
Secondary source may also be primary source due to its types of direction. For example, a researcher collects some scientific data from past researchers and he/she will come to know that it is useful for his/her study. So he/she considers this dataset as primary data source. The distinction of primary and secondary sources depend on how a researcher is using the source and the nature of the research. The various sources of data are shown in Fig. 3.4, and the various sources of secondary data are given in Fig. 3.5.
Case Studies
- Suppose a researcher wants to do his/her work in speech and signal processing. He/She would like to do a “mimic system” from a set of voice data. Initially, he/she makes the design model, and then trains it and finally tests with some input voice. The “text-to-speech” will be carried out by a trained man’s voice. For this study, he/she can collect voice clips from the internet or radio sources recorded data. The source may be secondary source but for this study this is considered as a primary source of data.

Fig. 3.4 Sources of data

- 2. A researcher wishes to do his/her work in a public interested subject, say “effects of war”. This work will be basically a public survey, as we know that articles in the newspapers and magazines are considered as secondary sources. If the researcher is conducting study on “Afghanistan war”, an eye witness accounts for a primary source for his/her work, where he/she can collect data from the witness and the newspaper reports about the war become supporting evidences or additional materials. Through interviews or similar investigation methods, the relevant data can be collected, sorted and stored for later use. These relevant sources may be a secondary source.
3.3 DATA COLLECTION METHODS
Data collection is an important aspect of any type of research study. Inaccurate data collection can affect the results of a study and ultimately lead to invalid results. An empirical method is used for data collection by researchers entrusted in quantitative work. The various methods used for data collection are discussed in the following sections.
3.3.1 Questionnaire
Questionnaire is a set of questions that have been prepared and often sent to a large number people. Most of the time questions are either in printed or in electronic form, to be answered by individuals. The questions should be very clear and easy to understand. After completing the questionnaire, a report needs to be prepared. The following are the important points to be remembered while designing a good questionnaire:
- Group items into logically coherent sections,
- Begin with non-threatening and interesting questions,
- Do not put important items at the very end of the questionnaire,
- Do not crowd a page with too many items (if paper is the medium of communication),
- Do not crowd too many questions or choices in an electronic page,
- Avoid abbreviations and biased items or terms,
- Number the questions to avoid confusions,
- Provide anonymity to respondents,
- Test all questions in the questionnaire to avoid confusing ones.
For example, a common questionnaire looks like,
- How often do you backup your computer file (in your hard disk)?
- Frequently
- Some times
- Hardly at all
- Never
Advantages
- Questionnaires are very useful when it is used for specific purpose and not in general information gathering.
- This data collection method typically includes closed-ended questions.
- Questionnaire must have clarity and needs to be logical in sequence as any doubts can be cleared.
- Questionnaires are preferred to be in objective format, because it helps even the less educated community to respond to it.
- Data can be gathered from a large group. So, data collection is good enough based on the number of respondents with relatively low cost.
- A variety of communication channel may be used such as telephone, e-mail, postal, web enabled and so on.
- Easy to reach people in a large geographical area if they are spread over in remote locations.
- Face-to-face questionnaires are possible and are appropriate in consulting disabled people.
Disadvantages
- Response rate may be low due to some refusal from the people.
- Postal questionnaires are very slow.
- Technical surveys require high-level design skills in order to simplify the questionnaire.
- Trained professionals are required in face-to-face questionnaires.
- Face-to-face questionnaire is time consuming and costly due to intensive labour.
- Evaluation of questionnaire is difficult if the answers are in written form.
- Common mistakes lead to information fabrication.
Case Study
An economic survey is conducted on the average income of families over a population of 10,000 people living in a housing board colony. The questions are designed in the closed-end format.
- Gender:
M: Male F: Female
- Age group:
- 20–30 years
- 30–40 years
- 40–50 years
- Above 50 years
- Yearly house hold income:
- Below 2 lakhs
- 2–5 lakhs
- 5–10 lakhs
- Above 10 lakhs
- Your occupation:
- Professional
- Government
- Business
- Self-employed
- Average annual income tax paid:
- Below 1 lakh
- 1–3 lakhs
- 3–5 lakhs
- Above 5 lakhs
- Number of members in your family:
- 2
- 2–4
- 4–6
- Above 6
- Average monthly saving expenses for a family in saving schemes:
- Below Rs. 50,000
- Rs. 50,000 1 lakhs
- Rs. 1 3 lakhs
- Above 3 lakhs
- Do you have child insurance plan:
- Yes
- No
- Average travel expenses for a month:
- Below Rs. 1000
- Rs. 1000 to 3000
- Rs. 3000 to 5000
- Above Rs. 5000
- Average educational expenses in a month:
- Below Rs. 1000
- Rs. 1000 to 5000
- Rs. 5000 to 10,000
- Above Rs. 10,000
The questions may or may not be answered by every respondent. Some of the respondents may answer completely while some of them may not. The analysis is very difficult in the scenario if most of the questions are not answered.
3.3.2 Questionnaire Design
Questionnaire is a tool for collecting and recording information about an issue of interest. A list of questions are included in simple or understandable format for the respondents. The information gathering is essential, so that careful consideration is to be given while designing the questionnaire. The number of stages included in the questionnaire design is given in Fig. 3.6.
Step 1. Initial Considerations
First, a researcher must decide and be clear about the type and nature of information that needs to be collected and what exactly is targeted. For example, if we need to collect economic survey data of low poverty line family, decide which are the target geographical locations to be selected, how many districts are included?, etc.

Step 2. Question Content
It is an important step as the questionnaire design is highly related to the type/kind of questions that need to be included. The prepared questions must be clear and easy to understand. It should not cause any confusion to the readers. Question preparation is a creative process and it needs some skill set to prepare it. The questions thus prepared should always adhere to some standard formats.
Step 3. Question Sequence and Layout
The questions should be numbered and ordered with a touch of logical flow. This is because the respondent should feel a light mind while answering the questions. Funnelling is a technique that begins with general questions before entering to specific questions. Some questions may need routing. For example, if yes go to question number 5, else go to question number 10, etc. Care should be taken while creating routing as too many routing create complex architecture.
Equalities: Only a part of population may be related while we include questions on gender, age, ethnic group, etc. It is a bad practice to ask these questions and simply store such data rather than using them for specific purpose. While making the questions, always remember such accounts for equalities are met. Equalities are sometimes included in transactions into minority ethnic language for people who are not native English speakers. This explains the focus of the survey and allows them to request a translated copy of the questionnaire.
Confidentiality: Sometimes the respondent needs an assurance of confidentiality of information they provide on the questionnaire. Personal details and identities cannot be disclosed to others except for research purposes and data analysis. For example, in election surveys, responses are very important but revealing people’s identity to others may do serious hazards.
Step 4. Piloting the Questionnaire
A pre-test is required for the questionnaire within a small population before publishing. This pilot should check people’s understanding and ability to answer the questions. Various other concerns such as response time, confusion in the respondents such as routing errors, question clarity, equalities, etc. can also be studied by conducting the pilot study.
Design of research questionnaire
For social research, questionnaire is an important data collection tool. Basically, it serves four purposes:
- Collection of appropriate data
- Prepares the data in comparable and agreeable form for analysis
- Formulate minimal biased questions
- Prepare questions in varied forms
The following are the important points to be noted while designing a questionnaire for research purpose:
- Keep the objective of the research in your mind and the structure of questions.
- Provide a clear direction of how to answer and compile questionnaire with examples (if it is necessary).
- Format of the questionnaire should be neat, clear and contain instructions on how to complete these questions.
- Use of easy and simple English throughout the questionnaire.
- An element of motivation can be given to increase its response rate.
- Pre-preparation is essential in order to ensure that the questionnaire should be completed within the time limit.
- Avoid confusing words and highly technical words in the questionnaire.
- As far as possible questionnaire should be structured and standardized.
- Questions should have logical order and sequential flow.
- Questions should be numbered in chronological order.
- Biased contents, themes and concepts should be avoided.
- Questionnaire should not embarrass or hurt the respondent.
- Questionnaire must be focussed to the objectives and should not lead to specific answer.
- Questions should be accurate as far as possible from the feedback of the respondent.
- Anticipated questions delivered to the respondents at the instruction phase will be helpful to the respondents.
- Enough time need to be allotted to each questions and entire questionnaire.
- A pre-test of the same or similar questionnaire should be conducted in order to identify the problems and threats to improve the quality of the questionnaire.
- A logical structuring and design of the pages are essential in the questionnaire, as it gives a good “look and feel”.
If we follow the aforementioned guidelines while preparing a research questionnaire, accuracy and clarity of the data collection will increase. Research problems that need data collection using questionnaire should decide on the type of information that needs to be searched for. The questionnaire should be problem specific. After the construction of questionnaire, it must be scaled and set in a logical framework followed by a pre-test. Based on resulting recommended corrections, adoptions or deletions, questions can be modified to increase the quality of the final questionnaire.
3.3.3 Types of Questionnaires
Based on the format or type of question preparation, there are two types of questionnaire: open end and closed end.
Open format questions
If our audience needs a free-flowing opinion and they wish to express their answers, then we can design open questions.
For example,
- Provide your opinion regarding the quality of XYZ Company’s products and services.
Ans: …
The open format questions give true insight and unexpected suggestions for improvement.
Closed format questions
Multiple choices and true or false type questions restrict the respondent to choose any one answer. This format is called closed-end questions. The analysis and calculation of statistics become easy, if we are using closed-end questions in our questionnaire.
For example,
- Rate the quality of XYZ product and service.
- Poor
- Satisfactory
- Good
- Excellent
There are seven ways in which one can create closed-end questions. These responses are accurate in statistical analysis. The closed format questions are seen in different types based on the choice of answers given.
- Leading questions: The question that forwards the audience for a particular answer. The answers are equally likely.
For example,
- How would you rate our service?
- Fair
- Good
- Excellent
- Super
- How would you rate our service?
- Importance questions: A scale of 1 to 5 is given to the questions, the respondents are free to select.
For example,
- Cost-benefits of our service are …
- Extremely important
- Very important
- Sometimes important
- Not very important
- Not at all important
- Cost-benefits of our service are …
- Likert questions: These types of questions help in a strong agree if the respondent in particular statement with a certain product/service needs.
For example,
- Dichotomous questions: It is like a “true or false” or “yes or no” type questions. The analysis scope is very poor; this is one of the major drawbacks of these types of questions.
For example,
- Do you like the products of XYZ company?
- Yes
- No
- Do you like the products of XYZ company?
- Bipolar question: Suppose a question set contains two extreme answers written in opposite end of the scale.
For example,
- How would you describe the service of XYZ company?
Fast – X – – Slow Reliable – X – – Unreliable Efficient – – – X Inefficient Excellent X – – – Poor
- How would you describe the service of XYZ company?
- Rating scale questions: Most of the companies in service sectors are using these types of questions. The respondents are asked to rate a particular issue on a scale that ranges between poor and good.
For example,
- How do you rate the service of XYZ company?
- Good
- Fair
- Poor
- Very poor
- How do you rate the service of XYZ company?
- Buying propensity questions: In order to identify futuristic intentions of a customer and determine respondent’s buying intention. A particular product review or requirements can be addressed in these types of questions.
For example,
- If TV channels are provided in your cell phones, would you prefer to buy it?
- Definitely
- Probably
- Probably not
- Not sure
- Definitely not
- If TV channels are provided in your cell phones, would you prefer to buy it?
Another classification of questionnaire based on organization or involvement of questions is discussed here.
Structured questionnaire
If the questions are listed in a prearranged order, it is called structured questionnaire. These listings are in chronological order and maintain a flow.
Non-structured questionnaire
The question in the questionnaire does not maintain any order or flow but maintain some structure. Researchers are free to ask any sequence as per their need/wish.
Disguised questionnaire
The respondents who are involved in the questionnaire are aware of the purpose of data collection and need of information gathering. Such a type questionnaire is considered as disguised questionnaire.
Non-disguised questionnaire
The respondents are unaware of conducting the questionnaire or need of conducting survey.
Case Study
A botany researcher wishes to collect data regarding “medicinal plants used by Tribes. Initially, he/she locates the places where he/she wishes to visit; then identify the tribal group who can contribute to his/her research work; what are the plants to be included in his/her study, etc. He/She can prepare a questionnaire that may be open-ended or some questions are in closed format, based on the requirements. The questions need not maintain any flow because he/she wishes to collect data from different tribal people/groups; most of them are unaware of some of the medicinal plants and its usage. The targeted group may contain different types of scholars. Also they may be not familiar with standard decisions. So questions may be disguised also.
3.3.4 Interviews
It is a powerful data collection method that handles personal meetings with necessary questions. Usually, interviews are quantitative research aids for data gathering. There are two people committed to come across: interviewer and interviewee. The interviewer efficiently collects the data by cross examination and must be sharp to get an accurate data.
Advantages
- Information can be gathered from literate as well as illiterate people.
- Non-responding population will be very less.
- Reliable data sources are obtained in a structured interview.
- Provides an excellent way to probe and explore questions.
Disadvantages
- Require skilled staff and ample time for conducting the interviews.
- Sometimes special equipment are required to record and transcribe interviews.
- Chances of bias and threats are more.
- Cost and manpower are high.
- Personal questions are non-judgemental.
Interview process
For successful data collection, interviews should be in correct format. While performing an interview, the basic things to be considered as mentioned below.
Step 1. Identify what information is required. What exactly are you looking for?
Step 2. Determine the audience for the interview. Interviews can be face to face or telephonic or chat based. Prepare an invitation that may contain purpose of the interview, participants’ role and expected outcome.
Step 3. Prepare the interview schedule, contents, format and its layout.
Step 4. A pilot interview schedule needs to be conducted in order to rectify errors.
Step 5. Conduct interview.
Step 6. Transcribe interview.
Step 7. Analyze the outcomes.
3.3.5 Types of Interview
Basically two types of interviews are in research data gathering: structured and unstructured. In structured interviews, researchers prepare a standard set of questions. There are open-end and closed-end questions in the interviews. Open-end questions give more sense of involvement but take long time to answer and difficult to summarize. The questions are focussed on specified answers such as “what you think about”, “how it can be improved” and so on.
The closed-end questions offer set of specified responses like true or false, multiple choices, rating a response, etc. In such cases, useful information may be overlooked and more topics can be covered in less time period. Figure 3.7 shows basic types of interview questions with examples. While preparing questions for the interview, any methodology can be adapted viz. top-down or bottom-up question preparation (Fig. 3.8). These two methodologies have their own advantages.

Fig. 3.7 Types of questions

Fig. 3.8 Methods – top-down and bottom-up
Case Study
Consider an interview with a doctor for making an expert system software. The questions may be closed and open ended. Finally, the expert system may ask questions and get conclusions.
Patient: I have a headache.
System: I suggest you take a pain killer. Do you have a sore throat?
Patient: Yes, I do.
System: Have you been coughing?
Patient: No, why do you ask?
System: If you had a headache and a sore throat and had been coughing, I would have to conclude that you might have the flu. It does not sound as though you have the flu? Have you been feeling tired recently?
Patient: Yes, I have.
System: It sounds as though you may have glandular fever or tonsillitis.
3.3.6 Observation
Observation is a complex research method that requires more role and attention from a researcher at the time of data collection. An observer gives careful watch because his/her skill set and experience are very much used for the data collection as there is no close contact with the respondents. That is, the observer’s talent is dependable for the data collection. Observation data collection method is useful when the subject cannot provide any accurate information. For specific topics of study, observation is suitable and it fulfills the requirements for data collection properly. Figure 3.9 shows the various types of observations.

Fig. 3.9 Types of observation
A major drawback of the observation technique is the need of skilled staff as there is no chance to ask questions during observation. When large samples are the subject of study/concern, this method is inappropriate.
Case Study
Consider a researcher who is doing his/her research works in power plants (generating electricity). Basically, he/she is an electrical engineer, so that the technical terms related to power plants and turbine are well known. He/She needs observation of the actual power plant operations because most of the collected data are studied theoretically (or from text books). To understand the components and clarify the data, he/she needs a clear observation in the power plant. The observation helps him/her to place the data in his/her research slots.
3.3.7 Record Reviews
Reviewing the records/reports from the secondary source is another method of data collection. Through this method, researchers may get a clear picture about his/her accurate area of information source. For example, historical research may need to search old records or reports of such types. Another example is a medical research to conduct a survey of “heart attack of middle age people”. The record reviews from hospitals are essential for his/her study to get data. Here, the patient’s case history serves as the data source.
3.3.8 Schedules
This method is a time-lined process in which the appointed personal will give training. Consider a research focussed to collect information from a large uneducated and non-responsive group. The questionnaire may not be good enough for data collection. Here, questionnaires are prepared and sent to the enumerators who are appointed by investigators. They can explain the objective, scope and purpose of the survey expecting their co-operation. To complete the data collection, the questionnaire is filled by the enumerators. Such methods are schedules and are used in extensive studies. Accuracy of the collected information is highly dependent on the honesty of the enumerators. So they must be trained. This method is more time consuming and costly. Some examples of scheduling are as follows:
Village or community schedule:
For example, census researchers collect general information on population etc.
Household schedule:
For example, demographic details of households, education, relations, etc.
Attitude schedule:
For example, views of population, a particular event, etc.
3.4 DATA PROCESSING
Data processing is an operation(s) performed by automatic means such as collection, recording, streamlined storage and analysis of useful information. Data processing is an important activity which involves five steps (Fig. 3.10).
- Input step
In this step, data is collected and transformed into a computer understandable format because correct output entirely depends on the input data. The collected data should be verified and corrections if any required should be done. Next step is coding. Coding converts the collected data into machine readable format for computerized processing. These data are stored on the secondary storage in the form of files or database.
- Processing step
Manipulations can be done on the collected data for data processing such as classification, sorting, calculation, comparing, summarizing, etc. This process gives information from the processed data. Classification is the process of grouping the data in subgroups that can be handled separately. Sorting is the arrangement of data in any order for faster access. Arithmetic operations can be performed in this numerical data for required results. For top managements, a summary of the selected data is required. For example, percentage of pass or fail criteria of students in examinations.
- Output step
In the output steps, processed data are visualized in different forms. Each view is user dependent based on their actual requirements. There may be required hard/soft copy of the processed data as an output view. For example, graphical representation of “comparison of degree results of different colleges” in a University.
- Storage step
An output is generated from the processed data. The generated output can be kept in the secondary storage for future use. For example, first three ranks of BSc. Computer Science students can be obtained by data processing step and stored in the secondary storage for any time search. This data processing includes consolidation of all marks obtained in the past examinations. A comparison of consolidated marks obtained in the past examinations can be obtained from this store. Also comparison of consolidated marks among the whole registered candidates can be obtained for rank calculation. Sorting process should be applied for displaying first three ranks.
- Communication step
The output is required to be stored in the media that can be retrieved any time. Some conversions are also required for storing data in different forms. For example, graphical representations of examination result. Finally, communicating these processed data to different users. For example, weather forecast report is obtained by a series of data processing. These reports are sent to government agencies or newspapers when it is required.

3.4.1 Types of Data Processing
There are manual data processing, electronic data processing, real-time processing and batch processing. In manual processing, many errors may occur, such as data capturing, operator mistake, etc.. This type of data processing is expensive due to heavy labour cost. In electronic data processing (EDP), computers play an important role in data processing. An information system (IS) is an example of EDP system that evolved from a data processing unit. For example, an Automatic Teller Machine (ATM) works as an EDP system that gives reports as output.
In real-time processing, for a continual input, a processed output data is obtained. Only a small time period is involved in between the processes. For example, in the case of online banking, the processing time is very small between transactions and balance is updated as soon as possible for secure transactions.
In batch processing, a group of transactions are collected over a period of time. That is, data is collected, entered and processed in batches and the results are produced. Separate programs are required for input and output data processing. When high volume of data is involved in the research process, this technique is highly acceptable. For example, in the university examination system, online mark entry and decoding process are considered separately (parallel or batch wise) for efficient data processing.
3.4.2 Data Processing Stages
Data preparation steps involve editing, coding, verifying, analyzing and displaying the data. Data need to be processed before it is used for analysis. Figure 3.11 shows stages in data processing.

Fig. 3.11 Stages of data processing
1. Editing
Editing is a process of checking and adjusting the obtained data. The data editing is required to review the collected data, for maximizing its accuracy and clarity. Early editing gives much advantage of permitting the accurate analysis. Editing process normally ensures consistency and uniformity in the data treatment. Editing tools are available for researchers in various forms depending on its use. A good editing process should essentially possess the following:
- Legibility of entries: The collected data should be legible; otherwise data should not be used.
- Completeness of the entries: Ambiguous data may create many problems in the research. So its completeness must be ensured in the records in future.
- Consistency of entries: Questions may evolve due to inconsistent entries. If the responses are incorrect, use editing tools to correct the data.
- Accuracy of entries: Editing tool needs a look for any indication of inaccurate data obtained from the interview.
Types of editing
Major types of editing are as follows:
Field editing: Field supervisor can edit the data on the same day of data collection. These errors may be the legibility of handwriting and poor responses that are logically inconsistent.
In-house editing: An in-house team in the central office can perform editing process of the collected data. For example, rearrangement of data after the questionnaire or interview process.
Major purpose of editing is for ensuring the consistency between responses. “No response” may be corrected in order to reduce errors. Such legitimate errors are corrected before coding process.
2. Coding
It is a process of identification and classification of the answers with numerical representation. A numerical score or symbol is a code that serves rule for interpreting, classifying and recording the data. Coding process translates answers into numerical numbers for later evaluation. It can be visualized with the help of coding book, code sheets or computer software. A data matrix that is arranged in row and column wise (organized into fields, records and files) is one of the translated form for the coding stage. Here, fields are collection of characters that represent a single type of data. Records are collection of related fields within a same respondent. A file is related to collection of records. For example, student’s data are stored in a file named “student”. Each student’s details are stored in the records. Each record contains student’s data, such as “name”, “date of birth” and so on, which are considered as fields.
Coding process may have some issues such as fixed alternative questions – before the data collection, a fixed coding technique is provided to the questions. Another issue in coding process is the hardship in maintaining a code book. Different coding books are required for the process if it is a lengthy process. How many books are required? What books are required? Such questions are difficult to address.
Case Study
A research survey is conducted in three districts of Kerala state to identify “role of youth contribution in political parties”. Figure 3.12 shows the same age group of 300 people who involved in the survey from three districts: Kannur, Thrissur and Kollam.
The corresponding graphical representation is given in Fig. 3.13.
In the questionnaire, gender is a field in order to get the “role of woman youth”. Figure 3.14 shows data distribution over the selected three districts and Fig. 3.15 shows the marital status of the respondents.
In the questionnaire, people may not give data such as marital status. Suppose this field is not answered by any of the respondent, then in editing process it must be filled. In this questionnaire, the marital status may be look like


Fig. 3.13 Graphical representation

Fig. 3.14 Data table 1

Married … Unmarried … Widower
This must be translated to counts (Fig. 3.14), which is the actual coding process. These tabular forms are good enough for the data analysis. Similarly questionnaire contains many questions for the respondents. Before the data analysis, editing and cleaning processes are required. Data cleaning is an intermediate step before the data analysis step. In this step, errors are cleaned before the analysis stage. For example, in a questionnaire, the age of a person is given as 120. Is it 20 or 12? This must be cleared. Another example, 1 = male and 0 = female is given in a questionnaire. But some missing value may happen like the person forget to answer the query. These mistakes must be cleared.
3.5 CLASSIFICATION OF DATA
There are different classifications of data with respect to organization, storage and usage. This classification helps the researcher to physically collect, logically organize and technically arrange the datasets.
3.5.1 Quantitative and Qualitative Data
Quantitative approach includes historical research, which collects narrative data to attain some insights. Qualitative analysis transforms data into findings. Though guidelines exist, there is no formula for its translation.
A quantitative method of data analysis draws meaningful results from a large body of data. For example, university examination database is very complex and quantitative in nature because it may contain data, images, etc. The results or consolidated mark list is an output from the quantitative data. This consolidation is a quantitative analysis.
Quantitative analysis allows report summary in numerical terms with certain degree of confidence. For example, a statement like “65% of the households use an unprotected water sources for drinking” may be with 95% confidence level. It is possible to conclude that with 95% confidence that more than 50% households has no access to a protected water source.
We have to summarize the quantitative and qualitative data in many ways. The information about quantitative data is measured in numerical values. For example, “Age of your parent”, “Number of pens you have”.
The information from the input data may not be accurately meaningful if it is considered as a quantitative data. For example, “colour of your skin”, “softness of your cake”. Figures 3.16 and 3.17 show difference between quantitative and qualitative data that performs a frequency distribution from 20 observations.

Fig. 3.16 Data over an interval of 20 population 1
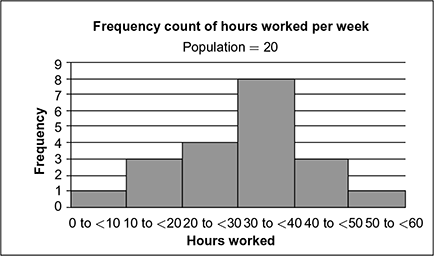
Fig. 3.17 Data over an interval of 20 population 2
3.5.2 Discrete and Continuous Data
Consider the data obtained from flipping a coin. We can observe that Head (H) or Tail (T) and rarely Edge (E) are the possible outcomes. Can we predict which is the outcome for the next toss?
Discrete data are a finite number of possible values in the above example, flip a coin and its recorded results have two possible outcomes: head (H) or tail (T). The observation is treated as discrete. For example, number of students in a class.
If there is no clear separation between possible values but occupied over a continuous range, then it is considered as continuous data.
For example, “Height of a person”, “Length of a leaf”, etc. Distance measured is an example of continuous data.
Km: 0.1…0.5…0.8…1.3…1.5…2.0 etc.
Size of a shoe is an example of discrete data because size may be 8 in, 9 in, 10 in, etc., but never 8.2 in.
3.5.3 Univariate and Bivariate Data
We are working with a group of people to measure their height. These heights can be measured in centimetres (cm). A list of height in cm:
160…152…163…175…181…164
This is univariate data; we only observe one aspect of a person at a time. In the case of bivariate, we are considering more than one aspect. We can plot the data into a table with rows and columns (Table 3.1). For example, height and weight of people can be tabulated.
Table 3.1 Height–weight table

The example is a bivariate observation regarding two aspects (height and weight).
Univariate analysis is a common statistical method available for calculating continuous variables: mean, mode, median, range of values, etc. Another common statistical operation is Standard Deviation (SD).
EXERCISES
- What are primary data? What is the difference between primary and secondary data?
- What are sources of secondary data? Can a secondary source considered as a primary source?
- What are schedules and its advantages in research methodology?
- How schedules differ from questionnaire?
- Explain different types of questionnaire methodologies.
- Explain the similarities between schedule and questionnaire.
- What are the advantages of questionnaire over other data collection methods?
- Explain the various sources of records review.
- How will you select open-ended questions while conducting an interview?
- What are closed questions? How closed questions are processed?
- How observation is useful in research design?
- Classify each set of data as discrete or continuous.
Number of boxes in a moving train
Height of Everest
Time taken for a car battery to die
Number of car manufactured by BMW in 2013
Production of rice by weight
Number of tails while flipping a coin
- Distinguish between discrete and continuous data.
- What are quantitative data? How it differ from quantitative data?
- Company employee details are given in Table 3.2.
How many of each category of staff should be included in a straight random sample of size?
Table 3.2 Home sales

- Classify each set of data as discrete or continuous.
- Number of children in a household
- Height of children
- Weight of cars
- Speed of trains
- Number of people in a train
- Weight of aeroplane
- Prepare a questionnaire limited to 10 questions to conduct a survey “Is Aadhar essential for people”?
- What are the major drawbacks of open-ended questionnaire?
- Prepare a questionnaire that shows the performance measurements of a class teacher who is handling the UGC post graduate classes.