
Understanding the operation of complex software often requires introspection that goes beyond the display of log information using println() statements and log4j output. You need the ability to step through a program statement-by-statement and view or modify the state of fields, method parameters, and local variables. Debugging tools that enable such control are common among most IDE and command-line development environments. However, Eclipse raises the bar with its excellent customizable debugging capabilities and additional workbench views.
Our debugging activities are focused on the product catalog project that was introduced in Chapter 2, “Hello Eclipse.” We initially ran the application within Eclipse using the Console view for command-line input and output. Now we will run the same project within the debugger, which enables detailed analysis of its control flow and state. If you are new to Java, and especially if you are new to object-oriented programming, stepping through your code in the debugger is an excellent way to understand how it runs.
In this chapter, we'll see how to
Start and customize a debug launch configuration
Use debug stack frames that provide execution context for variables and display expressions
Set breakpoints and step through program execution
Inspect and change values of fields, method parameters, and local variables
Use the Expressions view to watch variables during debugging
Assign Detail Formatters that customize object display when existing
toString()methods are inadequateUse hot code replacement to modify code without restarting the Java VM
Use a remote debugger connection to suspend and step through a Servlet running in a Tomcat server on another machine
You can use the debugging features in any perspective; however, the Debug Perspective is designed specifically to support these activities. It's easiest to start a new debug session from the Java Perspective and then switch to the Debug Perspective. Of course, you can move freely between perspectives at any time.
Start a debug session by right-clicking on the Main.java entry from the com.eclipsedistilled.catalog package in the Package Explorer view and selecting Debug > Java Application from the context menu. Alternatively, select Debug > Debug… from the context menu to open a dialog, as shown in Figure 7-1. Press the New button to create a new launch configuration for running the Main.java class. Press the Debug button to start a debug session.
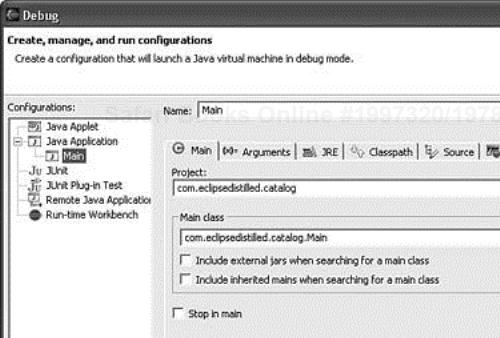
Our Main.java application does not require configuration because the project build path is used by default when running this program. However, you can launch and debug much more complex applications within the Eclipse workbench. Anything that can be run as a Java application (i.e., anything that has a main() method) can be run in the debugger, such as a Swing-based GUI application or a complete application server such as Tomcat or JBoss. The launch configuration dialog includes tabs for specifying command-line arguments, classpath locations, and environment variables needed to start the application. Other debug configurations are shown on the left side of this dialog for running Java Applets, JUnit tests, or a runtime instance of the Eclipse workbench itself used when debugging plug-ins.
After you have run an application, it appears in the list of recently run configurations under the Run and Debug toolbar menus. The Debug menu is shown in Figure 7-2 with one entry for Main (you can rename this entry in the configuration dialog, for example to Catalog App). Select Main to start the debug session, or select Debug… to open the configuration dialog and modify the launch parameters before starting. You can also press F11 to debug the previously launched configuration.
If we run this application before setting any breakpoints, it will look much like the way we ran it in Chapter 2. The Console view displays our messages and accepts user input from the command line. While waiting for user input, the application is blocked on the readLine() statement, but so far the Eclipse debugger has had no noticeable effect on the execution.
Now switch to the Debug Perspective by selecting Window > Open Perspective > Debug from the workbench window menu. You can use the perspective bar to switch between open perspectives; refer to Chapter 4, “Customizing Your Workbench,” for more information on customizing the workbench layout.
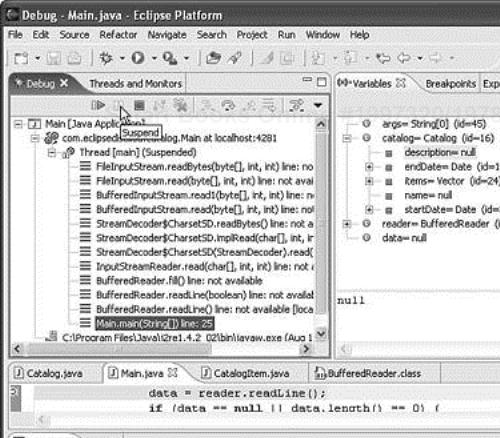
Start your debugging work by using the Console to add two products to the catalog. Now, press the Suspend button on the Debug view toolbar or pick Run > Suspend from the workbench menu. The debug views will appear, as shown in Figure 7-3. The application execution thread is suspended, and you can select any stack frame from the call stack in the Debug view. The Variables view shows fields, local variables, and method parameters for the selected frame. This figure shows an expanded view of the catalog field from a Main class instance.
You can add or remove breakpoints in the source code at any time. Add a breakpoint within the Java editor by double-clicking in the left ruler beside a line where you want a breakpoint. A blue ball appears to mark the breakpoint. If the class containing this breakpoint is loaded in the Java VM during an active debug session, then a checkmark is overlaid on the blue ball, as shown in Figure 7-4. If you create this same breakpoint before starting the debugger, then the marker will appear without a checkmark.
Now press the Resume button on the Debug view toolbar. Add a new catalog item in the console view and press the Enter key. The execution will suspend when it hits the breakpoint, displaying the views shown in Figure 7-5.
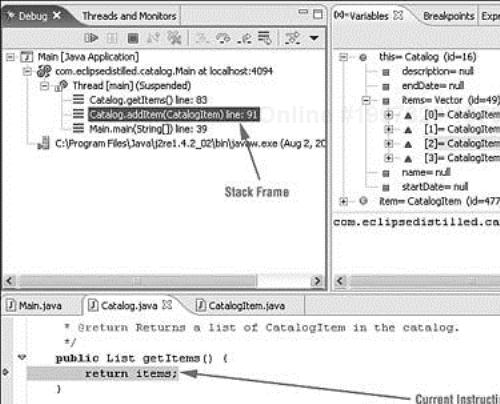
When a program thread is suspended, the Debug view shows one or more stack frames for that thread. A stack frame shows the execution context containing local variables and arguments for the method in that position of the call stack. This call stack is similar to the stack trace you receive when a program throws an exception, except that here the thread is suspended during execution.
As you step through a program's execution, the source code lines are highlighted to track your progress. Two kinds of progress steps are highlighted in Figure 7-5. The Current Instruction Pointer contains the statement that will be executed next when the thread resumes. The Debug Call Stack marks the line where the selected stack frame was suspended. In this example, we have selected a previous stack frame that shows the program state before stepping into the current statement, getItems(). Program step commands are described in the next section.
In the default Eclipse configuration, the current instruction pointer line is shown with a darker color than the call stack line. These colors are configurable on the preferences page Workbench > Editors > Annotations.
In Figure 7-5, the tooltip hover is displayed for the Show Logical Structure toolbar button. This command changes the way collections, such as the Vector class, are displayed in the Variables view. Instead of showing the fields of the Vector instance, its content is shown as a simple value list for easier viewing.
After execution has suspended on a breakpoint, there are several options for resuming or stepping through the program statement-by-statement. You can terminate a program at any time while it's running or suspended. Figure 7-6 shows the menu items available in the workbench Run menu when a program thread is suspended. The Suspend command is disabled for that thread because it is already suspended.
The first three commands provide the most general control:
Behavior of the step commands is relative to the stack frame for the selected thread in the Debug view. For all commands, the current line of execution in the selected stack frame is highlighted in the editor.
Step Into. Step into the next executed method. Stepping into a method causes the stack frame to grow by one.
Step Over. Finish execution of the current line and suspend on the next executable line.
Step Return. Step out of the current method. Execution resumes until a
returnstatement is executed in the current method.Run to Line. Resume execution up to the selected line. This is a convenient way to suspend execution at a line without setting a breakpoint.
Use Step Filters. When this command is toggled on, each of the step commands will apply the set of step filters that are defined in the user preferences page Java > Debug > Step Filtering. When a step action is invoked, stepping will continue until an unfiltered location is reached or a breakpoint is encountered.
If a breakpoint is encountered while performing a step operation, the execution will suspend at the breakpoint, and the step operation is ended.
The Run to Line command is not on the Debug view toolbar. Place your cursor on the line at which you want the program to be suspended. Select Run to Line from the workbench Run menu or the Java editor context menu, or press Ctrl+R. By default, Run to Line stops if a breakpoint is encountered before reaching the selected line (as with other step operations). However, there is a setting on the Run/Debug preferences page to skip breakpoints during Run to Line if you'd like to avoid this behavior.
The Variables view shows fields, local variables, and method parameters for the selected stack frame. The stack frame provides the execution context for these variables. Select one of these variables to display its value in the Details pane of this view—note that the Details pane at the bottom of this view is distinct from the Display view, although they have a similar purpose. If the variable contains an object, as opposed to a primitive, you can also expand that object to display its member variables. Refer to Figures 7-3 and 7-5, which display values of the Catalog member variables. The Display view is not open by default; open it while in the Debug perspective using the menu Window > Show View > Display. Please be aware of the difference between the Details pane and Display view in the following discussion.
The Details pane can also be used to evaluate code snippets. This evaluation occurs within the context of the selected variable, or if no variable is selected, then the selected stack frame context is used. You must be aware of this context because it determines the value of the identifier this and also determines which other variable names are available within the code snippet. In Figure 7-7 we entered a snippet to create a new Party instance, add a name (a Party can have multiple names), and assign this Party as the supplier for a CatalogItem. The setSupplier(p) method is evaluated in the context of the selected CatalogItem instance in the items Vector.
To execute this code snippet, do the following:
Select the desired
CatalogIteminstance within theCatalog itemsvariable.Select the entire expression in the Details pane; alternatively, you can select and execute only a subset of the text within this pane.
Right-click on the selected text and pick Execute from the context menu, or press Ctrl+U.
The value of the
supplierfield is updated immediately.
When a variable is a primitive or a String, you can simply enter the new value in the Details pane, select it, and pick Assign Value from the context menu. That menu item is disabled in Figure 7-7 because the current variable has a complex object type.
While typing in the Details pane, you can invoke Content Assist in the same way as in the Java editor. For example, type “P” and press Ctrl+Space to get a list of all classes beginning with P. You also can press Ctrl+Space on a blank line to get a list of all member variables and methods of the CatalogItem class. This works because the current context is determined by the CatalogItem variable selection. We used this technique to add setSupplier(p) to the code snippet.
The Display view, shown in Figure 7-8, serves as a scratch pad for code snippets and output results. The contents of this view are saved between Eclipse workbench sessions so you can use it to record and save several snippets used during debugging activities. To evaluate one of the expressions, select it and press one of the three view toolbar buttons to Inspect,Display , or Execute that expression. Alternatively, right-click on the selected text and pick one of these commands from the context menu, or use the shortcut keys.
Figure 7-8. Display view containing several code snippets, one of which is evaluated to display its output.
Selecting the Display command will insert the result into this view on the line following the expression, as shown for the getStartDate() expression in Figure 7-8. When evaluating an expression in this view, it will run within the execution context of the stack frame selected in the Debug view. The stack frame must be bound to a Catalog instance for the getStartDate() expression to be executed. Other snippets in this view have different requirements for execution context. The first snippet executes in the context of a CatalogItem instance.
The Display view also provides an output area for results of expressions evaluated in other views. Select an expression in a Java editor, right-click on the selected text, and pick Display from the context menu, or press Ctrl+Shift+D (Ctrl+Shift+V on Linux). The current value of this expression in a suspended debug thread is displayed in a pop-up window, as shown in Figure 7-9. Press Ctrl+Shift+D again to copy this output into the Display view.
Figure 7-9. Open a pop-up Display window for an expression selected in a Java editor while debugging.
You can also Inspect the value of an expression to study a result that returns a complex object structure. Select an expression in a Java editor, in the Display view, or in the Variables view and pick Inspect from the context menu, or press Ctrl+Shift+I. When selected in the Java editor, a pop-up window similar to Figure 7-10 is opened. Press Ctrl+Shift+I again to move this result into the Expressions view, as shown in Figure 7-11.
Figure 7-10. Open a pop-up Inspector window for an expression selected in the Java editor while debugging.
The Expressions view accumulates references to several expressions that you want to inspect or watch while debugging your code.
An inspected expression might be a field in one of the objects from the execution context or an expression selected in the Java Editor. An inspected value might be “live” if it holds an object whose fields are updated as you step through your code.
A watch expression displays the result of an expression that is reevaluated each time a thread is suspended. Right-click in the Expressions view and choose Add Watch Expression to create a new entry.
The Expressions view in Figure 7-11 contains one watch expression, catalog.getItems().size(), and one inspected expression, items. These types of expressions are displayed with different icons in the view. This particular view content was displayed while the thread was suspended, so the watch expression shows a value of “3”; while running, this value is not shown.
The Expressions view includes a Details pane for viewing values of selected fields or for evaluating expressions as we did in the Variables view. In both the Variables and Expressions views, you can use commands in the view menu to position the Details pane at the bottom or right side, or to hide the Details pane altogether.
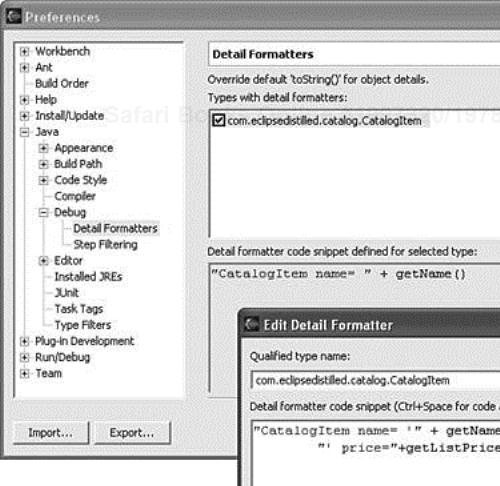
When a value is shown in a Details pane or the Display view, it is produced by the toString() method of the displayed object. However, sometimes you need different output displayed, especially when you don't have source code for a third-party class. In these cases, you can add a Detail Formatter that produces an alternate toString() value.
Figure 7-12 shows the preferences page for Java > Debug > Detail Formatters. You can add a custom formatter for any class used while debugging. In this figure, we are editing a formatter to modify its code snippet to include more detail while displaying an instance of CatalogItem. You can define several formatters in your preferences and enable or disable their use with the check box beside each formatter. Detail Formatters may be added, enabled, or disabled at any time during a debug session.
While debugging a large application, you may create many breakpoints that are spread across several projects. The Breakpoints view provides a list of all breakpoints set in your workspace. This view, shown in Figure 7-13, allows you to enable or disable each breakpoint, remove one or all from your code, or set the number of times a breakpoint must be hit before it causes your application to be suspended.
Another helpful feature of the debugger is Add Java Exception Breakpoint, accessible by clicking the J! icon in the Breakpoints view toolbar. Use this type of breakpoint when you don't know what code is causing an exception to be thrown. For example, if you set a breakpoint for NullPointerException (NPE), the debugger breaks exactly at the point before the NPE occurs. This is particularly helpful when debugging other developers' code. When you get an NPE, don't bother searching for the cause, just enable the NPE breakpoint!
Select the Properties… command from the context menu in the Breakpoints view to modify the characteristics of the selected breakpoint. This dialog is shown in Figure 7-14. You can check the option to Enable Condition and enter a Java expression that will be evaluated at runtime, using fields or variables available at this breakpoint's position in the code. In this example, we have specified that the breakpoint will be activated only when more than one name has been assigned to a Party object.
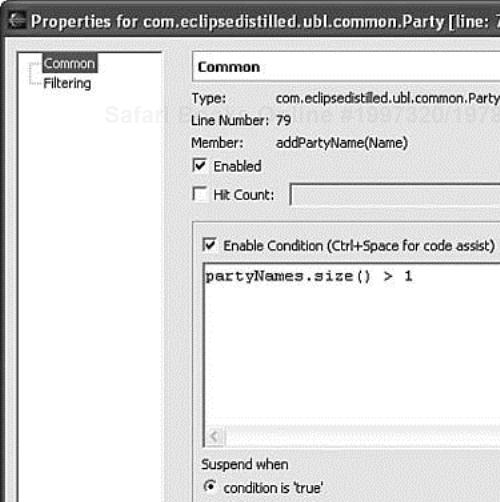
Another option is to choose Suspend when value of condition changes. Using an expression of partyNames.size() would then suspend execution any time this list is modified. More complex expressions are also possible in the conditional breakpoint. You can use the following expression, and the breakpoint will be activated any time a Party includes a name containing “IBM”.
Iterator i = partyNames.iterator();
while (i.hasNext()) {
    Name name = (Name)i.next();
    if (name.getValue().indexOf("IBM") != -1)
        return true;
}
return false;
One of the most powerful aspects of the Eclipse debugger is the ability to change code in the midst of a debug session, without stopping and restarting the Java VM. This is called hot code replacement because no restart is required. It is enabled by default when you install Eclipse, but it can be customized using the Java > Debug preferences page, as shown in Figure 7-15.
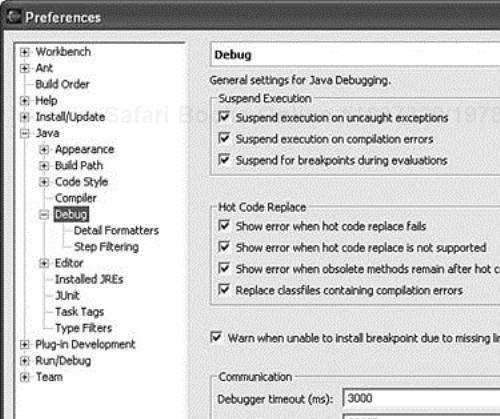
Hot code replacement was added as a standard technique in Java VM specifications to facilitate experimental development and to foster trial-and-error coding. The Eclipse debugger supports Hot Code Replace when running with a 1.4.1 or later Java VM, or the IBM J9 VM. This lets you make changes to code that you are currently debugging. However, there are restrictions on what changes can be hot swapped, depending in part on the support provided by a particular VM.
Generally, replacement only works when the signature of existing classes does not change:
You can add new classes.
You can change the body of a method.
You cannot add or remove fields to existing classes or change their types after those classes are loaded in the VM.
You cannot add or remove methods to existing classes or change their signatures (name, parameters, return type, or visibility) after those classes are loaded in the VM.
You cannot add or remove inner classes.
However, this list depends on the VM being used. When future VMs are available that expand hot code replacement, the Eclipse debugger will automatically use those new features. In spite of these limitations to hot code replacement, this feature of the Eclipse debugger provides a large productivity boost when debugging applications. You can fine-tune the logic of method calculations, modify the layout and content of GUI windows, or modify many other aspects of application logic without violating the constraint of changing class signatures.
Your debug process is set up in the launch configuration shown in Figure 7-1. You can choose which JRE is used to run the application and specify the arguments, classpath, and environment variables used when starting it. You can inspect the command line used to launch a process by selecting it in the Debug view and choosing Properties from the context menu. The dialog shown in Figure 7-16 is opened to display the process information.
The -classpath argument is highlighted to show that it includes only the bin directory of our com.eclipsedistilled.catalog project. If this project had other dependencies or required libraries, they would also be included in this argument value, along with any other customizations in the launch configuration.
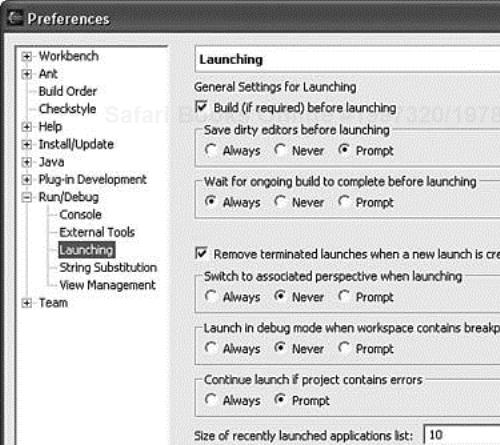
Other settings affecting the launch configuration may be changed in the Run/Debug > Launching preference page, shown in Figure 7-17. The Remove terminated launches when a new launch is created option is enabled by default; it's sometimes useful to disable this option if you want to keep a trace of the old runs.
The client/server design of the Java debugger allows you to launch a Java program from a computer on your network and debug it from Eclipse running on your workstation. This is particularly useful when you are developing a program for a device that cannot host the Eclipse IDE or one that is shared by several developers. It is also useful when debugging programs on dedicated machines such as J2EE application servers.
To debug a program remotely, you must be able to launch the program in debug mode on the remote machine so that it will wait for a connection from your debugger. The technique for launching the program and connecting the debugger are specific to the JVM you are running. The basic steps are as follows:
Ensure that you are building your Java program with available debug information. You can control these attributes from the Compliance and Classfiles tab of Window > Preferences > Java > Compiler.
After you build your Java program, install it to the target computer. This involves copying the
.classfiles or JAR files to the appropriate location on the remote computer.Invoke the Java program on the remote computer using the appropriate JVM arguments to specify debug mode and a communication port for the debugger.
Start the debugger in your Eclipse workbench using a remote launch configuration that specifies the address and port of the remote computer.
We'll use the remote debugger to step through a Servlet running on a remote Tomcat application server. This example uses version 5.0.19 of Tomcat (jakarta.apache.org/tomcat). Installing the server is simply a matter of unzipping the distribution file, such as to C:jakarta-tomcat-5.0.19 on Windows. We'll use the servlets-examples Web application included with Tomcat to review use of the remote debugger.
The Eclipse New Java Project wizard makes it very easy to create a project using the Tomcat example. Start the wizard and select the option to Create project at external location, as shown in Figure 7-18. Enter a project name “tomcat-examples”. Set the project location by browsing to servlets-examples within the server's webapps folder.
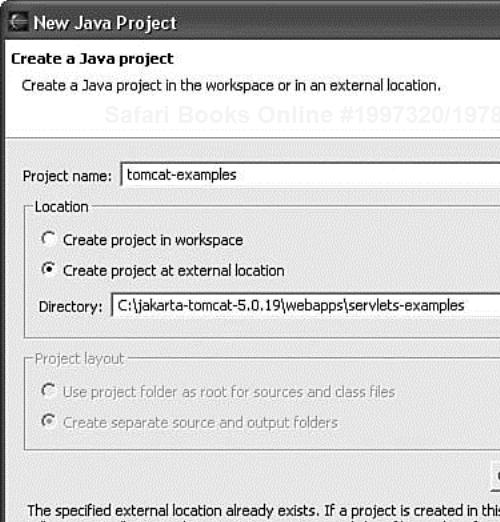
Figure 7-18. Create a new Java project using an external location for the Tomcat servlets-examples Web application.
This Tomcat example includes all Java source code within the WEB-INF/classes folder in the same location as the compiled class files. The New Project Wizard will analyze the project subdirectories and configure directories containing Java source files as source folders in your new project. For this project's structure, the wizard defaults work perfectly.
You also need to configure this project with a library containing the standard Java Servlet APIs that are used when writing any Servlet. You can click the Next button in the wizard and use the Libraries tab to select the JAR location while creating the project, or set the project's properties after creating it. See Chapter 6, “Java Project Configuration,” for a detailed explanation of configuring Java project libraries. The required library is found in the Tomcat server installation location common/lib/servlet-api.jar. You can select this JAR location, or preferably as described in Chapter 6, create a subfolder containing standard J2EE libraries in our shared libraries project.
The resulting project is shown in Figure 7-19. Notice how the wizard correctly assigned WEB-INF/classes as both the source and output folder location. Now open the RequestParamExample.java file and set a breakpoint within the doGet() method that is executed when the Servlet is invoked.
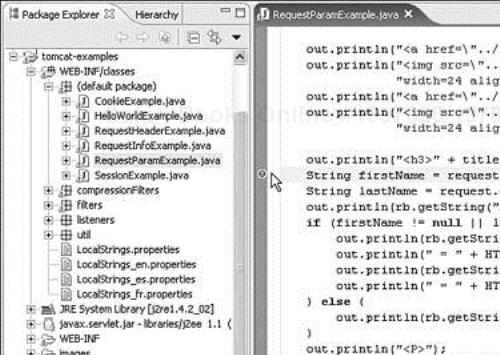
You would not keep your Java source code in the application server WEB-INF directory in normal development configurations, but this structure is used by the Tomcat examples for simplicity. It works well for our exploration of remote Java debugging.
A Remote Java Application launch configuration must be used when debugging an application that is running on a remote JVM. Because the application is started on the remote system, the launch configuration does not specify the usual information about the JRE, program arguments, or classpath. Instead, information about connecting to the application is supplied, as shown in Figure 7-20.
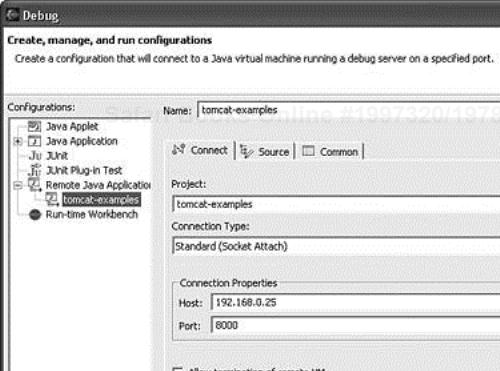
In the Project field of the Connect tab, type or browse to our new tomcat-examples project. The project used to launch a remote debugger determines the source file location; you can also configure additional source folders in the Source tab of the debug configuration.
In the Connection Properties fields, enter the host and port used to connect to the Tomcat server. This is not the port used when connecting from a Web browser (e.g., 8080); this is the port used by the JVM for remote debug connections. This port must be configured in the Tomcat startup script. You need to edit two lines of the bin/catalina.bat script if Tomcat is running on Windows. If running on Linux, the defaults are already set this way in bin/catalina.sh.
The first line of these two excerpts, prefixed with rem, is the original setting. Change the two lines as follows in bin/catalina.bat:
rem set JPDA_TRANSPORT=dt_shmem
set JPDA_TRANSPORT=dt_socket

rem set JPDA_ADDRESS=jdbconn
set JPDA_ADDRESS=8000
Now start the Tomcat server using this command on Windows:
bin/catalina.bat jpda start
Or this command on Linux:
bin/catalina.sh jpda start
The jpda option tells Tomcat to listen for debugger connections on port 8000, or whatever port you configured on the startup script. This port must be the same as the one used in the Eclipse launcher shown in Figure 7-20.
If you are running Tomcat on the same machine as your Eclipse workbench, then you can use localhost as the host name in Figure 7-20. This is still a “remote” debugging session when using localhost. Figure 7-20 shows a remote host IP address, where Tomcat is running on 192.168.0.25. You can also enter a remote host name here if the machine has a known name on your network.
Everything is ready to begin our remote debugging session. If you are running Tomcat on your local machine, substitute the IP address with localhost in these steps:
Start Tomcat on the remote machine.
Start the
tomcat-exampleslaunch configuration from the Debug toolbar menu in your workbench.Open a Web browser to the Tomcat home page using
http://192.168.0.25:8080(substitute your Tomcat server host address or name).Click on the Web page link for Servlet Examples and then execute the Request Parameters example.
Enter parameter values into the Web form shown in Figure 7-21 and press Submit Query.
The breakpoint will be activated in your Eclipse workbench, and the Tomcat server thread will be suspended, as shown in Figure 7-22.
Use debugger commands to step through the Servlet execution and review state changes in the Variables view.
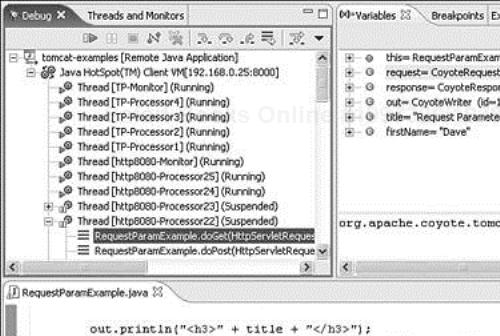
This example also provides a good illustration of debugging multithreaded applications. When Eclipse connects to the Tomcat server, the Debug view shows a list of Running threads in the server thread pool. When you submit a Web page to the Servlet, one of the threads is changed to Suspended. While stepping through that thread in the debugger, go back to the Web page and submit the form again. A second thread will be Suspended, and you can switch between debugging these two threads in the Debug view. In Figure 7-22, you see a second Suspended thread immediately above the thread we are debugging.
The Eclipse Web Tools Platform (WTP) will provide new plug-ins for starting, stopping, and publishing Web applications to a server from within the workbench. The plan for these tools is presented in Chapter 1, “A Java IDE and So Much More!” WTP is used when developing Web applications, although the remote debugging capabilities will be needed when you debug applications running within a dedicated test server.
The Debug Perspective includes several views specialized for debugging activities: a Debug view of running threads and, when suspended, their stack frames; Variables, Expressions , and Display views for exploring object state; and a Breakpoints view for managing a list of all breakpoints in your code.
After execution has stopped on a breakpoint, there are several options for resuming or terminating execution, or stepping through the program statement-by-statement.
The Variables view shows fields, local variables, and method parameters for the stack frame selected in the Debug view. The stack frame provides the execution context for these variables.
You can evaluate code snippets that display, inspect, or update program state. Pop-up windows may be used to display or inspect selected expressions within a Java editor during a debug session.
You can assign a Detail Formatter that defines a customized output string used to display values of any class during debugging. This formatter overrides a class's
toString()method.Hot Code Replace facilitates experimental development by allowing you to make changes to code in the midst of a debug session without restarting the Java VM.
The client/server design of the Java debugger allows you to launch a Java program from a computer on your network and debug it from Eclipse running on your workstation.