
Chapter 4. Debugging
Let’s face it: all but the most trivial programs have bugs in them. Eclipse provides a powerful debugger to help you find and eliminate those bugs quickly. This part of the book will give you a head start in understanding how to use the Eclipse debugger.
Running the Debugger
Running your program under the control of the debugger is similar to running it normally. Right-click on the file containing your main method (Hello.java) and select Debug As → Java Application. Or, if you have run or debugged the program before, just press F11 (or select Run → Debug Last Launched), or click on the Debug button (![]() ) in the main toolbar.
) in the main toolbar.
Go ahead and try that now. What happened? The program ran to completion and sent its output to the Console view just as if you had run the class normally. You have to set a breakpoint to actually take advantage of the debugger.
Setting Breakpoints
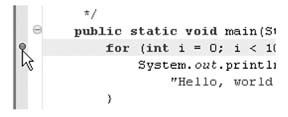
A breakpoint is a marker you place on a line of code where you want the debugger to pause execution. To set one, double-click in the gutter area to the left of the source line. For this example, we want to stop on the System.out.println() call, so double-click in the gutter next to that line. A breakpoint indicator will appear, as shown in Figure 17.
Now, press F11 and Eclipse will run your program again in debug mode. The breakpoint indicator will change when the class is loaded, and the debugger will stop at the line where you added the breakpoint.
Tip
One of the nice things about breakpoints in Eclipse is that they stay with the line even if the line number changes (e.g., due to code being added or removed above it).
When the breakpoint is reached and the program stops, you’ll notice several things. First, Eclipse will switch to the Debug perspective. If you see a dialog asking to confirm the perspective switch, select “Remember my decision” and click Yes.
Tip
Using one perspective for coding and another for debugging is optional, but some people like being able to customize their window arrangement for each task. You can disable this switching in the Run/Debug preferences (Window → Preferences → Run/Debug).
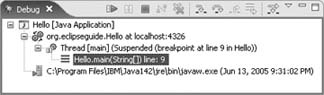
Next, several new views will open—most importantly, the Debug view (see Figure 18). This view lets you control all the threads of execution of all the programs being debugged. Finally, the line of code where you put the breakpoint will be highlighted to indicate which line will be executed next.
To continue running after a breakpoint, click on the Resume button in the Debug view’s toolbar (![]() ) or press F8 (Run → Resume). Execution will continue until the next breakpoint is hit or the program terminates.
) or press F8 (Run → Resume). Execution will continue until the next breakpoint is hit or the program terminates.
Tip
If your program is in a long-running loop, click on the Suspend button (![]() ) or select Run → Suspend to make it stop. Or, just add a new breakpoint at any time—the program does not have to be stopped.
) or select Run → Suspend to make it stop. Or, just add a new breakpoint at any time—the program does not have to be stopped.
You can see a list of all your breakpoints in the Breakpoints view. Here you can enable and disable breakpoints, make them conditional on certain program values, or set exception breakpoints (i.e., to stop when a Java exception is thrown).
Single Stepping
Like most debuggers, the one provided by the Eclipse IDE lets you step line by line through your program with one of two commands:
step into (![]() ; F5; or Run → Step Into) and
step over (
; F5; or Run → Step Into) and
step over (![]() ; F6; or Run → Step Over). The difference between the two is apparent when the current line is a method call. If you step into the current line, the debugger will go to the first line of the method. If you step over the current line, the debugger will run the method and stop on the next line.
; F6; or Run → Step Over). The difference between the two is apparent when the current line is a method call. If you step into the current line, the debugger will go to the first line of the method. If you step over the current line, the debugger will run the method and stop on the next line.
Try stepping now, by running until your breakpoint is hit and then pressing F6 several times in a row. Watch the highlight bar move around as the current line changes.
If you step into a method call and then change your mind, execute the
step return command (![]() ; F7; or Run → Step Return). This lets the program run until the current method returns. The debugger will stop at the line following the line that called the method.
; F7; or Run → Step Return). This lets the program run until the current method returns. The debugger will stop at the line following the line that called the method.
Looking at Variables
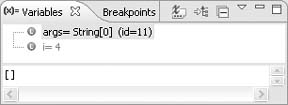
The Eclipse IDE provides many different ways to examine and modify your program state. For example, as you single step, you may have noticed that the Variables window shows the current value of all the local variables, parameters, and fields that are currently visible (see Figure 19). You can quickly identify which variables are changing because Eclipse draws them in a different color. If any of the variables are nonprimitives (objects or arrays), you can expand them to look at the individual elements.
To change the value of a variable, first select it in the Variables view. This will make its current value appear in the bottom half of the window, where you can change it. Save the new value by pressing Ctrl+S (or right-click and select Assign Value).
Tip
When you are coding, try to use the smallest possible scope for your local variables. For example, instead of declaring all your variables at the top of a function, declare them inside the statement blocks (curly braces) where they are actually used. Besides being a good programming practice, this will limit the number of items displayed in the Variables view.
Another way to see the value of a particular variable is to move your cursor over it in the source editor. After a short pause, a tool tip window will appear with the value. See Figure 20 for an example.

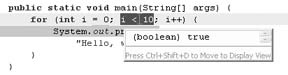
What if you need to see the value of a Java expression? No problem: just use the mouse or keyboard to select the expression in the editor, then press Ctrl+Shift+D (or right-click and select Display). Eclipse will evaluate the expression (including any side effects) and show the results in a pop-up window (see Figure 21). The expression can be as simple or as complicated as you like, as long as it’s valid.
For compound objects like class instances, you may want to try the Inspect command (Ctrl+Shift+I, or right-click and select Inspect) instead of Display. This will let you expand items and collapse members as in the Variables view.
Changing Code on the Fly
Eclipse blurs the line between editing and debugging by letting you modify a running program. You don’t have to stop the program—just edit and save it. If possible, Eclipse will compile just the class that was modified and insert it into the running process. This handy feature is called hot code replace.
Tip
If you modify a method that the program is currently executing, the debugger will have to drop to the previous frame and begin that method again from its first line. This doesn’t work on the main() method because there is no caller.
Some kinds of changes can be made on the fly and some cannot. Simple things (like fixing an expression formula, changing comments, adding new local variables, adding new statements to an existing method, etc.) should work fine. If for some reason execution cannot continue, you will get an error dialog with the option to continue without making the change, terminate the program, or terminate and restart it from the beginning.
Tip
Hot code replace requires special support from the Java virtual machine that is not present in all versions of Java. It’s known to work in Sun’s Java Version 1.4.2 and later, but not all vendors support it. If your Java version does not support it, you’ll get an error dialog when you try to save.
The debugger has so many features that it’s impossible to cover them all here. Part VI covers more advanced topics that impact running and debugging your program, especially in the “Launch Configurations” section. But in your first pass through this book, you may want to continue with Part V, which covers unit testing. Later, you can go to Part VII to find out what all those buttons in the Debug and Breakpoint views do.
The Eclipse online help is also a good resource for information on running and debugging. See the following sections in the User’s Guide (Help → Help Contents → Java Development User Guide):
Concepts → Debugger
Tasks → Running and debugging