3
Steady Shear Rheological Properties of Emerging Hydrocolloids
Fataneh Behrouzian and Seyed M.A. Razavi
Food Hydrocolloids Research Center, Department of Food Science and Technology, Ferdowsi University of Mashhad, PO Box: 91775‐1163, Mashhad, Iran
3.1 Introduction
Application of new hydrocolloids is very limited, which may be attributed to the necessity for further investigation of their rheological properties. Today, there is a great interest in combining low cost with proper functionality and, especially, well‐characterized natural hydrocolloids. To meet the demand for these ingredients, significant efforts have been devoted to find new structure‐functionality relationships [1]. Rheology of materials may be described as the study of their deformation and flow when exposed to a stress or strain. The flow properties of a fluid can be defined using the relationship between shear stress (τ) and shear rate (![]() ) in a steady shear laminar flow [2]. Rheological experiments measure properties that can be related to structural elements in materials. Understanding of flow behavior is essential for optimizing product development, processing conditions, and product quality [3]. The rheological behavior of hydrocolloids can be significantly affected by variables such as shear rate, shear history, and time of shearing [4]. Under flow conditions, the network of hydrocolloids is disrupted into smaller structures or aggregates, and structural viscosity is the major characteristic reflecting its rheological behavior [5].
) in a steady shear laminar flow [2]. Rheological experiments measure properties that can be related to structural elements in materials. Understanding of flow behavior is essential for optimizing product development, processing conditions, and product quality [3]. The rheological behavior of hydrocolloids can be significantly affected by variables such as shear rate, shear history, and time of shearing [4]. Under flow conditions, the network of hydrocolloids is disrupted into smaller structures or aggregates, and structural viscosity is the major characteristic reflecting its rheological behavior [5].
Some hydrocolloids have found their place in the market and have been used in many food formulations. The choice of hydrocolloids in food systems is based on their functions, which are determined by their molecular characteristics (e.g., molecular weight, conformation, flexibility, polarity, hydrophobicity, and interactions) and are associated with their rheological behaviors. So, introducing the novel hydrocolloids and their similarity to the generally used hydrocolloids on the basis of some specific rheological properties could be beneficial to rationally designed structural features in food systems.
Clustering is a part of pattern recognition theory, which aims to summarize information by grouping data in categories or classes. The members are as similar as possible in each class, while being as different as possible from other class members. The hierarchical clustering algorithm is one of the clustering techniques and is classified into agglomerative hierarchical and divisive hierarchical methods [6]. Agglomerative hierarchical clustering is suitable for representing the original data set in the feature space at multiple levels of abstraction since each clustering level results in an abstract representation of the original data set [6]. Clustering has been successfully applied in different fields of the food industry [ 6–8].
Guar gum (GG), pectin (PE), and xanthan gum (XG) are three frequently used hydrocolloids in food systems. GG, which is obtained from guar (Cyamopsis tetragonoloba) seeds, contains linear chains of D‐mannopyranosyl units with a D‐galactopyranose substituent protruding by (1 → 6) linkages. It has the specific structure of galactomannans with 1.3 × 10³ kDa molecular weight and 12.5 dl g−1 intrinsic viscosity [9]. XG, with 4.05 × 10³ kDa molecular weight, is an extracellular polysaccharide extracted from Xanthomonas campestris. This gum consists of a cellulose backbone attached with a charged trisaccharide side chain composed of a glucuronic acid residue between two mannose residues [10]. Using the Tanglertpaibul and Rao equation, Higiro et al. [10] reported 214.21 dl g−1 intrinsic viscosity for XG. PE with a heteropolysaccharides structure originates in most plant tissues. It consists of α‐(1–4)‐D‐galacturonic acid units, interrupted by the insertion of rhamnose units and with side chains of neutral sugars attached to the backbone. Natural PEs are usually highly methoxylated (HM) with more than 50% of the esterified carboxyl groups. The intrinsic viscosity of HM PE was reported as 15 dl g−1 [11]. Many studies reported a slightly stiff conformation for the PE macromolecules [12].
The literature has established the high potential of sage seed gum (SSG) and cress seed gum (CSG) as emerging hydrocolloids to be used in food formulations. Sage seed (Salvia macrosiphon) swells in water and produces mucilage. The weight‐average molecular weight of SSG polysaccharides ranges from 4 × 10² to 1.5 × 10³ kDa [13,14]. It is a polyelectrolyte galactomannan hydrocolloid (1.78–1.93:1 mannose/galactose ratio and 28.2%–32.2% uronic acids) with 22.55 dl g−1 intrinsic viscosity [14]. CSG exists in the outer layer of the garden cress plant seed (Lepidium sativum L.). The macromolecular component has a molecular weight of 540 kDa and possesses a semi‐rigid chain conformation [15]. This polyelectrolyte galactomannan (8.2 mannose/galactose ratio and 15% uronic acids and 13.3 dl g−1 intrinsic viscosity) has been introduced as novel thickening, gelling, and emulsifying agent [16–19].
In this chapter, initially, flow patterns were evaluated for all gum dispersions. Then, the power‐law and Moore models were applied to understand the flow properties of SSG and CSG and compare them with three commercially used food biopolymers of XG, PE, and GG. To illustrate how structure and flow properties are related with time, we applied four procedures: hysteresis loop, shear stress decay, in‐shear structural recovery, and the time dependency of steady shear properties measurements. Two types of yield stress, which are related to the two types of structure in a thixotropic fluid, that is, static and dynamic yield stresses (DYSs), were determined and discussed. Besides, the range of short and long time scales yields stresses, and the corresponding time intervals were compared among different gum systems. Finally, to categorize all hydrocolloids, the similarity of the rheological properties of gums was investigated using the hierarchical clustering technique and principal component analysis (PCA) in a serial mode. These comprehensive steady shear rheological measurements of SSG and CSG, and their comparison with commercialized food hydrocolloids, help us to better decide on the final usage of the former hydrocolloids. Despite much progress on SSG and CSG, as hydrocolloids are still limited to only several types, it is necessary to achieve a more complete understanding of their rheological properties to meet the food industry demands.
3.2 Time‐Independent Rheological Properties
The steady shear flow behavior of selected gum dispersions (1%) was evaluated at constant temperature (20 °C) using a Physica MCR 301 rheometer (Anton Paar, GmbH, Graz, Austria) equipped with cone‐plate geometry (4° cone angle, 50 mm of diameter, and 1 mm gap). The shear stress was measured at a logarithmically increasing scale of shear rate from 0.01 to 700 s−1. Also, the apparent viscosity at a given shear rate was calculated as the ratio of the shear stress to the shear rate [20]. Except GG, other gum dispersions exhibited a three‐stage apparent viscosity versus shear rate response when sheared over a wide shear rate range. According to Table 3.1, shear‐thinning behavior was observed for all tested dispersions. This behavior has been reported for many hydrocolloid solutions, due to the formation of a dispersion of aggregated polymers and their high molecular weight [21]. At lower shear rates, the apparent viscosity exhibits a Newtonian plateau, and except for GG, with a further decrease in the shear rate, the shear‐thickening region appeared. The length of each region was quite different for all gum dispersions. XG showed the highest length of the shear‐thickening region among all gum dispersions. It is well known that the thickening behavior could be the result of a stiffer inner structure due to the formation of entanglements of polymer coils and the increase in intermolecular interactions with an increase in the shear rate [22]. Liu et al. [23] stated that “flow‐induced formation of macromolecular associations” were the mechanism for the shear‐thickening behavior. On the other hand, GG showed the highest length of the Newtonian region among all gum dispersions, from 0.01 to 1.268 s−1. In the low‐shear Newtonian stage, there is little rearrangement of the polymer chains and replacement of disrupted entanglements by new entanglements, whereas in the shear‐thinning stage, the chains undergo continuing rearrangement with an increase in the shear rate, which is caused by the disentanglement of the polymer coils in solution or alignment of the polymer coils in the flow direction [24]. Shear thinning begins when the rate of disentanglement becomes greater than the rate of their reformation, and consequently the viscosity is reduced [25]. The critical shear rate (![]() c
, the shear rate at which the shear stress starts to decrease with an increase in the shear rate) of gum dispersions was on the order of GG > CSG > XG > Pe > SSG (Table 3.1). It has been accepted that when a small‐particle‐sized dispersion encounters shearing, the effect of Brownian motion lasts longer along the shear rate axis, and higher values of shear rate are required to initiate the shear‐thinning stage [26].
c
, the shear rate at which the shear stress starts to decrease with an increase in the shear rate) of gum dispersions was on the order of GG > CSG > XG > Pe > SSG (Table 3.1). It has been accepted that when a small‐particle‐sized dispersion encounters shearing, the effect of Brownian motion lasts longer along the shear rate axis, and higher values of shear rate are required to initiate the shear‐thinning stage [26].
Table 3.1 Three different shear rate ranges observed in the steady shear flow behavior of sage seed gum (SSG), cress seed gum (CSG), xanthan gum (XG), pectin (PE), and guar gum (GG) (1%, 20 °C, and 0.1–700 s−1).
| Gum | Shear thickening (s−1) | Newtonian (s−1) | Shear thinning (s−1) | Critical shear strain (s−1) |
| XG | 0.010–0.025 | 0.025–0.030 | 0.030–700 | 0.030 |
| GG | — | 0.010–1.268 | 1.268–700 | 1.268 |
| PE | 0.010–0.013 | 0.013–0.020 | 0.020–700 | 0.020 |
| SSG | 0.010–0.013 | 0.013–0.017 | 0.017–700 | 0.017 |
| CSG | 0.010–0.019 | 0.019–0.070 | 0.070–700 | 0.070 |
In the shear‐thinning region, the effect of the shear rate ranges on the decreasing order and decreasing ratio of the apparent viscosity for different gum dispersions was investigated, and the results are illustrated in Figures 3.1 and 3.2, respectively. It can be seen that, except for GG, the highest extent of viscosity reduction for all gum dispersions occurred at 0.01–0.1 s−1. At this range, PE with 81.07% and 6.19 times viscosity reduction showed the highest shear‐thinning behavior. More than 94% of the total shear‐thinning behavior of SSG, XG, and PE was occurred in the range 0.01–1 s−1, while this value was 44.75% for GG and 81.73% for CSG. GG showed almost uniform viscosity reduction at all shear rate ranges, suggesting it has the least shear‐thinning behavior among other gums. In the largest shear rate range (0.01–700 s−1), SSG, XG, and PE showed a higher ratio of apparent viscosity reduction in comparison with CSG and GG.
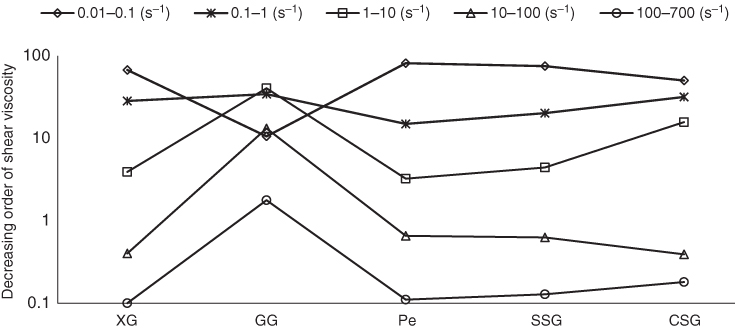
Figure 3.1 Effect of shear rate range on the decreasing order of shear viscosity of sage seed gum (SSG), cress seed gum (CSG), xanthan (XG), pectin (PE), and guar gum (GG) (1%, 20 °C, and 0.1–700 s−1).
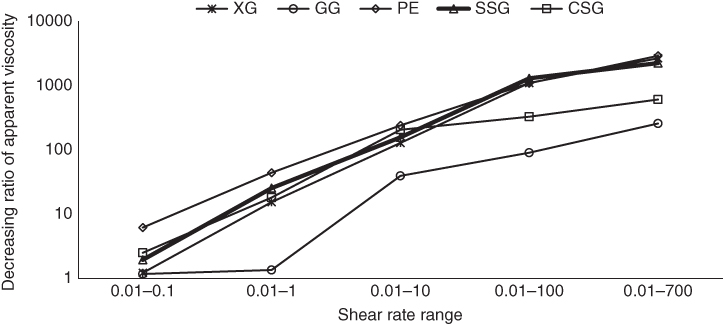
Figure 3.2 Effect of shear rate range on the decreasing ratio of shear viscosity of sage seed gum (SSG), cress seed gum (CSG), xanthan (XG), pectin (PE), and guar gum (GG) (1%, 20 °C, and 0.1–700 s−1).
Above the critical shear rate, shear stress‐shear rate data were fitted using a well‐known power‐law model, Eq. 3.1 [20]. Also, the Moore model was selected to fit the apparent viscosity‐shear rate data, Eq. 3.2 [24]:
where τ is the shear stress (Pa), ![]() is the shear rate (s−1),
k
P
is the power‐law consistency coefficient (Pa sn), and n
p
is the power‐law flow behavior index (dimensionless)
is the shear rate (s−1),
k
P
is the power‐law consistency coefficient (Pa sn), and n
p
is the power‐law flow behavior index (dimensionless)
where λ is the Moore relaxation time (s), η 0M is the limiting zero‐shear viscosity (Pa s), and η ∞M is the limiting infinite‐shear viscosity (Pa s). The magnitudes of parameters that obtained from the Moore model ( η 0M , η ∞M , and λ ) are shown in Table 3.2, and the k P , n P trends are depicted in Figure 3.3. Power‐law and Moore models adequately fitted the shear stress versus shear rate and shear viscosity versus shear rate data for each hydrocolloid, respectively (R2 = 0.85–0.93 and RMSE = 0.05–0.18).
Table 3.2 The rheological parameters of the Moore model determined for sage seed gum (SSG), cress seed gum (CSG), xanthan (XG), pectin (PE), and guar gum (GG) (1%, 20 °C, and 0.1–700 s−1).
| Moore model | |||
| Gum | η 0M (Pa s) | η ∞M (Pa s) | λ (s) |
| XG | 962.46a ± 17.73 | 0.07c ± 0.01 | 53.46a ± 12.23 |
| GG | 18.83d ± 0.51 | 0.36bc ± 0.06 | 0.76c ± 0.12 |
| PE | 439.57b ± 96.49 | 1.41a ± 0.77 | 65.29a ± 4.09 |
| SSG | 116.91c ± 28.59 | 0.42b ± 0.23 | 73.88a ± 27.92 |
| CSG | 16.90d ± 0.99 | 0.07c ± 0.05 | 14.81b ± 2.94 |
a–d: Means followed by the same letters in the same column are not significantly different (P > 0.05).
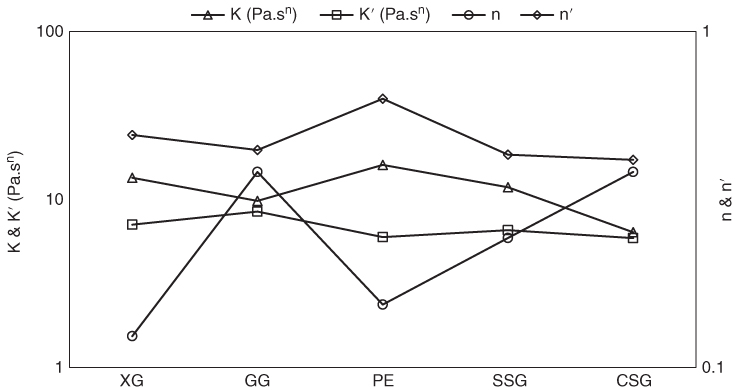
Figure 3.3 Power‐law flow behavior parameters of presheared (k and n) and unpresheared (k′ and n′) samples of sage seed gum (SSG), cress seed gum (CSG), xanthan (XG), pectin (PE), and guar gum (GG) (1%, 20 °C, and 0.1–700 s−1).
As seen in Figure 3.3, the flow behavior index of all samples ranged between 0.124 and 0.382, confirming a strong shear‐thinning behavior of the selected gums. As compared to other hydrocolloids, XG and PE with the lowest flow behavior indexes showed the highest shear‐thinning behavior, whereas CSG and GG showed the highest n P values. This result confirmed that XG and PE were mostly affected by the shear rate, and SSG showed the most pronounced pseudoplasticity compared to other galactomannans (GG and CSG). The noticeably strong shear‐thinning behavior of SSG compared with GG and CSG might be attributed to the enhanced macromolecular entanglement due to the relatively rigid chain conformation of SSG [14], while GG showed a random coil conformation [27] and CSG demonstrated a semi‐rigid structure [16]. The shear thinning in the steady shear test, under a large deformation, can occur when rod‐like particles align in the flow direction and lose their junctions in polymer solutions, which results in the breakdown of polymers agglomerates [25]. More shear‐thinning behavior leads to easier pumping and desirable texture and mouth feel [28]. PE with the highest k P value demonstrated the highest viscosity and strength of the network structure, whereas CSG showed the lowest consistency coefficient value.
The Moore model was employed in this study because all the experimental data depicted zero‐shear viscosity and infinite‐shear viscosity. CSG and GG showed the lowest limiting zero‐shear viscosity, while XG showed the highest value of this parameter (Table 3.2). The magnitude of the zero‐shear viscosity indicates the microstructural behavior of the biopolymer during storage [14]. A higher η 0M value reveals a greater number of linkages among macromolecules [14]. The greater η 0M of SSG compared to GG may be attributed to its polyelectrolyte nature, in which the coil dimensions may be expanded by long‐range electrostatic repulsions, resulting in a higher zero‐shear viscosity. The higher molecular weight of SSG might be another reason for the higher η 0M value of SSG compared to CSG as a polyelectrolyte hydrocolloid. Once a food system completes processing, the material should either stop flowing or flow sufficiently slowly under the low stresses that the product might still be subjected to such as gravity. In some cases, the high zero‐shear viscosity serves to prevent sedimentation of heavier particles or droplets throughout storage [29].
According to Table 3.2, XG and CSG showed the lowest η ∞M values among all, whereas PE exhibited the highest (1.41 Pa s) limiting infinite‐shear viscosity. This parameter is a measure of the consistency of the materials during processing such as pumping, mixing, and spraying and conveys the energy required for processing [14]. In nearly all applications of food suspensions, a relatively low viscosity is essential at high shear rates in order to process or apply the product properly and/or easily [29].
Except for GG, with the lowest time constant of the Moore model (0.76 s) followed by CSG (14.81 s), other gum dispersions did not show significant differences in relaxation time (Table 3.2). A higher λ value produces a faster breakdown of the structure and/or of agglomerates due to the lower opposition to flow because of the higher development of an ordered structure, so could be associated with the formation of greater intermolecular aggregates [14]. These results indicated that the mean lifetime of the junction zones in SSG, XG, and PE entanglements might be higher than those of GG and CSG, the consequence being an increase in the time required for new entanglements to replace those disrupted by an externally imposed deformation [24].
The intrinsic viscosities of CSG and GG are almost the same and are far smaller than those of the three other gum dispersions, which could explain the closeness and the lowest magnitude of η 0M and λ of these two galactomannans. XG with the highest intrinsic viscosity among other gum samples resulted in the lowest flexibility and hence a more expanded coil geometry, which in turn produced higher zero‐shear viscosity and λ values.
3.3 Time‐Dependent Rheological Properties
Up to now, a variety of methods have been utilized to demonstrate the existence of associations between polymer chains, including static and dynamic light scattering, fluorescence spectroscopy, and thixotropic measurements [30]. The characterization of the time‐dependent rheological properties (thixotropy and rheopexy) of food products is important in both providing information on how structure and flow properties are related with time and how physical parameters correlate with sensory properties during storage [28]. The time‐dependent behavior of the rheological parameters is associated with the changes occurring in the inner structure of the fluid due to particle interaction forces, which result in the formation of aggregates [22]. Various methods are available to quantify thixotropic behavior such as hysteresis loop, shear stress decay, and in‐shear structural recovery measurements [ 15,31]. In addition, a comparison of the steady shear flow parameters of presheared (time‐independent) and unpresheared (time‐dependent) samples could provide additional insight into thixotropic behavior. Thixotropic properties provide a range of desirable characteristics appropriate for products such as dairy desserts, salad dressing, and mayonnaise [31]. In the food industry, the products which flow during processing but stiffen afterward are very important. [29].
3.3.1 Hysteresis Loop
The hysteresis loop experiment consists of an alternately increasing and decreasing shear stress which involves the determination of the area enclosed between the up and down curves. The hysteresis loop area is the difference between the energy required for structural breakdown and buildup, which is regarded as an estimate of the degree of thixotropy [22]. Strongly thixotropic suspensions should exhibit large hysteresis areas since the kinetic process of breakdown or buildup is time consuming, and measured viscosities are further from the steady state [5]. The experimental protocol for this test consisted of a three‐step operation: An increasing shear rate ramp from 0.01 to 700 s−1 (upward flow curve), followed by a plateau of 700 s−1 for 60 s (peak hold), and thereafter the ramp was reversed to 0.01 s−1. The percentage of relative hysteresis area was calculated as follows:

where A up is the area under the upstream data points, and A down is the area under the downstream data points. In addition, viscous flow behavior data in the forward and backward curves were described by power‐law model, Eq. 3.1 [20].
The upward and downward flow curves are superimposed for a time‐independent sample, whereas they are not the same in the case of a time‐dependent liquid [22]. According to Table 3.3, the hysteresis area appeared for all gum dispersions, indicating that the rate of the disentanglement of the macromolecules by shearing was higher than that of re‐entanglement [22]. The highest area was determined for XG (3.82%) and SSG (3.75%), and the lowest area for CSG (1.25%), indicating more sensitivity to shear history and the stronger thixotropic properties of the former gums. It is noteworthy that the hysteresis area represents both reversible and irreversible changes in the samples' microstructure [29]. In the ascending curves, the k P parameter was higher and the n p parameter was lower than those in descending curves ( k P ″ and n P ″) for SSG, XG, and PE, whereas there were no significant differences between these parameters in the two curves for GG and CSG, suggesting that the structure responsible for thixotropy was destroyed through the forward test for the former gums group. The highest consistency coefficient and the lowest flow behavior index in both forward and backward curves were obtained for XG, whereas CSG showed the lowest k P and k P ″ and the highest n P and n P ″ among other dispersions. These results suggested that XG has the strongest structure among the other dispersions. It is noteworthy that the shear rate and time of shearing are coupled in this experiment, which makes the test less suitable for separating the effect of these two parameters; besides, the hysteresis area does not generally reflect the state of the internal structure [ 5, 29].
Table 3.3 Viscous flow behavior parameters in forward and backward curves and hysteresis area of sage seed gum (SSG), cress seed gum (CSG), xanthan (XG), pectin (PE), and guar gum (GG) (1%, 20 °C, and 0.1–700 s−1).
| Forward | Backward | ||||
| Gum | k P | n P | k P ″ | n P ″ | Hysteresis (%) |
| XG | 17.19a A ± 0.78 | 0.13d A ± 0.01 | 12.26a B ± 0.36 | 0.36c B ± 0.02 | 3.82a ± 0.06 |
| GG | 1.34d A ± 0.17 | 0.49b A ± 0.02 | 1.23d A ± 0.10 | 0.49b A ± 0.02 | 1.68c ± 0.02 |
| PE | 14.16b A ± 0.85 | 0.15d A ± 0.01 | 7.53b B ± 0.66 | 0.35c B ± 0.01 | 1.98b ± 0.05 |
| SSG | 6.41c A ± 0.38 | 0.28c A ± 0.02 | 4.99c B ± 0.23 | 0.58a B ± 0.01 | 3.75a ± 0.03 |
| CSG | 0.24e A ± 0.04 | 0.57a A ± 0.03 | 0.19e A ± 0.01 | 0.6a A ± 0.01 | 1.25d ± 0.01 |
a–d: Means followed by the same lowercase letters in the same column are not significantly different (P > 0.05).
A–B: kP and kP″ or nP and nP″ followed by the same uppercase letters in the same row are not significantly different (P > 0.05).
3.3.2 Single Shear Stress Decay
The transient rheological approach can be combined with a structural kinetics model to analyze the thixotropic behavior of a dispersion. The structural parameter in this experiment represents the fraction of the unbroken network links in a solution, so the thixotropy of a polymer solution is considered as the breakdown of the network links formed by associations between polymer chains under shear [30]. In contrast with the hysteresis loop test, single shear stress decay enables us to study the effect of time alone. In this experiment, samples were sheared at a constant shear rate (50 s−1), and the shear stress (τ, Pa) was recorded as a function of the shearing time (t, min) until the shear stress reached steady state. The transient viscosity profile is fitted by a structural kinetics model as follows [32]:

where η 0 (Pa s) is the initial apparent viscosity at t = 0 (structured state), and η ∞ (Pa s) is the steady‐state apparent viscosity at t → ∞ (non‐structured state). n and k are the orders of the structural breakdown reaction and the breakdown rate constant, respectively. This model attempts to elucidate the complicated phenomena occurring during the internal structure's breakdown and buildup by formulating equations of state, called the constitutive equations, and kinetic equations, which consider the time dependence of viscosity under constant shear rate conditions [5]. In this chapter, the second order (n = 2) was used to describe the structural breakdown kinetic of samples. For all gum dispersions, this model adequately fitted the transient apparent viscosity data (R2 = 0.89–93 and RMSE = 0.05–0.12). The structural kinetic model parameters of all gum dispersions are shown in Figure 3.4. The rate of time dependency (k parameter) was the highest for XG (2.847 s−1) and the lowest for CSG (0.135 s−1) and GG (0.161 s−1), while other gums showed the intermediate magnitudes. This behavior may be due to the highest static yield stress (SYS) of XG, which is discussed in Section 3.4.1. In thixotropic fluids, the yield stress is a function of structure and therefore of time [28]. In addition, it may be attributed to the greater strength of the XG structure and confirms that the timescale of segment–segment interaction in CSG and GG chains is shorter than the lifetime of physical entanglements of XG, PE, and SSG, which leads to a higher rate of thixotropic breakdown of the cross‐linked gum structure for the latter gums. The larger amount of thixotropy of SSG compared to that of CSG may be due to the higher SYS of SSG (Section 3.4.1 ), related to the greater rigidity with more entanglement of SSG. Both initial and steady‐state apparent viscosities were the highest for PE and the lowest for CSG among gum dispersions. As compared to other hydrocolloids, η 0 / η ∞ (a relative measure of the amount of structure breakdown, or in other words, a relative measure of the extent of thixotropy) were the highest for SSG (2.250) followed by XG (2.165) and PE (1.889) and the lowest for GG (1.191) and CSG (1.185) (data not shown).

Figure 3.4 Structural kinetic model parameters of sage seed gum (SSG), cress seed gum (CSG), xanthan (XG), pectin (PE), and guar gum (GG).
3.3.3 In‐Shear Structural Recovery Measurements
In‐shear structural recovery measurement concerns the time‐dependent behavior of material in storage periods after large deformation. In‐shear structural recovery of the samples is determined based on the Mezger procedure [33]. The samples are subjected to a three‐step shear flow test as follows: (1) a constant shear rate of 1 s−1 for 120 s (with pre‐shear at 1 s−1 for 30 s), (2) a constant shear rate of 300 s−1 for 60 s, and (3) a constant shear rate of 1 s−1 for 120 s. The percentage ratio of the average apparent viscosity during the first 120 s in step 3 to the average apparent viscosity in step 1 is termed the extent of recovery (R r , %). Moreover, to provide more structural features from the time‐dependent behavior of samples; we employed a four‐parameter model (Eq. 3.5), which was fitted on the shear stress ( τ ) data of step 3 versus time (t) as follows [34]:
where τ 0 (Pa) indicates the instantaneous recovered structure, and τ ∞ (Pa) indicates the structural stability of the recovered material. p and α r are the orders of the structure recovery reaction and the recovery rate constant, respectively. The recovery reaction order (p) was the same for all gum dispersions equal to two. In thixotropic materials, physical change can cause irreversible changes including rupture or strong aggregation of particles [29]. The recovery parameter (R r , %), which is a general indicator of the recovered structure after high shear exposure, did not show any significant differences between three commercial hydrocolloids, while it was lower for SSG, specially for CSG (Table 3.4). This reversibility is related to particle rearrangements or to the slow microstructure rebuilding at rest. When a gel slowly develops its structure, the particulate structure becomes gradually more rigid in time, resulting in slower reversible or irreversible changes in the microstructure. Sometimes a fast thixotropic recovery is advantageous, and sometimes a slow thixotropic recovery is required during the low‐shear period following application at high shear rates, for example, wet paint film on a vertical wall [29]. The values of τ 0 , τ ∞ , and α r of all gum dispersions are summarized in Table 3.4. Thixotropic materials can display elastic effects [29]. The highest value of the instantaneous recovered stress ( τ 0 ), which indicates the extent of the elastic component of samples in high deformation, was obtained for PE followed by XG. The highest value of stress at the equilibrium plateau ( τ ∞ ), which shows the restructuring behavior of samples after recovery of the structure, was obtained for PE and XG. CSG exhibited the lowest value of both these parameters. The highest recovery rate (α r ) value was obtained for PE (0.261 s−1) followed by XG (0.198 s−1). Mao and Chen [30] studied the thixotropic behavior of galactomannans and stated that the interchain association occurs in the unsubstituted regions of the mannan backbone of the polymer chains. They reported that galactomannans with a higher mannose‐to‐galactose (M:G) ratio had a stronger tendency to form associations, whereas galactomannans with a lower M:G ratio were free of chain associations in solutions. The M:G of CSG, GG, and SSG was reported as 4:1 [15], 1.59:1 [30], and 1.78–1.93:1 [14], respectively, which contradicted the results of Mao and Chen [30]. It seems that some other more important structural features exist in SSG, resulting in the greater structural strength.
Table 3.4 Extent of recovery parameter (Rr ) and the exponential four‐parameter model parameters ( τ 0 (instantaneous recovered structure), τ ∞ (the structural stability of recovered material), and α r (the recovery rate constant)) of sage seed gum (SSG), cress seed gum (CSG), xanthan (XG), pectin (PE), and guar gum (GG).
| Four‐parameter model parameters | ||||
| Gum | τ 0 (Pa) | τ ∞ (Pa) | α r (s−1) | R r (%) |
| XG | 9.999b ± 0.272 | 16.453a ± 0.015 | 0.198b ± 0.009 | 0.886a |
| GG | 5.341d ± 0.339 | 6.291c ± 0.022 | 0.016d ± 0.001 | 0.889a |
| PE | 12.197a ± 0.065 | 15.590a ± 0.030 | 0.261a ± 0.031 | 0.861a |
| SSG | 6.064c ± 0.389 | 9.597b ± 0.235 | 0.099c ± 0.002 | 0.625b |
| CSG | 0.133e ± 0.008 | 0.262d ± 0.002 | 0.029d ± 0.003 | 0.453c |
a–d: Means followed by the same letters in the same column are not significantly different (P > 0.05).
3.3.4 Time Dependency of Steady Shear Properties
As in the steady shear rheological experiments, the time and shear responses of materials are recorded, simultaneously; the obtained parameters are not an indicator of only the shear effect. No framework has been introduced so far to compare the time‐dependent and time‐independent flow behavior power‐law model parameters. Therefore, it is essential to find a test to accurately determine the time effects on the steady shear rheological properties of materials. To get a general idea of the time dependency of steady shear parameters, we used the following procedure. One batch of sample was divided into two samples to avoid the error of sampling. One of them was sheared without pre‐shearing in the range 0.01–700 s−1. The other sample was first presheared for 15 min at 100 s−1 (to remove any time dependency), and then sheared in the range 0.01–700 s−1. At the end, the rheological data were analyzed, and the ratio of the power‐law model parameters for samples without pre‐shearing to the presheared samples was evaluated. As shown in Figure 3.3, the flow behavior indexes of all unpresheared gum dispersions were lower than those of their presheared counterparts. The value of n‐n′ subtraction was the highest for XG followed by PE, whereas it was lowest for CSG, which suggested that the share of time dependency in the steady shear flow behavior parameters of unsheared XG and PE was far greater than that of the galactomannans. An almost similar trend was observed for the consistency coefficient of presheared and unpresheared samples, which showed the lowest differences between k and k′ for CSG followed by GG. As for the flow behavior index of gums, these differences are attributed to the share of time dependency in the consistency coefficient magnitudes of each gum. The complex rheological behavior of thixotropic materials can be understood on the basis of their microstructure [29]. In a polymer solution, the microstructure can mean alignment of fibers, entanglement density, or molecular association, and the maximum microstructure is seen when the alignment and spatial distribution are random and the entanglement density is higher [25]. Samples with higher thixotropic characteristics lost their hydrogel network after pre‐shearing, so they exhibited lower shear‐thinning behavior, which was more obvious than what occurred on the less thixotropic hydrocolloid dispersions.
3.4 Yield Stress
The yield stress is generally defined as the transition stress at which materials behave in an elastic solid‐like or viscous liquid‐like manner [35]. The yield stress can be utilized in different food products to prevent the sedimentation of dispersed particles in beverages [36]. Although the yield stress has practical importance for engineering, the absolute yield stress is an elusive property [20]. Two types of yield stresses, related to two types of structure, are the SYS (associated with a structure that is sensitive to the shear rate and forms over a certain period of time when the sample is at rest) and the DYS (insensitive to the shear rate and related to the amount of stress needed to maintain/stop the flow of a test material) [35]. Here, the SYS was obtained by applying a linear shear stress ramp (0.1–15 Pa) to the samples (
τ
0SR
), and the DYS was determined by the extrapolation of stress in the limit ![]() with the Bingham (τ
0B
), Vocadlo (τ
0V
), Casson (
τ
0C
), Herschel–Bulkley (τ
0H − B
), and Moore (τ
0M
) models. An alternative procedure to determine the DYS is the extrapolation of the reverse of the apparent viscosity versus shear stress curve to the infinite apparent viscosity,
τ
0E
[36].
with the Bingham (τ
0B
), Vocadlo (τ
0V
), Casson (
τ
0C
), Herschel–Bulkley (τ
0H − B
), and Moore (τ
0M
) models. An alternative procedure to determine the DYS is the extrapolation of the reverse of the apparent viscosity versus shear stress curve to the infinite apparent viscosity,
τ
0E
[36].
3.4.1 Static Yield Stress
To determine the SYS, the stress was ramped linearly from 0.1 to 15 Pa over 120 s. The viscosity–stress curve was drawn, and the stress at the peak of the viscosity curve was presented as the yield stress [37]. The yield stress achieved from the stress ramp was the highest for PE (8.52 Pa) followed by XG (6.38 Pa) and the lowest for GG (0.14 Pa) (Table 3.5). Other gum dispersions showed intermediate values. Tipvarakarnkoon and Senge [38] reported that XG is able to form intermolecular associations in solutions, so the formation of a complex network of weakly bound molecules resulted in the yield stress phenomena; however, in GG, yield stress is not observed. The network created by GG had a higher consistency than that created by SSG (Figure 3.3) but upon application of a proportional shear stress, the network broke suddenly, the particles lost their inter‐particle connections, and the product acquired the characteristics of a fluid material more than the latter gum. For all gum dispersions, the structure insensitive to shear rate was higher than the sensitive structure. Some researchers also reported a lower τ 0SR than those calculated by the rheological models [ 37,39]. Some of the applications of the SYS in foods are controlling the thickness of the coating layer (chocolate on ice cream, glazing on cakes), settling of particles in dispersions (spices in salad dressing, chocolate in chocolate milk), spreadability (cream cheese, mayonnaise), and mouthfeel (creaminess of yoghurt) [40].
Table 3.5 Static yield stress (SYS (stress ramp, τ 0SR )) and dynamic yield stress (DYS (Bingham ( τ 0B ), Casson ( τ 0C ), and Moore models ( τ 0M ), and stress‐viscosity extrapolation ( τ 0E ))) of sage seed gum (SSG), cress seed gum (CSG), xanthan (XG), pectin (PE), and guar gum (GG).
| SYS | DYS | ||||||
| Gum | τ 0SR (Pa) | τ 0E (Pa) | τ 0H − B (Pa) | τ 0V (Pa) | τ 0B (Pa) | τ 0C (Pa) | τ 0M (Pa) |
| XG | 6.38b ± 0.42 | 17.27a ± 1.75 | – | 13.84a ± 1.85 | 17.97b ± 1.87 | 14.81a ± 1.80 | 18.62b ± 4.09 |
| GG | 0.14e ± 0.01 | 5.49 b ± 0.55 | – | – | 3.01d ± 0.67 | 4.20c ± 0.07 | 1.64c ± 0.25 |
| PE | 8.52a ± 0.28 | 14.48a ± 2.45 | 4.25a ± 1.40 | 7.86b ± 0.59 | 20.86a ± 4.49 | 11.91a ± 2.21 | 26.31a ± 2.47 |
| SSG | 3.67c ± 0.15 | 7.66b ± 0.32 | 1.23b ± 0.16 | – | 15.58c ± 1.02 | 7.92b ± 0.44 | 17.78b ± 0.84 |
| CSG | 0.43d ± 0.02 | 0.13c ± 0.04 | 0.31c ± 0.06 | 0.43c ± 0.08 | 0.68e ± 0.16 | 0.33d ± 0.05 | 0.91c ± 0.06 |
a–d: Means followed by the same letters in the same column are not significantly different (P > 0.05).
3.4.2 Dynamic Yield Stress
As shown in Table 3.5, the intercepts of the various rheological models differed among dispersions; whereas CSG showed the lowest yield stress estimated by all models, XG and PE showed the greatest yield stresses values. It is known that the intercept point is dependent on the range of the shear rate and the model employed for extrapolating the data [37]. The yield stresses obtained by extrapolating the reverse of the apparent viscosity versus shear stress curve to the infinite apparent viscosity for two novel hydrocolloids were lower than for the commercial ones. The Herschel–Bulkley model was not able to determine the yield stress of XG and GG, the Vocadlo model was not able to determine the yield stress of GG and SSG, and the yield stresses of the Heinz and Heinz–Casson models were negative for all gum dispersions, confirming the inappropriateness of these models. The main usage of DYS in foods is in process design calculations and pipeline design (flow and velocity profiles through transportation) [40].
3.5 Cluster Analysis
Clustering, one of the most important unsupervised learning problems, is a common procedure for statistical data analysis which is used in many fields such as machine learning, data mining, pattern recognition, image analysis, and bioinformatics. It is a method of grouping similar objects into various groups, or more precisely, the partitioning of a data set into subsets according to some defined distance measure [41]. Data clustering algorithms can be hierarchical or partitional. Hierarchical clustering finds successive clusters using previously established clusters. To investigate the similarity of the time‐dependent and time‐independent steady shear rheological properties of two novel gums (SSG and CSG) with three commercialized biopolymers (GG, XG, and PE), we employed the hierarchical clustering technique and PCA in a serial mode. Hierarchical algorithms can be agglomerative (bottom‐up) or divisive (top‐down). In this research, we used the agglomerative algorithm, which begins with each element as a separate cluster and merges them in successively larger clusters. A key step in hierarchical clustering is to select a distance measure. Here, the Euclidean distance, computed by finding the square of the distance between each variable, summing the squares, and finding the square root of that sum, was used [41].
PCA is a statistical procedure which uses sophisticated underlying mathematical principles to transform a number of possibly correlated variables into a smaller number of linearly uncorrelated variables called principal components. It should be mentioned that distance correlation was used for hierarchical clustering. The rheological properties of five gum dispersions were given by 25 parameters. As a large number of rheological parameters were introduced in this study, to use PCA for clustering, we employed a screening filter. In this way, first, the 25 parameters were classified into four categories with more than 60% similarity indexes in each group by agglomerative hierarchical clustering (Table 3.6). Generally, the first group contained variables related to the initial structure of material (no destruction), the second group contained parameters related to the manner of structure destruction, the third group variables were associated with the structure of matter in the absence of a shear field, and the fourth group contained parameters determined after destruction of the structure in the shear field. Then, one parameter was randomly selected for clustering from each of the four groups, which represented one of the rheological aspects of matter (boldfaced parameter). These four parameters were the Moore zero‐shear viscosity, extent of hysteresis, yield stress obtained from stress‐viscosity extrapolation, and the power‐law model consistency coefficient in the absence of a time‐dependent structure, respectively. Using these parameters and the PCA technique, the novel and commercialized hydrocolloids were clustered. A Scree plot showed that just two components can evaluate more than 91% of variances in the data (data not shown), so they were used for the clustering analysis. As shown in Figure 3.5, the score plot for the two first components demonstrated that from the standpoint of the rheological characteristics (steady shear and time dependent), CSG is more similar to GG, and SSG has the greatest similarity to XG and after that to PE dispersions. Investigating the most effective rheological parameter in hydrocolloids clustering analysis showed that the zero‐shear viscosity, which is related to the structure of the gums, showed the most influential effect (0.771 coefficient for PC1), and the consistency coefficient in the absence of structure demonstrated the least influential effect (0.084 coefficient for PC1) on hydrocolloids clustering (data not shown). Table 3.7 demonstrated the Euclidean distance between different gums in the score plot. The formula for the Euclidean distance measurement between a point X (X1, X2, etc.) and a point Y (Y1, Y2, etc.) is [41]
Table 3.6 Clustering of steady shear and time‐dependent rheological parameters of sage seed gum (SSG), cress seed gum (CSG), xanthan (XG), pectin (PE), and guar gum (GG).
| A (similarity index = 65.65) | B (similarity index = 71.15) | C (similarity index = 63.55) | D (similarity index = 75.65) |
| K (equilibrium consistency coefficient‐unpresheared) | Hysteresis area | η ∞ (steady‐state apparent viscosity from single shear stress decay) | K′ (equilibrium consistency coefficient‐presheared) |
| τ 0 (indicator of instantaneous recovered structure) | k (decay rate from single shear stress decay test) | τ 0E (yield stress from apparent viscosity versus shear stress curve) | n′ (equilibrium flow behavior index‐presheared) |
| α r (recovery rate from single shear stress decay) | λ (relaxation time from Moore model) | τ 0c (yield stress by Casson model) | K p ″ (hysteresis loop test) |
| τ 0SR (yield stress by stress ramp test) | η 0 (single shear stress decay test) | τ 0B (yield stress by Bingham model) | n p ″ (hysteresis loop test) |
| τ 0M (yield stress by Moore model) | η ∞ (single shear stress decay test) | — | η 0∞ (limiting infinite‐shear viscosity by Moore model) |
| η 0M (zero‐shear viscosity by Moore modele) | K p (consistency coefficient from hysteresis loop test) | — | — |
| n (equilibrium flow behavior index‐unpresheared) | n p (flow behavior index from hysteresis loop test) | — | — |
| R r % (recovery from in‐shear structural recovery) | — | — | — |
Bolded parameters were randomly selected for clustering

Figure 3.5 Distribution and correlation between the studied hydrocolloids in vector space.
Table 3.7 Euclidean distance between sage seed gum (SSG), cress seed gum (CSG), xanthan (XG), pectin (PE), and guar gum (GG) in the vector space.
| Euclidean distance from: | |||||
| Gum | XG | GG | PE | SSG | CSG |
| XG | 0.00 | 8.14c ± 0.14 | 2.64a ± 0.13 | 0.70a ± 0.08 | 9.15c ± 0.13 |
| GG | 8.14c ± 0.14 | 0.00 | 7.04c ± 0.15 | 7.95c ± 0.21 | 1.26a ± 0.41 |
| PE | 2.64b ± 0.13 | 7.04b ± 0.15 | 0.00 | 3.29b ± 0.32 | 8.41b ± 0.41 |
| SSG | 0.70a ± 0.08 | 7.95c ± 0.21 | 3.29b ± 0.32 | 0.00 | 8.70b ± 0.08 |
| CSG | 9.15d ± 0.13 | 1.26a ± 0.41 | 8.41d ± 0.41 | 8.70d ± 0.08 | 0.00 |
a–d: Means followed by the same letters in the same column are not significantly different (P > 0.05).
According to Table 3.7, among different commercialized hydrocolloids, SSG showed the lowest Euclidean distance with XG (0.70) and the highest distance with GG (8.14); in contrast, CSG showed the lowest Euclidean distance with GG (1.26) and the highest distance with XG (9.15). It is noteworthy that, among galactomannans, SSG showed the highest similarity with PE with the lowest Euclidean distance magnitude. Although both SSG and GG are galactomannans with almost the same molecular weight (≈103 kDa for GG [9] and 4 × 10²–1.5 × 10³ kDa for SSG [ 13, 14], the lack of similarity between SSG with GG could be related to the anionic nature of SSG and the neutrality of the GG chains, which is reflected in the higher intrinsic viscosity of SSG (22.55 dl g−1 [13]) compared to GG (12.5 dl g−1 [9]). On the other hand, it is expected that the behavior of CSG, a polyelectrolyte galactomannan, would be similar to that of SSG rheologically, whereas its behavior was surprisingly similar to that of GG. This behavior could be attributed to the lower molecular weight of CSG (540 kDa, almost half of GG's molecular weight [15], which is demonstrated in their almost similar intrinsic viscosity values (13.3 dl g−1 for CSG [15]) and seems to compensate for the positive effect of the CSG polyelectrolyte nature to some extent. The highest similarity of SSG to XG may be attributed to the likeness of their conformation (rigid conformation of SSG and XG). Although the intrinsic viscosity of XG (214.21 dl g−1 [10]) is much higher than that of SSG, the literature proves that SSG exhibits a higher storage modulus, loss modulus, complex modulus, extent of elastic component temperature dependency, the slope of double logarithmic complex viscosity–frequency plots at different temperatures of 10–90 °C (1%w/w, f = 1 Hz), complex viscosity (1 Hz, 50 °C) [42], and departure value from the Cox–Merz rule and lower complex compliance (1/Pa, 0.01–10 Hz) than XG [31].
3.6 Conclusion and Future Trend
The rheological characteristics of three generally used and two novel hydrocolloids were investigated. Except GG, which did not show shear‐thickening behavior, other gums showed a specific three‐stage apparent viscosity versus shear rate response when sheared over a wide shear rate range. As compared to other hydrocolloids, GG showed the highest critical shear rate. XG was found to be the most pseudoplastic gum with the lowest power‐law flow behavior index, especially in the range of 0.01–0.1 s−1 (67.3% viscosity reduction). The Moore and power‐law models could describe the flow behavior of hydrocolloid solutions. XG and SSG with the highest hysteresis area among all selected gums showed the highest sensitivity to shear history. Using the structural kinetic model, XG exhibited the highest breakdown rate constant. In addition, the relative measure of the extent of thixotropy was the highest for XG and SSG and the lowest for CSG and GG. The recovery parameter (R r , %) obtained from in‐shear structural recovery measurements did not show any significant differences between XG, GG, and PE, while it was the lowest for CSG. PE showed an intermediate behavior as compared to other dispersions with respect to the limiting zero‐shear viscosity from the Moore model and the consistency coefficient of the power‐law model. PE exhibited the highest SYS among all the hydrocolloids. The hierarchical clustering technique with PCA showed the highest similarity of SSG with XG and CSG with GG. In addition, the zero‐shear viscosity was determined as the most effective rheological parameter in hydrocolloids clustering analysis, whereas the consistency coefficient in the absence of structure demonstrated the least influential effect. Using the aforementioned results, one can decide on the final usage of SSG and CSG in various food formulations, based on their steady shear rheological behavior similarity to the commercialized hydrocolloids, XG, GG, and PE. Choosing hydrocolloids in food systems on the basis of their functions enables us to rationally design structural features. In this way, combining the results of multiple tests provides a better insight into their structure‐function relationship. So, it seems beneficial to employ the aforementioned framework by using the hierarchical clustering technique and PCA to investigate the similarity of different emerging hydrocolloids with generally used gums regarding their physicochemical, textural, and microstructural characteristics besides their bioactivity. This information is invaluable in the design of biopolymer blends with a specific extent of compatibility for a specific functionality.
References
- 1 Nor Hayati, I., Ching, C.W., and Rozaini, M.Z.H. (2016). Flow properties of o/w emulsions as affected by xanthan gum, guar gum and carboxymethyl cellulose interactions studied by a mixture regression modeling. Food Hydrocolloids 53: 199–208.
- 2 Razavi, S.M.A. and Behrouzian, F. (2018). Biopolymers for food design. In: Handbook of Food Bioengineering (ed. A. Grumezescu and A.M. Holban), 65–94. Cambridge, USA: Elsevier.
- 3 Razavi, S.M.A., Behrouzian, F., and Alghooneh, A. (2017). Temperature dependency of the interaction between sage seed gum and xanthan gum: an interpretation of dynamic and thixotropy rheology based on creep test. Journal of Texture Studies 48 (5): 470–484.
- 4 Marcotte, M., Hoshahili, A.R.T., and Ramaswamy, H.S. (2001). Rheological properties of selected hydrocolloids as a function of concentration and temperature. Food Research International 34: 695–703.
- 5 Labanda, J. and Llorens, J. (2006). A structural model for thixotropy of colloidal Dispersions. Rheology Acta 45: 305–314.
- 6 Azizpour, M., Mohebbi, M., Yolmeh, M. et al. (2017). Effects of different hydrocolloids on foaming properties of shrimp puree: a cluster analysis. Food Measurement and Characterization 11 (4): 1892–1898.
- 7 Casanovas, A., Hernandez, M.J., Martí‐Bonmati, E., and Dolz, M. (2010). Cluster classification of dysphagia‐oriented products considering flow, thixotropy and oscillatory testing. Food Hydrocolloids 25 (5): 851–859.
- 8 Serrano‐Megias, M. and Lopez‐Nicolas, J.M. (2006). Application of agglomerative hierarchical clustering to identify consumer tomato preferences: influence of physicochemical and sensory characteristics on consumer response. Journal of the Science of Food and Agriculture 86: 493–499.
- 9 Richardson, P.H., Willmer, J., and Foster, T.J. (1998). Dilute solution properties of guar and locust bean gum in sucrose solutions. Food Hydrocolloids 12: 339–348.
- 10 Higiro, J., Herald, T.J., and Alavi, S. (2006). Rheological study of xanthan and locust bean gum interaction in dilute solution. Food Research International 39: 165–175.
- 11 Sato, A.C.K., Oliveira, P.R., and Cunha, R.L. (2008). Rheology of mixed pectin solutions. Food Biophysics 3: 100–109.
- 12 Lopes da Silva, J.A. and Rao, M.A. (2006). Pectins: structure, functionality, and uses. In: Food Polysaccharides and their Applications (ed. A.M. Stephen, G.O. Phillips and P.A. Williams), 65–94. Boca Raton: Taylor & Francis Group.
- 13 Razavi, S.M.A., Mohammadi Moghaddam, T., Emadzadeh, B., and Salehi, F. (2012). Dilute solution properties of wild sage (Salvia macrosiphon) seed gum. Food Hydrocolloids 29: 205–210.
- 14 Razavi, S.M.A., Cui, S.W., Guo, Q., and Ding, H. (2014). Some physicochemical properties of sage (Salvia macrosiphon) seed gum. Food Hydrocolloids 35: 453–462.
- 15 Karazhiyan, H., Razavi, S.M.A., Phillips, G.O. et al. (2009). Rheological properties of Lepidium sativum seed extract as a function of concentration, temperature and time. Food Hydrocolloids 23: 2062–2068.
- 16 Karazhiyan, H., Razavi, S.M.A., Phillips, G.O. et al. (2011). Physicochemical aspects of hydrocolloid extract from the seeds of Lepidium sativum. International Journal of Food Science and Technology 46: 1066–1072.
- 17 Behrouzian, F., Razavi, S.M.A., and Karazhiyan, H. (2013). The effect of pH, salts and sugars on the rheological properties of cress seed (Lepidium sativum) gum. International Journal of Food Science and Technology 48: 2506–2513.
- 18 Behrouzian, F., Razavi, S.M.A., and Karazhiyan, H. (2014). Intrinsic viscosity of cress (Lepidium sativum) seed gum: effect of salts and sugars. Food Hydrocolloids 35: 100–105.
- 19 Behrouzian, F., Razavi, S.M.A., and Phillips, G.O. (2014). Cress seed (Lepidium sativum) mucilage, an overview. Bioactive Carbohydrates and Dietary Fibre 3: 17–28.
- 20 Steffe, J.F. (1996). Rheological Methods in Food Process Engineering, 2e. Michigan: Freeman Press.
- 21 Yaşar, K., Kahyaoglu, T., and Şahan, N. (2009). Dynamic rheological characterization of salep glucomannan/galactomannanbased milk beverages. Food Hydrocolloids 23: 1305–1311.
- 22 Benchabane, A. and Bekkour, K. (2008). Rheological properties of carboxymethyl cellulose (CMC) solutions. Colloid and Polymer Science 286: 1173–1180.
- 23 Liu, W.‐H., Yu, T.L., and Lin, H.‐L. (2007). Shear thickening behavior of dilute poly (diallyl dimethyl ammonium chloride) aqueous solutions. Polymer 48: 4152–4165.
- 24 Razavi, S.M.A., Alghooneh, A., Behrouzian, F., and Cui, S.W. (2016). Investigation of the interaction between sage seed gum and guar gum: steady and dynamic shear rheology. Food Hydrocolloids 60: 67–76.
- 25 Barnes, H.A. (1997). Thixotropy‐a review. Journal of Non‐Newtonian Fluid Mechanics 70: 1–33.
- 26 Barnes, H.A. (2000). A Handbook of Elementary Rheology. Aberystwyth: University of Wales, Institute of Non‐Newtonian Fluid Mechanics.
- 27 Morris, E.R., Cutler, A.N., Ross‐Murphy, S.B. et al. (1981). Concentration and shear rate dependence of viscosity in random coil polysaccharide solutions. Carbohydrate Polymers 1: 5–21.
- 28 Javidi, F., Razavi, S.M.A., Behrouzian, F., and Alghooneh, A. (2016). The influence of basil seed gum, guar gum and their blend on the rheological, physical and sensory properties of low fat ice cream. Food Hydrocolloids 52: 625–633.
- 29 Mewis, J. and Wagner, N.J. (2009). Thixotropy. Advances in Colloid and Interface Science 147–148: 214–227.
- 30 Mao, C.‐F. and Chen, J.‐C. (2006). Interchain association of locust bean gum in sucrose solutions: an interpretation based on thixotropic behaviour. Food Hydrocolloids 20: 730–739.
- 31 Alghooneh, A., Razavi, S.M.A., and Behrouzian, F. (2016). Flow behavior, thixotropy and viscoelastic characterization of biopolymer blends: sage seed gum‐xanthan gum blends as a case study. Food Hydrocolloids 57 (21): 9609–9621.
- 32 Abu‐Jdayil, B. (2003). Modelling the time‐dependent rheological behaviour of semisolid foodstuffs. Journal of Food Engineering 57: 97–102.
- 33 Mezger, T.G. (2002). Rotational tests. In: The Rheology Handbook: For Users of Rotational and Oscillatory Rheometers (ed. U. Zorll). Hannover: Vincentz Verlag.
- 34 Razavi, S.M.A., Alghooneh, A., and Behrouzian, F. (2017). Influence of temperature on sage seed gum (Salvia macrosiphon) rheology in dilute and concentrated regimes. Journal of Dispersion Science and Technology 39: 982–995.
- 35 Galindo‐Rosales, F.J. and Rubio‐Hernandez, F.J. (2010). Static and dynamic yield stresses of Aerosil® 200 suspension in polypropylene glycol. Applied Rheology 20 (2): 22787.
- 36 Kiani, H., Mousavi, M.E., and Mousavi, Z.E. (2010). Particle stability in dilute fermented dairy drinks: formation of fluid gel and impact on rheological properties. Food Science and Technology International 16 (6): 543–551.
- 37 Razavi, S.M.A., Taheri, H., and Quinchia, L.A. (2011). Steady shear flow properties of wild sage (Salvia macrosiphon) seed gum as a function of concentration and temperature. Food Hydrocolloids 25 (3): 451–458.
- 38 Tipvarakarnkoon, T. and Senge, B. (2008). Rheological behaviour of gum solutions and their interactions after mixing. Annual Transactions of the Nordic Rheology Society 16: 73–80.
- 39 Bhattacharya, S. and Bhat, K.K. (1997). Steady shear rheology of rice‐blackgram suspensions and suitability of rheological models. Journal of Food Engineering 32: 241–250.
- 40 Sun, A. and Gunasekaran, S. (2009). Yield stress in foods: measurements and applications. International Journal of Food Properties 12 (1): 70–101.
- 41 Madhulatha, T.S. (2012). An overview on clustering methods. IOSR Journal of Engineering 2 (4): 719–725.
- 42 Behrouzian, F., Razavi, S.M.A. and Alghooneh, A. (2017) Evaluation of interactions of biopolymers using dynamic rheological measurements: effect of temperature and blend ratios.