5
Hydrocolloids Interaction Elaboration Based on Rheological Properties
Ali Alghooneh Fataneh Behrouzian and Seyed M.A. Razavi
Food Hydrocolloids Research Center, Department of Food Science and Technology, Ferdowsi University of Mashhad, PO Box 91775‐1163, Mashhad, Iran
5.1 Introduction
Binary mixtures of polysaccharides have been thoroughly studied for the purpose of gaining a fundamental understanding, and also to discover industrial applications, especially in food systems to improve some properties of each component [1]. The literature has established that some novel gums could be alternatives to some of the commercial hydrocolloids in blend formulations as stabilizer, thickener, binder, and gelling agents and could be used in food, cosmetics, and pharmaceutical systems. Apart from blends' functional properties, food ingredients and processing conditions such as salts, pH, and temperature affect their functions. This chapter reviews studies on new gum blends and reports their rheological properties and the effect of food ingredients and processing conditions on these characteristics. In addition, the interaction behavior of biopolymers is investigated from both thermodynamic and kinetic viewpoints based on rheological properties. Some researchers have described the interaction between xanthan gum (XG) and galactomannans as incompatibility [2]. Nevertheless, some evidence supports intermolecular binding between XG and galactomannans [3] and suggests that destabilization of the XG helix facilitates binding between XG and galactomannan [4]. So, knowledge of the thermodynamic functions of mixing and inter‐chain association in the binary polymer blends is of great significance for both fundamental science and practical applications. On the other hand, understanding the specific interactions and/or phase separation conditions is still a challenge that usually involves the establishment of a phase diagram, which is highly time consuming and requires large quantities of raw materials which are not always available, especially when working with purified polysaccharides. Gibbs free energy is a thermodynamic function useful in probing the compatibility of biopolymers in blends which can be taken only from experimental thermodynamics. However, experimental studies on Gibbs energy of polymer blends are quite rare [5]. To overcome these major drawbacks, alternative strategies recently emerged, one of them being rheology, which this chapter deals with in both dilute and concentrated regimes. On the other hand, dynamic rheology can probe the inter‐chain association in which the viscoelastic characteristic of hydrocolloids could be determined without alteration of the sample's structure [6]. The present chapter enables the reader to compare the properties between different sources and aids in the eventual utilization of novel gums in blend systems for their specific usage and to broaden the application of novel hydrocolloids in different industries.
5.2 Dilute Regime
The viscosity measurement of binary blends in the dilute solution domain has been a very useful approach to understanding how molecules behave and interact in solution [7] and allows the determination of intrinsic viscosity, [η], and other molecular characteristics of polymers under given thermodynamic conditions [8]. Arthur et al. [9] investigated the interaction between Khaya senegalensis (KS gum) and Acacia senegal (AS or gum arabic) using the Ubbelohde viscometer. The Huggins equation was applied to a ternary polymer–polymer–solvent dilute solution as follows:
where b m , b 1 , and b 2 are the Huggins coefficients for blend, gum 1, and gum 2, respectively. W 1 and W 2 are the weight fractions of polymers 1 and 2, respectively. b m1 represents the long‐range hydrodynamic interaction of pairs of single molecules, b m2 indicates the formation of double molecules or attraction between blend components, and b m3 shows the intermolecular attraction or repulsion. By measuring b m from the Huggins equation for a polymer blend solvent solution, α is calculated, and the interaction is characterized, where α ≥ 0 denotes attraction, and α < 0 denotes repulsion. The 20% AS–80% KS blend exhibits the strongest attraction between KS and AS molecules since the blend has the highest value of the intrinsic viscosity value, while the 60% AS–40% KS blend has the least attraction as evidenced by the polymer miscibility coefficient (α), but these interactions vanish as salts (KCl, KBr, and AlCl3 at a concentration of 10 g dm−3 or 1 g dl−1) are added. The specific viscosity decreases as the temperature increases (the least viscosity is at 70 °C, followed by a slightly increase up to 90 °C), the concentration of the blends decreases, and the concentrations of KBr, KCl, or AlCl3 increase in an aqueous medium. In each of the gum blends, the trivalent ions from AlCl3 show a more pronounced effect on the specific viscosity compared with the monovalent ions of KCl and KBr. The hydrodynamic interaction value, b m1, indicates that the blends become more soluble in water when a greater concentration of gum arabic is added to the blends. The power‐law coefficient of the specific viscosity versus concentration shows an inverse relationship with an increase in KS fraction in the blends, suggesting a more flexible AS‐KS complex dependent on KS [9].
The rheological interaction of sage seed gum (SSG) with XG in the dilute region at five blending ratios (100:0, 75:25, 50:50, 25:75, and 0:100) and three temperatures (25, 40, and 55 °C) was investigated [10]. The higher slope of the master curve (double logarithmic plots of η sp against C[η]) at 40 °C compared to the slope at 25 °C indicates the greater rigidity of blends at the former temperature. In addition, the slope of the master curve of the blends is slightly lower than the slopes of either XG or SSG alone. Comparing the intrinsic viscosity calculated with five models of Kraemer, Huggins, Tanglertpaibul & Rao, and Higiro, the Tanglertpaibul & Rao model shows a better fit, with a higher correlation (R 2) value for all blends. At 25 and 40 °C, the intrinsic viscosity of XG‐SSG blends is lower than the calculated intrinsic viscosity from the weight averages of the two individually, whereas at 55 °C the opposite behavior is observed, indicating that molecular binding occurs between XG and SSG only at 55 °C. Among the gum blends, the 75% XG–25% SSG blend shows the largest intrinsic viscosity [10].
5.3 Concentrated Regime
5.3.1 Steady Rheological Behavior
Steady shear measurement is employed to follow the breakdown of the structure at different rates of shear [11]. The synergistic behavior of xanthan and galactomannans from Brazilian seeds (Mimosa scabrella Bentham and Schizolobium parahybum (Veil) Blake), with mannose/galactose ratios of l.l:l and 3:l, respectively, were examined [12]. Viscometric determinations were performed at 20 °C over a range of polymer concentrations of 0.1–2 g l−1 (10 < ![]() < 350 s−1). A stronger interaction exists between xanthan‐S. parahybum galactomannan in water at 1 and 2 g l−1, with a stronger increase in viscosity compared with that of the galactomannan from M. scabrella, and a maximum in synergistic effect in water exists when the mixing ratio of xanthan to galactomannan is 1:l. The maximum viscosity (70 s−1) for the xanthan‐M. scabrella galactomannan occurs at the ratio 4:1. 0.01 M NaCl addition decreases the synergistic effect, compared with the result obtained in water. When the xanthan‐galactomannan of the M. scabrella mixture is prepared at 25 °C, the system shows less synergism than when prepared at 80 °C in water (both tested at 20 °C), as indicated by the lower specific viscosity at 70 s−1 [12].
< 350 s−1). A stronger interaction exists between xanthan‐S. parahybum galactomannan in water at 1 and 2 g l−1, with a stronger increase in viscosity compared with that of the galactomannan from M. scabrella, and a maximum in synergistic effect in water exists when the mixing ratio of xanthan to galactomannan is 1:l. The maximum viscosity (70 s−1) for the xanthan‐M. scabrella galactomannan occurs at the ratio 4:1. 0.01 M NaCl addition decreases the synergistic effect, compared with the result obtained in water. When the xanthan‐galactomannan of the M. scabrella mixture is prepared at 25 °C, the system shows less synergism than when prepared at 80 °C in water (both tested at 20 °C), as indicated by the lower specific viscosity at 70 s−1 [12].
The interaction between Mimosa scabrella galactomannan polysaccharide (G) ‐sodium caseinate (NaC) mixtures using 10 and 20 g l−1 galactomannan concentration and 10–100 g l−1 of NaC was investigated. The steady shear experiments of G (10 g l−1)/NaC give rise to an increase of viscosity with the increase of NaC at the lower shear rate (10−3–100 s−1), suggesting a probable interaction between these blends [13]. The steady shear rheological behavior of konjac glucomannan (KGM)‐spruce galactoglucomannan (GGM, a wood‐derived polysaccharide) mixtures shows that spruce GGM has a very low viscosity compared to KGM, and with the increase in the ratio of KGM in the mixtures, shear thinning become more dramatic [14].
Feng et al. [15] studied the effect of Mesona Blumes gum (MBG) at 0%, 0.1%, 0.35%, 0.5%, and 0.7% (w/w, d.b.) on the rheological properties of rice starch (RS) paste (6% w/w). Using the Herschel–Bulkley model, RS–MBG mixtures show pseudoplastic flow behavior (0.17 ≤ n ≤ 0.24). The flow behavior index (n) value initially decreases to 0.17 with the MBG concentration increasing to 0.35%, followed by stable n values with the MBG concentration increasing to 0.7%. The values of η 50 (apparent viscosity at 50 s−1) and k (consistency coefficient) of RS–MBG mixtures are also much higher than those of RS paste without MBG, which explains the synergistic interaction between RS and MBG. The effect of temperature (25–65 °C) on η 50 is described by the Arrhenius equation. Activation energy values (16.8–22.3 kJ mol−1) of RS–MBG mixtures vary considerably, indicating a strong temperature dependence. On the other hand, according to Marcotte et al. [16], when the E a value is more than 3.03 × 10⁴ J mol−1, the system viscosity is more prone to the temperature effect. Thus, the starch–MBG gel mixtures are relatively thermostable [15].
The flow behavior of mixed solutions of xanthan and galactomannan isolated from Delonix regia seeds at different shear rates (1.19–95.03 s−1) are determined with a rheogoniometer. Keeping the total concentration constant at 0.1% at 45 °C, the flow curves of mixed solutions of native xanthan and galactomannan show plastic behavior except for xanthan and galactomannan alone, which indicates that synergistic interaction occurs between xanthan and galactomannan molecules [17].
Razavi et al. [18] studied the rheological interaction of various SSG and GG (guar gum) blends at 3:1, 1:1, and 1:3 ratios (20 °C). As the SSG fraction increases, the extent of viscosity reduction in the range 0.01–316 s−1 increases from 58.68 for GG to 832.73 times for SSG, which is not the same at different ranges of the shear rate, indicating augmentation of shear thinning with increasing SSG fraction. The power‐law and Moore models adequately fit the shear stress versus shear rate and shear viscosity versus shear rate data, respectively (R2 = 0.93–0.99). Using the Moore model, the zero‐shear viscosity and the time constant increase when the SSG fraction is increased. The reciprocal time constant (1/τ), which gives the critical shear rate for the beginning of shear thinning, decreases appreciably when the SSG fraction increases. This result suggests an increase in the time required for new entanglement to replace those disrupted by an externally imposed deformation as the SSG fraction increases in blends [18].
In another study, Gleditsia triacanthos (Gt) gum (0.1%, 0.4%, 0.7%, and 1.0%, w/v) and tapioca starch (2.5%, w/v) were combined, and rheological characterization of the binary mixture was evaluated [19]. The power‐law model describes the shear rate effect on the apparent viscosity values of samples (1–100 s−1 shear rate at 25 °C). An increase in the Gt level increases the apparent viscosity and consistency coefficient of the samples. All the mixtures show non‐Newtonian shear‐thinning behavior. The results suggest that Gt gum and tapioca starch show good interaction and synergism [19]. Alghooneh et al. [11] investigated the flow behavior of SSG–XG at three different ratios of 1:3, 1:1 and 3:1in the range 0.01 to 300 s−1. The apparent viscosity‐shear rate data were fitted using the power‐law equation. The strong shear‐thinning behavior for all blends is characterized by flow behavior index values less than 0.30. The flow behavior index increases with an increase in the SSG fraction, while the consistency coefficient shows a decreasing trend [1]. The effect of SSG at different concentrations (0%, 0.1%, 0.25%, and 0.5% w/w) on the steady shear flow behavior of wheat starch dispersion (2% w/w) was evaluated [20]. The apparent viscosity increases with increasing SSG concentration, and all the samples exhibit shear‐thinning flow behavior. Addition of SSG up to 0.5% results in an approximately twofold increase in the limiting viscosity at a high shear rate, and a 251‐fold increase in the consistency coefficient, but a 19% decrease in the flow behavior index values of wheat starch dispersion using Sisko's model [20].
5.3.2 Transient Rheological Behavior
The use of creep and recovery tests has been suggested to assess the most likely internal structure of a system [21]. Perissutti et al. [13] studied the creep and recovery behavior of M. scabrella galactomannan polysaccharide (G)‐sodium caseinate (NaC) mixtures. A decrease in the compliance parameter (J) was observed with an increase in NaC concentration, indicating a more viscoelastic solution in comparison with the galactomannan in aqueous solution, with J values of 60 and 54 Pa−1 for the G (10 and 20 g l−1)/NaC (50 g l−1) mixtures, respectively, and 52 and 36 Pa−1 for G (10 and 20 g l−1)/NaC (100 g l−1) mixtures, respectively.
5.3.3 Dynamic Rheological Behavior
5.3.3.1 Amplitude Sweep Properties
Many useful rheological properties could be obtained from the amplitude sweep data, such as the elastic modulus (G′ LVE ), viscous modulus (G″ LVE ), loss tangent (tan δ ), the limiting value of strain (γ C ) at the LVE region, the slope of the storage modulus and loss tangent at the start of the n‐LVE (nonlinear viscoelastic) region, yield stress at the limit of the LVE range (τ y ), and flow‐point stress ( τ f ). Razavi et al. [18] investigated the interaction behavior of different SSG–GG ratios (1:3, 1:1, and 3:1) in the LVE region. SSG–GG blends show higher G′ values than G″ values at 1:1 and 3:1 ratios, whereas the 1:3 SSG–GG sample shows the reverse behavior. Both moduli increase with increase in the SSG fraction. The loss tangent of blends at 1:1 and 3:1 ratios is less than 1, while this parameter is 1.32 for the 1:3 SSG–GG. The critical strain (γ c ) and loss tangent increase with increasing GG fraction. Except 1:3SSG–GG, for all samples exceeding the critical strain amplitude, beyond the LVE, G′ can cross G″ (crossover). τ f (the stress at the crossover point) increases when the SSG fraction is increased from 50% to 100%, showing a greater tendency to flow for 1:1 SSG–GG. In addition, the amplitude dependency of G′ increased with the SSG fraction [18].
5.3.3.2 Frequency Sweep Properties
Frequency sweep measurements within the LVE range provide some valuable rheological parameters that are helpful for elaborating the interaction behavior. The mechanical spectra could be characterized by the storage modulus (G′), loss modulus (G″), complex modulus (G*), complex viscosity (η*), and the loss tangent (tan δ) as a function of frequency (Hz). The frequency dependencies of G′ (Eq. 5.3), G″ (Eq. 5.4), and η* (Eq. 5.5), for any dispersion, could be approximated by the power‐law model as follows [11]:
where k′ (Pa sn), k″ (Pa sn) and k * (Pa sn) are constants; n′, n″, and n * are viscoelastic exponents; and ω is the angular velocity (rad s−1).
Mixed gels of κ‐carrageenan from Hypnea musciformis (κ‐car) and galactomannans from Cassia javanica (CJ) and locust bean gum (LBG) were compared using dynamic viscoelastic measurements [22]. Mixed gels at 5 g l−1 of total polymer concentration in 0.1 M KCl show a synergistic maximum in viscoelastic measurements for κ‐car/CJ and κ‐car/LBG at 2:1 and 4:1 ratios, respectively. The plot of log η* versus log ω is linear with a slope of −1 for all blends, as expected for true gels. However, the values of η* are higher for the mixtures than for κ‐car alone. An enhancement in the G′ and G″ is observed in the mechanical spectra of the mixtures in relation to κ‐car. The proportionally higher increase in G″ compared with G′, as indicated by the values of the loss tangent (tan δ), suggests that the galactomannans adhere non‐specifically to the κ‐car network [22]. Different ratios of starch and decolorized Hsian‐tsao leaf gum (dHG) composite gels with starch/gum 3:3, 4:2, and 5:1 show the higher G′ and G″ values compared to those of starch or dHG alone, due to the constructive interactions between starch and dHG. In addition, rheologically, these composite gels can be classified as weak to strong gels due to the fact that the G′ values are much greater than the G″ values, and the tan δ values are much less than 1 [23]. Perissutti et al. [13] reported that M. scabrella galactomannan polysaccharide (G)‐sodium caseinate (NaC) at 10 and 20 g l−1 galactomannan concentration and 10–100 g l−1 of NaC show a viscous behavior, and an increase in viscoelasticity accompanying an increase in galactomannan and NaC concentrations. Azero and Andrade [24] investigated the frequency dependence of G′ and G″ for κ‐carrageenan solutions at 1.0 and 1.2 g l−1 and for 3:1 κ‐carrageenan/Prosopis juliflora seed gum mixed solutions at 1.0 g l−1 total polymer concentration. For the mixed solution, no synergy is observed. On the other hand, self‐supporting gels obtained by mixing κ‐carrageenan and Prosopis juliflora seed gum or GG in 0.25 mol L−1 KCl at 10 g l−1 total polymer concentration show similar mechanical properties.
Xu et al. [14] investigated the storage modulus of spruce GGM‐konjac glucomannan (GGM/KGM) mixtures with respect to the polysaccharide ratio. The storage modulus is significantly lower when the GGM ratio increases in the mixtures. This indicates that no synergistic interaction occurs in the applied conditions (total polysaccharide concentration 0.5 wt%, 1 Hz, 25 °C). Mixtures of GGM and GG, LBG, and carrageenan show a significant reduction in the storage modulus G′. The mixture of GGM and xanthan shows a different behavior from other polysaccharides. It has a relatively high value of G′, which indicates that synergistic interaction might exist in this mixture [14]. MBG (0%, 0.1%, 0.35%, 0.5%, 0.7% w/w, d.b.)‐ RS (6% w/w) mixtures' rheological behavior (6.3–63 rad/s, 1% strain and 25 °C) was investigated, and the results were modeled by the natural logarithm of the storage modulus (Eq. 5.3), loss modulus (Eq. 5.4), and angular frequency. The RS–MBG pastes display true gel‐like behavior, with much higher G′ values than G″ values, showing a small dependence on frequency (n′ = 0.057–0.094). The magnitudes of k′ also increase with an increase in the MBG concentration from 0.1% to 0.7% [15]. Mixed solutions of xanthan and galactomannan isolated from seeds of Delonix regia at 0.1% total gums at room temperature (25 °C) make a gel with the maximum elastic modulus at the ratio of xanthan (native, de‐pyruvated, and deacetylated) to galactomannan of 2:1. The largest elastic modulus is observed in the mixture solution of deacetylated xanthan. However, a small elastic modulus is obtained in the mixture with de‐pyruvated xanthan. These results suggest the pyruvate groups may take part in the intermolecular interaction with galactomannan [17].
The synergistic interactions of two nonconventional galactomannans (G. triacanthos galactomannan (mannose/galactose ratio [M/G] = 2.82) and Sophora japonica galactomannan (M/G = 5.75)) with κ‐carrageenan and xanthan were quantified (0.1–100 rad s−1 range at 25 °C and strain amplitude of 5%) and compared with GG and LBG with the same polysaccharides [25]. The mechanical spectra of the mixed polysaccharide gels are characterized by a modest dependency of the shear storage modulus over the entire range of frequencies (G′ is almost independent of the frequency for ω > 1 rad s−1). For κ‐carrageenan/galactomannans mixtures, the synergistic interactions are stronger for mixtures of 60:40 (% w/w) κ‐carrageenan/LBG, 60:40 (% w/w) κ‐carrageenan/S. japonica galactomannan, 80:20 (% w/w) κ‐carrageenan/GG, and 60:40 (% w/w) κ‐carrageenan/G. triacanthos galactomannan. For all xanthan/galactomannans systems, the maximum synergy is observed for a ratio of 20:80 (% w/w) [25]. Comparing the elastic modulus of mixtures containing 6% (d.b.) RS and 0.5% (d.b.) of various hydrocolloids (xanthan, MBG gum, carrageenan, gelatin, carboxylmethylcellulose, gum arabic, and konjac), the RS–MBG mixture shows the highest values of both moduli (G′ and G″) and the lowest tan δ among other RS–hydrocolloid blends, indicating that the elasticity and viscosity of gels formed by RS and MBG are larger than those of RS and other gums (1% strain, frequency range 1–10 Hz, 25 °C). G′ changes slightly with frequency in the range of the sweeping frequency, suggesting that the gel formed by RS–MBG belong to a strong gel. The tan δ of RS–MBG gel (around 0.1519–0.157) is higher than RS alone in the low‐frequency range (1 < ω < 6 Hz), but they are roughly equivalent in the high‐frequency range (6 < ω < 10 Hz) [26].
Sorghum (Sorghum saccharatum) starch and cactus (Opuntia ficus‐indica) mucilage blends with the ratios of 90:10 and 95:5 (g:g) are characterized by the frequency sweep test (0.1 to 100 rad/s, at a stress of 3 Pa). Both blends show the character of a physical gel since there is a predominance of the storage modulus over the applied frequency range (G′ > G″). The storage modulus (G′) and loss modulus (G″) in samples with 90:10 starch: mucilage mixture are about three times and twice those at the starch mechanical spectra alone, respectively, suggesting a rearrangement in the starch–mucilage system structure. A decrease in the frequency dependence of gel moduli values is observed with mucilage addition in a concentration‐dependent fashion, determined by a decrease in the slope's value (n′ and n″) from 0.1 to 0.05 for log G′ and from 0.19 to 0.13 for log G″ in the frequency sweep profiles [27]. Frequency sweep data for Gleditsia triacanthos (Gt) gum‐tapioca starch blends (0.1–10 Hz, 0.2 Pa in LVE) show that G′ and G″ of the blends increase as Gt gum in the mixtures increases [19].
SSG–GG at 1:3exhibits the behavior of entangled polymer solutions with two crossover point at low frequency (0.35 and 7.12 Hz), whereas at 1:1 and 3:11 ratios it behaves as a typical gel [18]. The frequency dependence of G′ decreases as the SSG fraction in mixtures increases, as indicates by the decreasing value of the power‐law index (n′) (Eq. 5.3). The elastic character is less pronounced in the case of 1:3SSG–GG (tan δ > 1) than that of other ratios (tan δ < 1). The slope of the complex viscosity with increasing frequency on a double logarithmic scale decreases with as the GG fraction increases, suggesting the transition to an entangled polymer solution. The difference between the complex and dynamic viscosities increases as the SSG fraction increases, which again confirms a higher elasticity for the component as the SSG fraction in the mixture is increased. The generalized Maxwell models (Eqs. 5.6 and 5.7) are commonly used to estimate the relaxation time in dynamic tests in biological materials [18]:
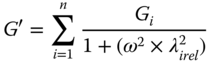
where the subscripts refer to the different mechanical elements in the system, G is the relaxation modulus (Pa), and λ rel is the relaxation time (s). Also, the strength of the network and the number of interactions between the biopolymers, at all gum ratios, are assessed by using the material stiffness parameter, A a (Pa rad−α sα), and the order of the relaxation function, α (dimensionless), respectively, obtained from the Friedrich and Heymann [28] model parameters:

As the GG fraction in SSG–GG blends increases, the values of G, λ rel , and A a decrease, whereas the relaxation function (α) increases [18]. SSG–XG at 1:3, 1:1, and 3:1 ratios (1% w/w) shows strong shear‐thinning behavior characterized by values less than 0.26 for the power index of the complex viscosity, which increases as the SSG fraction of blends increases [11]. The viscoelastic functions (G′ and G″) of SSG–XG blends obey power‐law frequency dependence. In regard to the n′ (Eq. 5.3) value, the general tendency of all blends to exhibit elastic gel behavior at any frequency range (0.01–0.1, 0.1–1, and 1–10 Hz) is found. At middle and high‐frequency ranges (0.1–1 and 1–10 Hz), the lowest frequency dependence of G′ is observed for 3–1 SSG–XG among other blends. tan (δ) for all samples is less than 1, confirming solid‐like behavior, and it decreases with as the SSG fraction increases, especially in the range 1–10 Hz, indicating a greater influence of SSG gum on the elasticity property than on the viscosity property of the blend systems relative to XG. tan (δ) values of all blends decrease with frequency, indicating the systems are in a pre‐gel regime [29]. The η*/η′, which represents the extent of the elastic component that sustained small deformation in small amplitude oscillatory shear (SAOS), increases with increasing SSG ratio in mixed gum dispersions. With decreasing SSG fraction, the magnitudes of A a decrease. The lowest and highest values of the relaxation function are found for 3:1 SSG–XG (0.11) and 1:1 SSG–XG (0.17), respectively, which confirms the highest shear thinning in SAOS for 3:1 SSG–XG [11].
5.3.4 Temperature Effect
5.3.4.1 Temperature Effect in an Isothermal Condition
The effect of temperature on the interaction of biopolymers was probed by a number of rheological tests such as the stress/strain sweep, frequency sweep, and creep/recovery test in the isothermal mode.
Rafe et al. [30] studied the frequency sweep of β‐lactoglobulin‐basil seed gum mixtures (BLG–BSG) after heating to 90 °C. The mixtures develop a relatively weak gel at different heating rates; however, this property is more pronounced when BSG is added (the higher the BSG concentration, the lower the n ′ value of Eq. 5.3). The addition of BSG) to BLG solution reduces the phase angle and strengthens the BLG gel.
The transient viscoelastic rheological behaviors of the SSG–XG blends at various ratios (1:3, 1:1, and 3:1 SSG–XG) and temperatures (10, 30, and 50 °C) were investigated using creep and recovery analyses at 1 Pa during 300 s at each stage in the linear viscoelastic range [31]. Compliance experimental data were fitted by means of the four‐component Burger model (Eq. 5.9) and an empirical model (Eq. 5.10) for creep and recovery phases, respectively, as follows [31]:

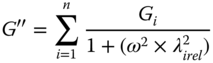
where J 0C is the instantaneous elastic compliance (Pa−1) of the Maxwell spring, J 1C is the elastic compliance (Pa−1) of the Kelvin–Voigt unit, λ ret is the retardation time (s) of the Kelvin–Voigt component, and η 0 is the Newtonian viscosity (Pa s) of the Maxwell dashpot. C is the parameter that defines the recovery speed of the system. J ∞ and J 1R are the recovery compliance of the Maxwell dashpot and the Kelvin–Voigt element, respectively. When t → 0, J R is equal to J ∞ + J 1R , which corresponds to the maximum deformation of the dashpots in the Burger model. For t → ∞, J R is equal to J ∞, as it corresponds to the irreversible sliding of the Maxwell dashpot [31]. In addition, the final percentage recovery (%R) of the entire system can be calculated by the following equation [31]:
where J max is the maximum compliance value for the longest time (300 s) in the creep test. Typical compliance curves, fitted by Burger model for 1:1 SSG–XG at 10, 30, and 50 °C, are presented in Figure 5.1. For 3:1 SSG–XG, the maximum compliance (J max ), retardation time (λ ret ), contribution of viscous flow compliance to deformation (J 2C *), relaxation exponent (n), contribution of retarded creep compliance to deformation (J 1C *), retarded recovery compliance (J 1R ), residual compliance (J ∞ ), and the percentage participation of the residual compliance to deformation (J ∞ *) reduce as the temperature increases from 10 to 50 °C, while the reverse behavior is found for the other ratios, which could be attributed to the immiscibility of the 1:1 and 1:3 SSG–XG mixtures. On the other hand, the instantaneous creep elastic compliance percentage (J 0C *), the percentage deformations of the instantaneous recovery elastic element (J 0R *), η 0, C, and %R, for 3:1 SSG–XG decrease as temperature increases, while other gum blends show the opposite trend [31].
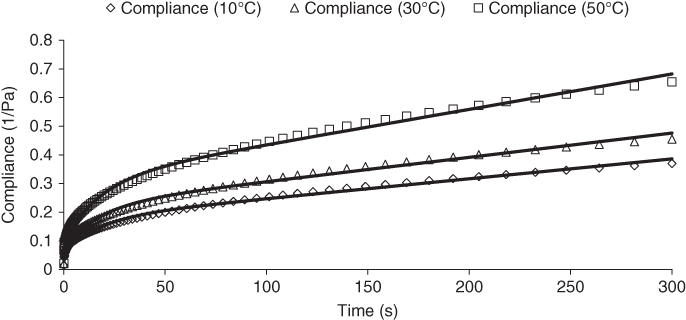
Figure 5.1 Compliance versus time curves in the creep test, fitted by the Burger model for 1:1 SSG‐XG at 10, 30, and 50 °C.
Source: Adapted from Razavi et al. [31] with permission from John Wiley and Sons.
Table 5.1 Storage modulus (G′), loss modulus (G″), complex modulus (G*), and loss tangent (tan δ) for various sage seed gum:xanthan ratios and temperatures, as determined by frequency sweep tests (f = 1 Hz, 1% w/w, γ = 0.01%).
Source: Adapted from Behrouzian et al. [32] with permission from John Wiley and Sons.
| SSG–XG | T (°C) | G′ (Pa) | G″ (Pa) | G* (Pa) | tan (δ) |
| 1:0 | 10 | 27.42 ± 3.24 | 14.08 ± 1.46 | 30.82 ± 3.55 | 0.51 ± 0.01 |
| 3:1 | 10 | 19.77 ± 4.44 | 9.34 ± 0.93 | 20.85 ± 4.44 | 0.23 ± 0.02 |
| 1:1 | 10 | 25.47 ± 1.11 | 11.30 ± 0.13 | 27.49 ± 1.08 | 0.37 ± 0.01 |
| 1:3 | 10 | 20.12 ± 3.56 | 6.62 ± 1.02 | 21.18 ± 3.70 | 0.32 ± 0.03 |
| 0:1 | 10 | 32.14 ± 0.91 | 8.24 ± 0.10 | 33.18 ± 0.86 | 0.25 ± 0.01 |
| 1:0 | 30 | 60.92 ± 2.47 | 9.90 ± 0.54 | 61.72 ± 2.52 | 0.16 ± 0.02 |
| 3:1 | 30 | 57.21 ± 5.09 | 11.26 ± 3.46 | 62.31 ± 4.38 | 0.19 ± 0.07 |
| 1:1 | 30 | 32.63 ± 1.05 | 11.85 ± 0.13 | 34.71 ± 0.91 | 0.36 ± 0.01 |
| 1:3 | 30 | 30.11 ± 3.91 | 9.50 ± 1.53 | 32.53 ± 4.19 | 0.30 ± 0.02 |
| 0:1 | 30 | 26.42 ± 1.29 | 7.43 ± 0.38 | 27.44 ± 1.35 | 0.28 ± 0.01 |
| 1:0 | 50 | 44.19 ± 3.43 | 8.35 ± 1.87 | 46.75 ± 3.04 | 0.18 ± 0.05 |
| 3:1 | 50 | 31.62 ± 5.85 | 7.31 ± 0.69 | 32.46 ± 5.86 | 0.23 ± 0.02 |
| 1:1 | 50 | 40.17 ± 1.86 | 13.03 ± 0.68 | 43.18 ± 1.98 | 0.32 ± 0.01 |
| 1:3 | 50 | 9.60 ± 0.98 | 4.21 ± 0.15 | 10.48 ± 0.95 | 0.44 ± 0.03 |
| 0:1 | 50 | 21.15 ± 2.69 | 6.78 ± 0.58 | 22.21 ± 2.73 | 0.31 ± 0.01 |
| 1:0 | 70 | 58.79 ± 4.39 | 6.37 ± 0.11 | 59.13 ± 4.38 | 0.11 ± 0.01 |
| 3:1 | 70 | 35.82 ± 5.42 | 7.11 ± 0.54 | 36.54 ± 5.20 | 0.20 ± 0.04 |
| 1:1 | 70 | 21.69 ± 0.64 | 8.94 ± 0.11 | 23.45 ± 0.64 | 0.41 ± 0.04 |
| 1:3 | 70 | 8.89 ± 0.52 | 10.28 ± 1.33 | 13.61 ± 0.67 | 1.28 ± 0.03 |
| 0:1 | 70 | 18.59 ± 0.30 | 6.91 ± 0.08 | 19.37 ± 0.31 | 0.38 ± 0.01 |
| 1:0 | 90 | 90.89 ± 4.87 | 10.84 ± 0.07 | 91.53 ± 4.74 | 0.12 ± 0.01 |
| 3:1 | 90 | 54.59 ± 1.43 | 11.97 ± 1.11 | 55.90 ± 1.16 | 0.22 ± 0.03 |
| 1:1 | 90 | 38.16 ± 3.47 | 13.29 ± 1.80 | 40.40 ± 3.87 | 0.35 ± 0.02 |
| 1:3 | 90 | 8.01 ± 0.62 | 10.07 ± 0.26 | 12.88 ± 0.18 | 1.13 ± 0.02 |
| 0:1 | 90 | 18.10 ± 2.01 | 7.51 ± 0.25 | 20.05 ± 1.95 | 0.41 ± 0.06 |
The temperature effect on the interaction behavior of SSG–XG at the temperature levels of 10, 30, 50, 70, and 90 °C was investigated using strain sweep tests [32]. With increasing SSG fraction, the effective range of the applied temperature on G′ LVE shifts to a higher temperature, which is the most effective temperature range for SSG dispersion, and the average value of G′ s(n‐LVE) increases. As temperature increases from 10 to 90 °C, the G′ LVE , and τ f of 3:1 SSG–XG increases from 21.89 to 34.08 Pa and 4.52 to 8.98 Pa, respectively, whereas the τ f of 1:3SSG–XG decreases from 7.50 to 5.35 Pa in the similar temperature range. Among the various ratios, 1:3 SSG–XG shows the highest value of tan (δ) LVE up to 50 °C, and 3:1 SSG–XG shows the highest value of the tan (δ) s(n‐LVE) parameter at 50 °C among the other blends and temperatures. Behrouzian et al. [32] performed frequency sweep measurements within the LVE range over the frequency range 0.01–10 Hz and at various temperatures (10–90 °C) on different SSG–XG ratios (1:3, 1:1, and 3:1). Table 5.1 demonstrates G′, G″, G *, and tan δ at a frequency of 1 Hz for different mixtures at different temperatures. The mechanical spectra for 1:3SSG–XG at 70 and 90 °C show the behavior of an entangled polymer solution, with G′ dominating over G″ in the high‐frequency range and crossover points at the frequencies of 0.90 Hz and 2.84 Hz at 70 and 90 °C, respectively. Other blends do not show crossover at any temperature. G′1Hz for 3:1 SSG–XG increases from 19.77 Pa at 10 °C to 54.59 Pa at 90 °C, whereas the 1:3blend decreases from 20.12 to 8.01 Pa in this range of temperature. G″1Hz of all blends increase with temperature from 10 to 90 °C. All blends display gel‐like behavior because the slopes of the double logarithmic plots of G′ and G″ against frequency (Eqs. 5.3 and 5.4) are positive (n = 0.08–0.43 and n″ = 0.07–0.43) and much lower than those reported for a Maxwell fluid (G′ ∞ ω 2 and G″ ∞ ω). The magnitudes of k′ are much higher than k″ at any temperature and gum ratio, confirming the gel‐like behavior of these systems, whereas the exception is 1:3SSG–XG at 70 and 90 °C, which shows a reverse trend. Generally, the k′/k″ ratio noticeably increases as the temperature increases from 10 to 90 °C for dispersions with a high SSG fraction (3:1 and 1:1 SSG–XG), indicating an increase in the number of physically active bonds. tan δ (1 Hz) exceeds unity for 1:3SSG–XG at 70 and 90 °C, confirming the predominantly viscous behavior. On the other hand, the value of this parameter is within the range of 0.11–0.51 for the other blends and temperatures, indicating more elastic behavior. Based on a double logarithmic scale, the complex viscosity (η*) of any gum sample at various temperatures decreases linearly with increasing frequency, indicating a non‐Newtonian shear‐thinning flow behavior. 3:1 and 1:3SSG–XG dispersions show the lowest shear‐thinning properties at 10 °C (n * of Eq. 5.5 equal to −0.70) and 90 °C (n * of Eq. 5.5 equal to −0.56), respectively. Figure 5.2 represents the dependence of the dynamic viscosity (η′) and complex viscosity (η*) with gum ratios at the frequency of 1 Hz and 50 °C. As the SSG fraction of the blends increases, the difference between η* and η′ increases, with the highest and lowest differences being for SSG and 1:3SSG–XG, respectively, which show the developed elastic component with an increase in the SSG fraction and the least elastic component for 1:3SSG–XG at 50 °C. The relaxation time of 3:1 SSG–XG increases from 10.17 Pa at 10 °C to 13.63 Pa at 90 °C, while it decreases from 8.40 to 4.34 Pa for 1:3SSG–XG. The increase in relaxation time of 3:1 SSG–XG could be associated with the formation of intermolecular aggregates, which is facilitated by temperature for SSG [32].
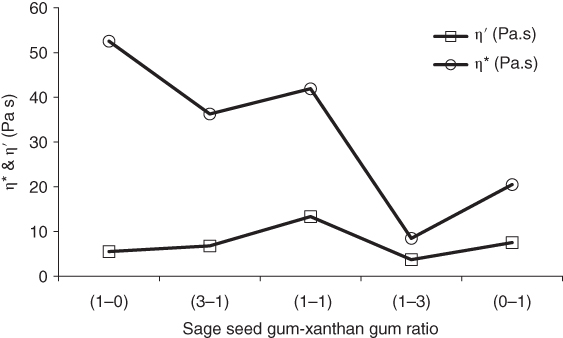
Figure 5.2 Dynamic viscosity (η′) and complex viscosity (η*) of sage seed gum, xanthan gum, and their blends (1 Hz and 50 °C).
Source: Adapted from Behrouzian et al. [32] with permission from John Wiley and Sons.
5.3.4.2 Temperature Effect in a Non‐isothermal Condition
The effect of temperature on the interaction of biopolymers could be probed by temperature table sweep in the non‐isothermal mode, using different temperature programs such as the linear temperature program (temperature gradient sweep (TGS)) and nonlinear temperature program (e.g., table temperature sweep (TTS) and temperature profile sweep (TPS)), which are discussed in this section.
To study the rheological properties of mixtures of κ‐carrageenan (κ‐car) from H. musciformis and galactomannan from CJ at a total polysaccharide concentration of 5 g l−1, Andrade et al. [22] first performed a temperature sweep experiment from 85 to 15 °C at the rate of 1 °C min−1 and a constant frequency of 6.28 rad/s, followed by a time sweep experiment at the same frequency and a frequency sweep, both at 5 °C. Then, the temperature was raised to 25 °C at a constant rate of 1 °C min−1, and new time sweep and mechanical spectrum experiments were performed. Finally, the temperature was increased to 85 °C at the rate of 1 °C min−1. The gelation temperature, T g (the temperature at which a definitive and sharp increase in G′ is observed), is 55 °C for κ‐car, 60 °C for κ‐car/LBG, and 72 °C for κ‐car: CJ, which shows that galactomannan addition to κ‐car increases T g . The effect is more pronounced for CJ than for LBG in the above conditions. Also, when the cured gels are heated from 25 to 85 °C, the melting temperature, T m , is 74–75 °C for κ‐car and higher than 85 °C for the mixed systems. The thermal hysteresis is higher for the κ‐car/Gal mixtures than for κ‐car alone [22]. The rheological behavior of GGM/KGM mixtures in the 1:1 ratio with a total polysaccharide concentration of 0.5 wt% at 1 Hz by controlling the temperature from 80 to 5 °C shows that, like GGM and KGM on their own, the G′ and G″ of the mixtures increase upon cooling. G′ is below G″ throughout the cooling process from 80 to 5 °C, showing the solution to be a viscous system. The difference between G′ and G″ is smaller when the temperature is lower [14].
The effect of temperature on the elastic modulus of a mixed solution of xanthan and Delonix regia seed galactomannan was investigated over the temperature range 0–45 °C and raised stepwise at the rate of 1 °C min−1 [17]. A mixture of xanthan to galactomannan in the ratio of 1:2 exhibited a large elastic modulus. G′ decreased a little with an increase in temperature up to 25 °C, which was estimated to be a transition temperature, then decreased rapidly. The transition temperature was also observed in mixing ratios of 3:1 and 4:1 at 25 and 30 °C, respectively. A hardly changeable elastic modulus was observed in the mixing ratio of 1:4 as in xanthan alone, a phenomenon which might be attributed to intramolecular hydrogen bonding and van der Waals interaction within the xanthan molecule. The effect of temperature on the dynamic viscoelasticity of the xanthan–Delonix regia seed galactomannan mixed solution (0.1%) at a mixing ratio of 1:2 was compared with those for 4 M urea‐added (is known as a hydrogen bonding breaker) or CaCl2‐added (6.8 mM) dispersions. The elastic modulus and dynamic viscosity of the mixed solution with urea or CaCl2 are lower than those with polysaccharide alone, which suggests that hydrogen bonding is involved in the interaction and dissociates above the transition temperature. It also suggests that the side chains of the xanthan molecules take part in the interaction because the small dynamic viscoelasticity should be attributed to the formation of Ca2+ bridges between the carboxyl groups of the glucuronic acid residues of the intermediate side chain of xanthan on different molecules [17].
The synergistic interactions of G. triacanthos galactomannan and Sophora japonica galactomannan with κ‐carrageenan and xanthan on temperature sweep behavior were quantified and compared with GG and LBG by Pinheiro et al. [25]. To perform the temperature sweeps, each sample was heated to 70 °C, equilibrated for 5 min, and then cooled from 70 to 25 °C (for systems with xanthan) or 20 °C (for systems with κ‐carrageenan). A time sweep of 90 min was then performed, and the system was heated back to 70 °C. A rate of 2 °C min−1 was used at a constant frequency of 6.279 rad s−1. For κ‐carrageenan/galactomannan systems, T m seems to be dependent on the galactomannan present in the blend: the highest values are obtained for LBG and S. japonica galactomannan, and the lowest value is obtained for G. triacanthos galactomannan followed by GG. These systems are thermally reversible, and a significant (p < 0.05) thermal hysteresis is observed between melting and gelation in accordance with previous findings. For XG, no thermal hysteresis is detected between melting and gelation. This behavior is a consequence of the full reversibility of the disorder–order transition of xanthan. These results show that the gelation and melting temperatures of these systems are related (although not directly) to the galactomannan M/G ratio, among other characteristics such as the fine structure and molecular weight of galactomannans [25].
The effects of the heating rate (0.5, 1, 5, and 10 °C min−1) on the rheological behavior of BSG‐ β‐lactoglobulin (BLG) gel at different ratios (20:1, 10 : 1, 5 : 1, and 2:1) were studied using the TGS program for a temperature increase from 20 to 90 °C. The gelation temperature of BLG reduces by when the heating rate decreases and the BSG ratio increases. The maximum G′ at the end of the heating period is greatly decreased by decreasing the BLG:BSG ratio. Addition of BSG to 10% BLG solution leads to the formation of a separated phase network in which increasing the BSG content induces a very fine stranded protein structure [30]. In another study, Rafe et al. [33] employed TGS at a scan rate of 1 °C min−1 from 20 to 90 °C, and samples were set at 90 °C for 30 min. The effect of heating on the elastic modulus of BSG‐BLG mixed gels containing four different ratios is shown in Figure 5.3. Upon heating–cooling time of BLG–BSG mixtures and returning to the original temperature, mixed gels exhibit a biphasic profile: the first phase is characterized by a sharp increase in the storage modulus in which gelation of BLG occurs, and the second phase exhibits an increase in the storage modulus corresponding to the build‐up of a BSG network. The biphasic profile of mixed gels suggests that phase separation of the polymers occurs. During cooling, the presence of BSG has a synergistic effect on gel‐forming and the rebuilding of new structures [33].

Figure 5.3 Storage modulus (G′) development for different ratios of basil seed gum‐ β‐lactoglobulin as a result of heating from 20 to 90 °C at 1 °C min−1 and holding for 30 min (frequency 1 Hz; strain 0.5%).
Source: Adapted from Rafe et al. [33] with permission from Elsevier.
Razavi et al. [34] investigated three different temperature programs on the interaction behavior of SSG–XG blends at different ratios (1:3, 1:1, and 3:1) in the range 10 to 90 °C. During TGS, the temperature was steadily (linear sweep) increased/decreased at a heating/cooling rate of 1 °C min−1. In TPS, the temperature was programmed to increase (at the rate of 11 °C min−1), decrease (at the rate of −11 °C min−1), and hold (at 90 °C for 5 min). In this mode, the temperature was steadily changed by setting eight steps (time at each step = 1 min). In TTS, the temperature was steadily increased/decreased at a heating/cooling rate of 36 °C min−1 in 17 linearly distributed steps (time at each step = 16 s). The results of the temperature sweep rheological tests show that during heating and cooling, G* increases as the SSG fraction increases. In addition, the G* of 3:1 SSG–XG increases as the temperature increases, especially in the range of 70–90 °C, in the heating stages of all used temperature sweep modes (TSMs), except in the range 10–50 °C, in which the G* of 3:1 SSG–XG is almost unchanged. On the other hand, the G* values of 1:3and 1:1 SSG–XG reduce as the temperature increases, mainly in the range of 50–70 °C, except for 1:1 (obtained from TGS and TTS) and 1:3SSG–XG (obtained from TGS and TPS) in the range 70–90 °C. The percentage change in G* per degree Celsius from TTS for all SSG fractions is far less than the two other TSMs at both heating and cooling stages due to the higher heating rate at TTS (36 °C min−1), indicating the lower capacity of TTS to impact the strength of the gum network. In addition, all samples show strong thermal hysteresis, which increases as the SSG fraction increases. It is worth mentioning that the temperature profile sweep is the only temperature program with the capability to describe the time dependency of samples. In this way, the Weltman model was applied to describe the time‐dependent complex modulus properties of SSG–XG dispersions during heating and cooling stages at 10, 30, 50 and 70 °C and the holding stage at 90 °C. The values of Weltman's coefficient of thixotropic breakdown (B) of 3:1 SSG–XG, which indicates the extent of thixotropy, increase as the temperature increases. By contrast, the B parameter of the 1:1 and 1:3SSG–XG samples decreases as the temperature increases. When cooling, all gum samples show the increasing trend of time dependence [34].
5.3.4.3 Kinetics of Biopolymer Interaction
The main objective of kinetic studies is to develop a mathematical model to describe the reaction rate as a function of experimental variables such as temperature. This can be done under both isothermal and non‐isothermal conditions, each of which has its own merits and demerits [35].
5.3.4.3.1 Kinetics of Biopolymer Interaction in Isothermal Condition
The rate equation is usually determined for isothermal conditions [35]. The temperature dependence of the rate constant is then determined from the Arrhenius equation. The temperature dependence of some characteristics mentioned in Section 5.3.4.1 could be described by an Arrhenius‐type equation [32]:
where A is the proportionality constant, C is the temperature dependence parameter (kJ mol−1), R is the universal gas constant (kJ mol−1 K−1), and T is the absolute temperature (K). Among the gum ratios (1:3, 1:1, and 3:1), 3:1 SSG–XG shows the lowest temperature dependence of all rheological parameters, except G′ s(n‐LVE) , which suggests at this ratio, SSG makes the influence of temperature on the rheological behaviors less effective. The highest temperature dependence of G′ LVE and G″ LVE for the 3:1 blend is in the range 70–90 °C. Among all parameters, 3:1, 1:1, and 1:3SSG:XG ratios show the highest C value of G′ s(n‐LVE) , τ y , and τ f , respectively, and the lowest C value of G′ LVE , G″ LVE , and tan (δ) LVE , respectively. 3:1 and 1:1 SSG–XG show the least temperature sensitivity of k' (Eq. 5.3) and k″ (Eq. 5.4), respectively. The highest C (tan (δ)1Hz ) is found for 1:3SSG–XG (133.27 kJ mol−1), while 1:1 SSG–XG shows the lowest C (tan (δ)1Hz ) value (4.37 kJ mol−1). For all gum ratios and frequencies in the range 0.01–10 Hz, C (η*) is higher than C (η′), which shows a lower temperature tolerance of the elastic component than the viscous one. At 0.01–10 Hz, the least difference between C (η*) and C (η′) is observed for 3:1 SSG–XG, which indicates the lowest temperature sensitivity of the elastic component for 3–1 SSG–XG. In the frequency range 0.01–10 Hz, the highest C (η′) is found for 1:3SSG–XG, and the lowest C (η′) is achieved for 3–1 SSG–XG. 1:3SSG–XG shows the highest C (λ t ), while 3–1 SSG–XG exhibits the lowest value [32]. Razavi et al. [34] studied the temperature dependence of the time‐dependent parameter (C (B)) from the temperature profile mode of the dynamic temperature sweep (DTS) test at both heating and cooling stages for all gum blends. At both stages, C (B) increases with the SSG fraction, indicating the increased temperature sensitivity of the structure.
5.3.4.3.2 Kinetics of Biopolymer Interaction in Non‐isothermal Condition
Investigation of kinetics based on the isothermal method has several drawbacks, especially at high temperatures. Since instantaneous heating or cooling of the sample to the desired temperature cannot be achieved in kinetic experiments, thermal lag correction may be required. A non‐isothermal method can overcome the problem associated with thermal lag in kinetic studies and simplify the collection of data [35]. A number of thermal analysis techniques using non‐isothermal temperature programs have been developed, such as the DTS tests. Structure development or degradation of samples could be characterized by the non‐isothermal kinetic analysis proposed by Rhim et al. [35] based on a combination of the classic rate equation, Arrhenius equation, and time–temperature relationship. The general form of non‐isothermal kinetics based on the complex modulus (G*) from DTS data yields the following:

where m is the reaction rate order, t (s) is time, k 0 is the Arrhenius pre‐exponential or frequency factor, E a is the activation energy (kJ mol−1), R is the universal gas constant (kJ mol−1 K−1), and T is the absolute temperature (K).
In this way, three different temperature sweeps, which are defined in Section 5.3.3.2, could be employed. Razavi et al. [34] studied the activation energy using Eq. 5.13 for SSG–XG at different ratios (3:1, 1:1, and 1:3) in three different temperature sweep modes. E a at the heating stage increases as the SSG fraction increases, with the highest and lowest E a values for 3:1 and 1:3 SSG–XG, respectively, which shows that the former blend's network is more sensitive to temperature than the latter blend's. On the other hand, E a decreases as the SSG fraction increases during the cooling stage in TTS. The m parameter indicates the dependence between the rate of structure development or degradation and structure in the material [36]. The m value of all blends is 2 in TGS and TPS, as well as in 1:3SSG–XG in TTS at both heating and cooling stages; however, 3:1 and 1:1 SSG–XG are first order in TTS during these stages [32].
5.3.4.4 Time–Temperature Superposition Principle
The well‐known time–temperature superposition principle (TTSp) is applied to determine either the temperature dependence of the rheological behavior of a biopolymer or to expand the time or frequency regime at a given temperature [37]. Razavi et al. [34] tested TTSp for G′ and G″ in the frequency sweep test (0.01–10 Hz). The rheological parameters obtained in the temperature range 10–90 °C were tentatively reduced to an arbitrary reference temperature (50 °C), using TTSp [38]. TTSp cannot be applied to the superposition of G′ and G″ (ω) for 1:3and 1:1 SSG–XG dispersions; in contrast, it is applied successfully for the dynamic shear test data of 3:1 SSG–XG. Good superposability of TTSp suggests that 3:1 SSG–XG is thermorheologically simple during the dynamic shear test; whereas lack of superposability of the isothermal frequency curves indicates that the other dispersions are thermorheologically complex [34]. Generally, immiscible blends will not obey TTSp due to the different temperature dependences of both components [37], which are observed for 1:3and 1:1 SSG–XG blends [34]. However, the strong interaction between the components plays a role which may result in single‐temperature dependence [39], as observed for 3:1 SSG–XG, which has the lowest incompatibility among other mixtures as shown by the lowest incompatibility parameter (ψ, see Section 5.4). a
T
is the ratio of the maximum relaxation time at different temperatures to the maximum relaxation time at the reference temperature (T
r
), and b
T
is a temperature‐density correction factor (![]() ) [40]. The a
T
value of 3:1 SSG–XG almost decreases with increase in temperature. The Arrhenius equation adequately describes the temperature dependence of the shift factors (R2 ≥ 0.91 and RMSE ≤0.05). The E
a
values of 3:1 SSG–XG and SSG are 39.39 and 102.03 (kJ mol−1), respectively, which suggests that an almost three times higher relaxation energy is required for 3:1 SSG–XG. Furthermore, TTSp helps obtain rheological information over a wider range of frequency of 0.002–20 Hz for 3:1 SSG–XG than what is obtainable by the normal instrumental methods of measurement (0.01–10 Hz) [34].
) [40]. The a
T
value of 3:1 SSG–XG almost decreases with increase in temperature. The Arrhenius equation adequately describes the temperature dependence of the shift factors (R2 ≥ 0.91 and RMSE ≤0.05). The E
a
values of 3:1 SSG–XG and SSG are 39.39 and 102.03 (kJ mol−1), respectively, which suggests that an almost three times higher relaxation energy is required for 3:1 SSG–XG. Furthermore, TTSp helps obtain rheological information over a wider range of frequency of 0.002–20 Hz for 3:1 SSG–XG than what is obtainable by the normal instrumental methods of measurement (0.01–10 Hz) [34].
5.3.5 Effect of Salts
The interaction behavior of GGM/KGM was assessed by the addition of 0.05 M NaCl to the mixtures. The G′ values do not change at low frequencies but decrease dramatically at higher frequencies. Further addition of NaCl to 0.5 M NaCl does not affect the mixture more. Both purified GGM and GGM/KGM at 1:1 ratio with the addition of salt show a viscous character, while KGM with the addition of salt shows an elastic character with the storage modulus G′ being greater than the loss modulus G″ throughout the frequency range [14]. The effect of Ca2+ (0.01–0.5 M) on the gelation of mixed systems of 10% BLG and 1% BSG was investigated [41]. When the Ca2+ concentration increases, the storage moduli of BLG and BSG gels increase BLG gel and BSG network formation, suggesting that phase‐separated gels are formed. In addition, higher strength is obtained for the BLG–BSG mixture at higher Ca2+ concentrations. Rheological tests on a mixture of 10% BLG–1% BSG were carried out at different Ca2+ concentrations in the time sweep mode. The gelling point temperature at 0.01 CaCl2 is less than two other concentrations, and this is the optimum Ca2+ ion for gel formation. At 0.1 M CaCl2, the storage modulus is greater than the other concentrations [41].
5.3.6 Effect of pH
In the BLG–BSG mixture, BSG has a strong synergistic effect on G′, and its presence causes the effect of pH on gelation to be opposite of when only protein is in solution. The gelling point of the 10% BLG–1% BSG mixed gel is strongly pH‐dependent, and stiffer gels form at higher pH. The storage modulus of the mixture decreases when the pH increases from 4.5 to 7.5, but the pH value 5.5 is an exception, in that the mixture shows the highest elasticity. At this pH, the highest G′ for 10% BLG and 1% BSG is about 197 and 43.7 kPa, respectively; however, the highest G′ for mixed gel is about 264 kPa, indicating the synergistic effect BSG on the stiffness of mixed gel [41].
5.4 Thermodynamic
The performance of polymer mixtures depends on how they are arranged in space. The spatial arrangement is controlled by the thermodynamics [42]. Arthur et al. [9] studied the thermodynamic parameters of K. senegalensis (KS gum) and A. senegal (AS gum) blends in dilute solution by using the Frenkel–Eyring equation:

The activation energy and enthalpy change of gum flow are accounted for using the Frenkel–Eyring and Arrhenius–Frenkel models, respectively. The enthalpy change (ΔH) and activation energy of gum flow (E a ) for blends do not show a trend, although these parameters for gum blends are within those for each gum individually.
Thermodynamic incompatibility, that is, the limited miscibility of biopolymers at the molecular level, leads to separation and concentration of biopolymers within the different coexisting phases and is responsible for the functional mixing of food biopolymers, their antagonism, or synergism effects [42]. This phenomenon can be probed by investigating the Gibbs free energy, enthalpy, and entropy [5]. Razavi et al. [34] proposed a new method based on DTS data to determine the thermodynamic status of biopolymers' reaction. In this method, they supposed that biopolymer interaction is a kind of equilibrium reaction:
where w 1 and w 2 are the weight fractions of polymers in the blend (A and B), and w 3 is the weight fraction of the blend (AB). As a result, the equilibrium constant (K eq ) is calculated from G* as follows:

The equilibrium constant (K eq ) can be related to the standard Gibbs free energy change (ΔG°) in a reaction by [43]:
The entropy change and enthalpy change of the reactions are calculated on the basis of Eqs. 5.18 and 5.19, respectively [44]:
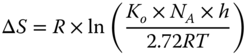
ΔS is the entropy change (J mol−1 K−1), K 0 is the frequency factor, N A is the Avogadro constant (mol−1), h is the Planck constant (J s), and ΔH is the enthalpy change (J mol−1).
The ΔG° values of sage seed gum–xanthan gum blends (SSG–XG) at different ratios (3:1, 1:1, and 1:3) using the aforementioned method are positive and increase as the XG fraction increases at 25 °C, which indicates that the interaction between SSG and XG is a non‐spontaneous reaction and cannot occur without the progressive increasing input of work from an external source as the XG fraction increases. All blends show a negative ΔS, which decreases as the XG fraction increases. Thermodynamic incompatibility of macromolecules arises from the low entropy of their mixing [45]. The enthalpy of mixing is strongly endothermic for all the blends and decreases as the XG fraction increases in blends. Miscibility can only be achieved when ΔH is negative [5]. These results confirm the immiscibility of SSG–XG blends that increase with the XG fraction [34].
Since ΔG° has a specific definition, for elaborating the thermodynamic incompatibility of biopolymers in a temperature sweep test, Razavi et al. [34] proposed the ψ parameter (−ln (K eq )) as a representative of the Gibbs free energy change. The thermodynamic incompatibility parameter of SSG–XG, ψ, increases during heating (10–90 °C) and decreases with the decrease in temperature during the cooling stages for 3:1 SSG–XG, whereas 1:1 and 1:3SSG–XG show a reverse trend. The absolute values of ψ, ΔH, ΔS, and ΔG parameters at cooling stages are higher than those at heating stages using three different temperature sweep modes (TTS, TGS, and TPS), which could be attributed to the fact that during cooling, when the molecules form a fluctuating network, higher occupancy of a mixed solution phase occurs, result in greater phase separation [46]. The results suggest that the interaction of incompatible SSG and XG is mainly due to the excluded volume effect, which is dependent upon the conformations of macromolecules [34].
5.5 Miscibility
There are numerous methods to elaborate the synergistic/antagonistic interaction behavior of biopolymers. Some of them are as follows.
5.5.1 Interaction Coefficient
For a ternary system (polymer–polymer–solvent), the interaction coefficient (α, %) could be calculated as follows [18]:

where w 1 is the weight average of the A component, and w 2 is the weight average of the B component. Among different SSG–GG mixtures (1:3, 1:1, and 3:1), 1:1 SSG–GG shows the highest %α of consistency coefficient and the flow behavior index followed by the 3:1 ratio [18]. In addition, an antagonistic interaction of the zero‐shear viscosity and time constant is present between SSG and GG at all ratios, which is the least for 3:1 SSG–GG. 1:3SSG–GG shows the highest antagonistic effect of G′, G″, and G*, whereas the highest value of A a is found for 3:1 SSG–GG (10.22 Pa rad−α sα) with the 17.55% synergism percentage, indicating that in this mixture the highest molecular binding occurs between GG and SSG [18]. Razavi et al. [31] reported that the G* LVE and A a of SSG–XG blends are lower than the values of these parameters calculated from the weight averages of the single‐component systems, confirming that no synergy is present between SSG and XG at any proportions, except for 3:1 and 1:1 SSG–XG at 50 °C, which shows the synergy of the A a parameter. At 30 °C, the storage modulus, static and dynamic yield stresses, and recovery time parameters obtained from the in‐shear structural recovery test of XG and SSG blends are lower than the values of these parameters calculated from weight averages of the single‐component systems, confirming that no synergy of these parameters is present between SSG and XG at any proportion, whereas the loss modulus, loss tangent, and power index of the complex viscosity of all gum ratios show the synergy behavior [11]. For 1:1 SSG–XG and 1:3SSG–XG, the %α of maximum compliance (J max ) and retardation time (λ ret ) increase, whereas the %α of gel strength (S) decreases with the increase in temperature; on the other hand, 3:1 SSG–XG shows a reverse trend [31]. The G* values of SSG–XG blends (1:3, 1:1, and 3:1) are lower than the value of this parameter calculated from the weight averages of the single‐component systems, confirming that no synergy is present between SSG and XG at any proportion. 3:1 SSG–XG at 50 °C shows the lowest antagonistic effect (lowest %α) of G* among the other gum blends and temperatures (10 to 90 °C) [34]. Studies by Razavi's team [11, 18, 31, 32, 34] conclude that 3:1 SSG–GG and 3:1 SSG–XG are the best synergist mixtures among the different blends of SSG with guar gum or xanthan, respectively.
5.5.2 Cole‐Cole Plot
Another method used for analyzing the antagonism/synergism effects is Cole‐Cole plots, which represent the relationship between the imaginary viscosity (η″) and dynamic viscosity (η′). This empirical method has been widely used to analyze the miscibility of polymer blends [46]. A smooth, semicircular shape of the plotted curves suggests good miscibility, and any deviation from this shape shows a heterogeneous dispersion and a poorer compatibility of the constituents of the blend. To investigate the deviation from the semicircular shape in the Cole‐Cole plots of different SSG–XG ratio dispersions, the power‐law model was fitted to all curves by Razavi et al. [11]. The power‐law index for 3:1, 1:1, and 1:3SSG–XG are 0.52, 0.97, and 0.93, respectively, which in turn shows that the semicircularity is only present for the 3:1 SSG–XG curve, while the curves of the other two blends are significantly different from this shape [11].
5.5.3 Han Curve
The Han curve method, which represents the relationship between the storage modulus (G′) and loss modulus (G″) in the log scale, has often been used to detect phase separation due to differences in structural units [47]. For a homogeneous polymer system, the Han curve is not dependent on the temperature and is generally linear. Razavi et al. [31] investigated the interaction behavior of SSG–XG using Han curves at 10, 30, and 50 °C. 3:1 SSG–XG exhibits single‐phase behavior since the plots are generally linear and not dependent on the temperature; thus, it is believed that 3:1 SSG–XG is miscible, or at least the XG fraction is finely dispersed in the SSG fraction. On the other hand, the Han curves of log G′ versus log G″ at different temperatures for 1:1 and 1:3 SSG–XG are not superimposed, confirming the immiscibility of these systems.
5.6 Conclusions and Future Trends
In this chapter, we presented a summary of findings on the rheological behavior of systems consisting of blends of novel biopolymers. The literature verifies that some emerging gums could be alternatives to some of the commercial hydrocolloids in blend formulations due to the specific properties that they impart. Comparisons of the rheological behavior of these novel blends with some of the commercial ones help the reader decide on the particular hydrocolloid among different new hydrocolloids for their specific usage and expand the applications of the emerging hydrocolloids in food and pharmaceutical systems. In addition, the thermodynamics and kinetics of biopolymer blends are described in detail to introduce a new methodology for the elaboration of biopolymer interaction, which is so important from the fundamental science point of view. Having an idea of the potential of a biopolymer blend for use in a food formulation, the preference depends on the best‐known types of blends. Therefore, before using the aforementioned gum blends in food formulation or other gum‐related industries, more needs to be known about their microstructure and physicochemical and thermal properties, which will be the subject of future works.
References
- 1 Harding, S.E., Hill, S.E., and Mitchell, J.R. (1995). Biopolymer Mixtures. Nottingham, Nottingham: University Press.
- 2 Doublier, J.L., Castelain, C., and Lefebvre, J. (1993). Viscoelastic properties of mixed polysaccharides systems. In: Plant Polymeric Carbohydrates (ed. F. Meuser, D.J. Manners and W. Seibel). Cambridge, U.K.: Royal Society of Chemistry.
- 3 Morris, V.J. (1996). Synergistic interactions with galactomannan and glucomannans. In: Biopolymer Mixtures (ed. S.E. Harding, S.E. Hill and J.R. Mitchell). Nottingham, UK: Nottingham University Press.
- 4 Foster, T.J. and Morris, E.R. (1994). Xanthan polytetramer: conformational stability as a barrier to synergistic interaction. In: Gums and Stabilizers for the Food Industry (ed. G.O. Phillips, D.J. Wedlock and P.A. Williams). Oxford: IRL Press.
- 5 Safronov, A., Suvorova, A.I., Tyukova, I.S., and Smirnova, Y.A. (2007). Opposite trends in thermodynamic compatibility between copolyamide and chitosan in their binary blend. Journal of Polymer Science: Part B: Polymer Physics 45: 2603–2613.
- 6 Chun, S.Y. and Yoo, B. (2007). Effect of molar substitution on rheological properties of hydroxypropylated rice starch pastes. Starch‐Stärke 59: 334–341.
- 7 Wang, F. (2001). Study of polysaccharide–polysaccharide interaction in solution. Master thesis. The University of Arkansas.
- 8 Brunchi, C.‐E., Bercea, M., Morariu, S., and Avadanei, M. (2016). Investigation on the interactions between xanthan gum and poly (vinyl alcohol) in solid state and aqueous solutions. European Polymer Journal 84: 161–172.
- 9 Arthur, D.E., Nnabuk, O.E., Gimba, C.E. et al. (2015). Rheological modeling of interaction existing between synergistic combination of gum Arabic and Khaya senegalensis. International Research Journal of Pure and Applied Chemistry 6 (4): 160–173.
- 10 Razavi, S.M.A., Hasan Abadi, M., Ghadiri, G.R., and Salehi, E.A. (2013). Rheological interaction of sage seed gum with xanthan in dilute solution. International Food Research Journal 20 (6): 3111–3116.
- 11 Alghooneh, A., Razavi, S.M.A., and Behrouzian, F. (2017). Rheological characterization of hydrocolloids interaction: a case study on sage seed gum‐xanthan blends. Food Hydrocolloids 66: 206–215.
- 12 Bresolin, T.M.B., Sander, P.C., Reicher, F. et al. (1997). Viscometric studies on xanthan and galactomannan systems. Carbohydrate Polymers 33: 31–138.
- 13 Perissutti, G.E., Bresolin, T.M.B., and Ganter, J.L.M.S. (2002). Interaction between the galactomannan from Mimosa scabrella and milk proteins. Food Hydrocolloids 16: 403–417.
- 14 Xu, C., Willför, S., and Holmbom, B. (2008). Rheological properties of mixtures of spruce galactoglucomannans and Konjak glucomannans or some other polysaccharides. Bioresources 3 (3): 713–730.
- 15 Feng, T., Gu, Z., Jin, Z., and Zhuang, H. (2010). Rheological properties of rice starch‐Mesona blumes gum mixtures. Journal of Texture Studies 41: 685–702.
- 16 Marcotte, M., Hoshahili, A.R.T., and Ramaswamy, H.S. (2001). Rheological properties of selected hydrocolloids as a function of concentration and temperature. Food Research and International 34: 695–703.
- 17 Tako, M., Teruya, T., Tamaki, Y., and Ohkawa, K. (2010). Co‐gelation mechanism of xanthan and galactomannan. Colloid Polymer Science 288: 1161–1166.
- 18 Razavi, S.M.A., Alghooneh, A., Behrouzian, F., and Cui, S.W. (2016). Investigation of the interaction between sage seed gum and guar gum: steady and dynamic shear rheology. Food Hydrocolloids 60: 67–76.
- 19 Cengiz, E., Karaman, S., and Dogan, M. (2015). Rheological characterization of binary combination of Gleditsia triacanthos gum and tapioca starch. International Journal of Food Properties 19 (6): 1391–1400.
- 20 Yousefi, A.R., Zahedi, Y., Razavi, S.M.A., and Ghasemian, N. (2017). Influence of sage seed gum on some physicochemical and rheological properties of wheat starch. Starch‐Starke https://doi.org/10.1002/star.201600356.
- 21 Dolz, M., Hernandez, M.J., and Delegido, J. (2008). Creep and recovery experimental investigation of low oil content food emulsions. Food Hydrocolloids 22: 421–427.
- 22 Andrade, C.T., Azero, E.G., Luciano, L., and Gonçalves, M.P. (2000). Rheological properties of mixtures of k‐carrageenan from Hypnea musciformis and galactomannan from Cassia javanica. International Journal of Biological Macromolecules 27: 349–353.
- 23 Lai, L.‐S. and Liao, C.‐L. (2001). Steady and dynamic shear rheological properties of starch and decolorized Hsian‐tsao leaf gum composite systems. Cereal Chemistry 79 (1): 58–63.
- 24 Azero, E.G. and Andrade, C.T. (2006). Characterisation of Prosopis juliflora seed gum and the effect of its addition to κ‐carrageenan systems. Journal of the Brazilian Chemical Society 17 (5): 844–850.
- 25 Pinheiro, A.C., Bourbon, A.I., Rocha, C. et al. (2011). Rheological characterization of κ‐carrageenan/galactomannan and xanthan/galactomannan gels: comparison of galactomannans from non‐traditional sources with conventional galactomannans. Carbohydrate Polymers 83: 392–399.
- 26 Feng, T., Su, Q., Zhuang, H. et al. (2014). Ghost structures, pasting, rheological and textural properties between Mesona blumes gum and various starches. Journal of Food Quality 37: 73–82.
- 27 Rivera‐Corona, J.L., Rodríguez‐González, F., Rendón‐Villalobos, R. et al. (2014). Thermal, structural and rheological properties of sorghum starch with cactus mucilage addition. LWT ‐ Food Science and Technology 59 (1): 806–812.
- 28 Friedrich, C.H.R. and Heymann, L. (1988). Extension of a model for crosslinking polymer at the gel point. Journal of Rheology 32 (3): 235–241.
- 29 Shon, S.O., Ji, B.C., Han, Y.A. et al. (2007). Viscoelastic sol–gel state of the chitosan and alginate solution mixture. Journal of Applied Polymer and Science 104: 1408–1414.
- 30 Rafe, A., Razavi, S.M.A., and Khan, S. (2012). Rheological and structural properties of β‐lactoglobulin and basil seed gum mixture: effect of heating rate. Food Research International 49: 32–38.
- 31 Razavi, S.M.A., Behrouzian, F., and Alghooneh, A. (2017). Temperature dependency of the interaction between sage seed gum and xanthan gum: an interpretation of dynamic and thixotropy rheology based on creep test. Journal of Texture Studies 48 (5): 470–484.
- 32 Behrouzian, F., Razavi, S.M.A., and Alghooneh, A. (2017). Evaluation of interactions of biopolymers using dynamic rheological measurements: effect of temperature and blend ratios. Journal of Applied Polymer Science 134 (5): 1–13.
- 33 Rafe, A., Razavi, S.M.A., and Farhoosh, R. (2013). Rheology and microstructure of basil seed gum and b‐lactoglobulin mixed gels. Food Hydrocolloids 30: 134–142.
- 34 Razavi, S.M.A., Alghooneh, A., and Behrouzian, F. (2017). Thermo‐rheology and thermodynamic analysis of binary biopolymer blend: a case study on sage seed gum‐xanthan gum blends. Food Hydrocolloids 77: 307–321.
- 35 Rhim, J.W., Nunes, R.V., Jones, V.A., and Swartzel, K.R. (1989). Determination of kinetic parameters using linearly increasing temperature. Journal of Food Science 54 (2): 446–450.
- 36 Walstra, P. (2003). Physical Chemistry of Foods. New York: Marcel Decker, Inc.
- 37 Van Gurp, M. and Palmen, J. (1998). Time‐temperature superposition for polymeric blends. Rheology Bulletin 67: 5–8.
- 38 Ferry, J.D. (1980). Viscoelastic Properties of Polymers. New York: Wi1ey.
- 39 Hagen, R. and Weiss, R.A. (1995). Assessment of time‐temperature superposition of linear viscoelastic behaviour of strongly interacting polymer blends: N‐methylated nylon‐2,10 and lightly sulfonated polystyrene ionomers. Polymer 36 (24): 4657–4664.
- 40 Da Silva, J.A.L., Gonçalves, M.P., and Rao, M.A. (1994). Influence of temperature on the dynamic and steady‐shear rheology of pectin dispersions. Carbohydrate Polymers 23 (2): 77–87.
- 41 Rafe, A. and Razavi, S.M.A. (2013). The effect of pH and calcium ion on rheological behaviour of β‐lactoglobulin‐basil seed gum mixed gels. International Journal of Food Science and Technology 48 (9): 1924–1931.
- 42 Manias, E. and Utracki, L.A. (2014). Thermodynamics of polymer blends. In: Polymer Blends Handbook, 2e (ed. L.A. Utracki), 171–289. the Netherlands: Kluwer Academic Publishers.
- 43 Lide, D.R. (2006). Handbook of Chemistry and Physics. Boca Raton, FL: Taylor and Francis.
- 44 Ozilgen, M., Durukan, A., and Ulgen, N. (1991). Enthalpy: entropy and frequency factor: activation energy compensation relations for microbial death in fruit juices. LWT‐Food Science and Technology 24: 378–381.
- 45 Phillips, P.A., Stephen, G.O., Stephen, A.M., and Churms, S.C. (2006). Gums and Mucilages. In: Food Polysaccharides and Their Applications, 2e (ed. A.M. Stephen, G.O. Phillips and P.A. Williams), 455–495. London: Taylor and Francis.
- 46 Chen, Y., Zou, H., Liang, M., and Liu, P. (2013). Study on the dynamic rheological behavior of four different bimodal polyethylenes. Journal of Macromolecule Science 52: 924–936.
- 47 Han, C.D. and Chuang, H.K. (1985). Criteria for the rheological compatibility of polymer blends. Journal of Applied Polymer and Science 30: 4431.