19
Purification and Fractionation of Novel Natural Hydrocolloids
Somayeh Razmkhah
GUM Group Knowledge Base Company, Technology Development Center, Ferdowsi University of Mashhad, POBox: 91775‐1163, Mashhad, Iran
19.1 Introduction
Gum extraction methods usually result in solutions containing a mixture of components, which have to be further purified to isolate the specific polysaccharide of interest. The purification of polysaccharides removes unacceptable flavors of the crude gums, and the purified gums give clearer and more stable solutions due to the elimination of impurities and endogenous enzymes. Also, the presence of protein in polysaccharides can induce an inflammatory response in tissues, and this response may inhibit the pharmacological use of materials based on polysaccharides. Various procedures based on solubility differences or selective precipitations have been used to separate different polysaccharides, such as precipitation with ethanol, isopropanol, methanol, copper or barium complexes, and so on [1–4]. Many studies have been conducted to investigate purification of hydrocolloids by different methods, and the results indicated that the purified gums had different physicochemical, functional, and rheological properties.
Fractionation of polymers is a technique for investigating the distribution of structural parameters and determining their influence on physicochemical, functional, and rheological properties. In fractionation, the major polymer is subdivided into fractions with different molecular weights and structures [5]. Many researchers studied fractionation of hydrocolloids with different methods such as controlled acid hydrolysis, ion exchange chromatography, non‐solvent fractionation, different solvent extraction, and stepwise extraction with water, and the results showed that the fractions had different functionalities and applications.
Therefore, with respect to the significant effect of purification and fractionation methods on the physicochemical, functional, and rheological properties of the gums and increase in demand for natural hydrocolloids with low cost and proper functionality, these properties of the fractions and the effect of purification methods on characteristics of some new gums such as durian seed gum, chia seed gum, basil seed gum (BSG), and cress seed gum (CSG) are here reviewed.
19.2 Purification of New Natural Hydrocolloids
19.2.1 Chemical Composition
Partial purification of crude basil seed (Ocimum basilicum L.) gum by alcoholic precipitation had a significant effect on the quantity and quality of the extracted gum. The purified BSG had lower yield (12.34%), moisture (5.79%), lipid (9.71%), ash (3.32%), and protein (1.56%) content than the crude gum (15.42%, 7.39%, 11.55%, 5.89%, and 2.01%, respectively) [6].
Osano et al. also reported that the protein content of BSG (1.1%) decreased after purification with ethanol (0.83%), and protein impurities were substantially removed by further purification of BSG using phenol solvent treatment (0.60%). Total carbohydrate content increased from crude BSG (80%) to purified BSG (83%) to protein‐depleted BSG (84%) [7].
Four different purification methods using different chemicals and solvents (A (isopropanol and ethanol), B (isopropanol and acetone), C (saturated barium hydroxide), and D (Fehling solution)) reduced protein content, thus enhancing the purity of crude durian (Durio zibethinus) seed gum. The purification yield was significantly influenced by the purification process; Methods B and A gave the highest (72.4%) and lowest (31.0%) purification yield, respectively, which could be explained by the greater effectiveness of acetone rather than ethanol (isopropanol was utilized in both purification methods). All purification processes significantly decreased the protein content (2.65%–4.10%) as compared to the crude gum (5.8%); purification using saturated barium hydroxide and Fehling solution led to the highest and the lowest protein content, respectively. None of the purification techniques completely eliminated the protein fraction present in the chemical structure of the biopolymer from durian seed, from which it could be hypothesized that the protein fraction might be a part of the molecular structure of the durian seed biopolymer [8].
The same results were observed for chia seed gum: the lower yield, protein, fiber, and ash content of the purified gum compared to those reported for the crude chia seed gum were related to removal of the majority of non‐carbohydrate components during the purification [9].
The chemical composition of crude CSG varied significantly after purification with three different precipitation methods (ethanol [sample E], isopropanol [sample I], and ethanol–isopropanol [sample EI]). All the purification methods reduced the yield (from 8.97% to 3.5%–5.57%), ash (from 15.07% to 7.35%–8.93%), and protein content (from 11.29% to 0.91%–1.28%) due to the elimination of impurities, enzymes, and proteins. Samples I and EI exhibited the highest and the lowest yield and moisture content among the purified gums, respectively. Samples EI and CSG indicated the highest and the lowest amount of arabinose, mannose, and xylose, respectively, and samples I and CSG showed the highest amount of uronic acid. FTIR results confirmed the difference between structural features of the samples and were in agreement with the results for monosaccharide composition. The spectra indicated that the intermolecular interactions (mainly hydrogen bonds) became stronger along the series EI, E, and I [10].
The rheological and functional properties of gums depend on their chemical composition and are key factors for finding the applications areas and acceptability of a hydrocolloid [11,12].
19.2.2 Molecular Weight (Mw)
Three different purification methods (ethanol [sample E], isopropanol [sample I], and ethanol–isopropanol [sample EI]) reduced the molecular weight of crude CSG (1090 kDa). M w decreased significantly along the series of E (928 kDa), EI (664 kDa), and I (495 kDa) due to degradation of the polysaccharide chain in the presence of isopropanol [10]. The molecular weight of a polymer has a significant effect on the functional properties of the polysaccharide. Therefore, in view of the different M w values of the samples, different properties and applications could be expected for them.
19.2.3 Intrinsic Viscosity
Viscosity measurements in the dilute solution regime provide information on how molecules behave in solution and how the structure and property of biopolymers are related. The intrinsic viscosity of a biopolymer is influenced directly by the molecular weight and conformation of the macromolecule [13,14].
The intrinsic viscosity (determined by the Huggins and Kraemer equations) and chain flexibility (Huggins constant) of CSG were enhanced after purification with different methods. As demonstrated in Table 19.1, all the crude and purified gums revealed random coil conformation (b value, the slope of the double logarithmic plot of ηsp against concentration, =1.133–1.252) in dilute regimes, which indicates that no change occurred in the molecular conformation of CSG after purification. The intrinsic viscosity of the purified samples increased along the series of I (purified by isopropanol), EI (purified by ethanol–isopropanol), and E (purified by ethanol) due to an increase in the molecular weight along the same series. A lower intrinsic viscosity along with the higher molecular weight of crude CSG was related to its more compact conformation in comparison with the purified gums [15].
Table 19.1 Intrinsic viscosity parameters of crude and purified cress seed gums in deionized water at 25 °C (p = 0.05).
Source: Adapted from Razmkhah et al. [15] with permission from Elsevier.
| Parameter | CSG | E | EI | I |
| [η] dl gr−1 | 0.726 ± 0.018 d | 1.659 ± 0.004 a | 1.621 ± 0.000 b | 1.592 ± 0.003 c |
| KH | 1.373 ± 0.164 a | 0.947 ± 0.012 b | 0.927 ± 0.021 b | 0.998 ± 0.051 b |
| C[η] | 0.154–0.369 | 0.414–0.832 | 0.304–0.610 | 0.397–0.797 |
| B | 1.252 ± 0.019 a | 1.165 ± 0.001 c | 1.133 ± 0.002 d | 1.184 ± 0.010 b |
CSG, crude cress seed gum; E, CSG purified by ethanol; I, CSG purified by isopropanol; EI, CSG purified by ethanol–isopropanol.
Different letters indicate significant differences between samples at P < 0.05 determined by LSD test.
19.2.4 Dynamic Shear Rheological Properties
The rheological behavior of hydrocolloids is important due to its multiple industrial applications: adjusting processing parameters, monitoring consistency as well as predicting the stability of fluid systems, and determining the final textural attributes of formulated products.
The results of the stress sweep test (at constant frequency) indicated that the elastic modulus (G′) of crude and purified durian seed gums were higher than the viscous modulus (G″), indicating elastic behavior, and all purification methods (A [isopropanol and ethanol], B [isopropanol and acetone], C [saturated barium hydroxide], and D [Fehling solution]) significantly influenced both the G′ and G″ of the crude gum, which could be explained by the significant effects of the purification processes on the chemical composition (protein content and monosaccharide composition) of crude durian seed gum. All the purification techniques (except for method D) significantly increased elastic and viscous moduli, and purification using saturated barium hydroxide produced the highest values for G′ and G″ [16].
Dynamic rheological measurement results for crude and purified CSGs indicated weak gel‐like behavior (G′ > G″, tan δ < 1). As shown in Table 19.2, strain sweep parameters revealed that the crude CSG had a longer linear viscoelastic region (higher critical strain, γL), implying higher stability under the applied strain amplitude. The magnitude of Gf (G′ = G″), G′LVE, τy (yield stress), and τf (flow point stress) increased, while tan δ decreased after purification with different methods (ethanol [sample E], isopropanol [sample I], and ethanol–isopropanol [sample EI]), showing that the gel network became stronger, and the gel strength (Gf, G′LVE, τy and τf) increased significantly along the series I, EI, and E. The results of the frequency sweep tests showed that the crude and purified gums exhibited non‐Newtonian shear‐thinning behavior as the complex viscosity (η*) decreased linearly with increase in frequency on a double logarithmic scale. The slope of log η* versus log ω increased after purification, implying the presence of more elastic gels after purification (Table 19.2). Crude CSG had the lowest G′ and G″ with the highest frequency sensitivity (described by the power‐law equation), indicating the weak ability of its molecular chain to form a network. The storage modulus and complex viscosity (η*) increased significantly along the series CSG, I, EI, and E, whereas tan δ decreased significantly, reflecting a stronger and more elastic network structure. The results suggested that all the purification methods significantly affected the molecular structure of CSG in a way that enhanced its rheological properties; with elimination of impurities, especially the protein component, the polysaccharide chains approached each other freely and more intermolecular interactions formed, which resulted in stronger and more ordered networks. Therefore, with the elimination of protein to lower levels from I to EI to E, the gel network strength and elasticity increased. Also, the lowest gel strength of sample I among the purified gums was related to degradation of the polysaccharide chain in the presence of isopropanol and its lowest molecular weight. In addition, with increasing molecular weight along the series I, EI, and E, much more junction zones were available for intermolecular interactions, and more cross‐linking networks of higher elasticity were formed, which could sustain high mechanical deformation [15].
Table 19.2 Strain sweep parameters (structural strength G′LVE, limiting value of strain γL, and loss‐tangent value tan δ LVE in the linear viscoelastic (LVE) range, yield stress at the limit of the LVE range, τy, and flow point stress with the corresponding modulus Gf: G′ = G″ at frequency of 1 s−1) and frequency sweep parameters (storage modulus (G′), loss modulus (G″) and complex viscosity (η*) at f = 1 Hz, γ = 1%) for 1% dispersions of crude and purified cress seed gums at 25 °C (p = 0.05).
Source: Adapted from Razmkhah et al. [15] with permission from Elsevier.
| Parameter | CSG | E | EI | I |
| Strain sweep | ||||
| G′LVE (Pa) | 2.38 ± 0.05 d | 18.10 ± 0.09 a | 15.31 ± 0.49 b | 8.02 ± 0.15 c |
| γL (%) | 13.20 ± 0.65 a | 11.01 ± 0.89 bc | 9.46 ± 1.02 c | 12.49 ± 1.16 ab |
| τy (Pa) | 0.261 ± 0.021 d | 1.910 ± 0.132 a | 0.764 ± 0.051 b | 0.411 ± 0.032 c |
| τf (Pa) | 1.447 ± 0.002 d | 10.051 ± 0.003 a | 8.364 ± 0.020 b | 4.412 ± 0.004 c |
| tan δ LVE | 0.580 ± 0.003 a | 0.349 ± 0.009 c | 0.339 ± 0.008 c | 0.421 ± 0.005 b |
| Gf (Pa) | 1.20 ± 0.03 d | 5.29 ± 0.03 a | 5.02 ± 0.14 b | 2.93 ± 0.04 c |
| Frequency sweep | ||||
| G′ (Pa) | 2.495 ± 0.030 d | 18.380 ± 0.102 a | 13.697 ± 0.093 b | 7.552 ± 0.060 c |
| G″ (Pa) | 1.419 ± 0.011 d | 6.019 ± 0.005 a | 5.613 ± 0.110 b | 3.472 ± 0.042 c |
| η* (Pa s) | 0.457 ± 0.005 d | 3.078 ± 0.015 a | 2.356 ± 0.020 b | 1.323 ± 0.011 c |
| tan (δ) | 0.569 ± 0.002 a | 0.328 ± 0.002 d | 0.410 ± 0.005 c | 0.460 ± 0.002 b |
| Slope of η* | −0.638 ± 0.032 c | −0.824 ± 0.003 a | −0.850 ± 0.002 a | −0.784 ± 0.006 b |
CSG, crude cress seed gum; E, CSG purified by ethanol; I, CSG purified by isopropanol; EI, CSG purified by ethanol‐isopropanol.
Different letters indicate significant differences between samples at P < 0.05 determined by LSD test.
19.2.5 Steady Shear Rheological Properties
The apparent viscosity (98.9 s−1, 25 °C) of BSG (0.8%) increased from 429 to 605.6 mPa s after purification with three volumes of ethyl alcohol [6]. Purified durian seed gums (A [isopropanol and ethanol], B [isopropanol and acetone], C [saturated barium hydroxide], and D [Fehling solution]) showed different apparent viscosities in the range 14.2–21.5 (mPa s) compared to the crude gum (16.3 mPa s). The chemical composition (monosaccharide composition and protein content), molecular weight, length of backbone, glycosidic linkage, electric charge, branching degree, and side chains significantly influence the rheological properties of gums. The purified gums (A and D) showed the highest and least viscosity, respectively, due to the different molecular weights: purified gum A indicated the largest particle size and wide size distribution, while purified gum D had the small particle size with the narrowest size distribution among the purified gums. In addition, the high viscosity of purified gum A could be related to the presence of the lowest protein content. The low viscosity of purified gum D could also be due to the presence of Cu (II) in the complex formation induced by Fehling solution. Purification methods B and C did not significantly influence the viscosity of the crude gum. All the crude and purified gums exhibited pseudoplastic (or shear thinning) flow behavior [16].
The apparent viscosity of CSG increased after purification with different precipitation methods, because purification processes reduced the content of main impurities (such as trace elements, tannin, natural pigments, and protein) present in the chemical structure of the crude CSG and improved the solubility of the gum. The apparent viscosity of the purified gums followed the order E (purified by ethanol) > EI (purified by ethanol–isopropanol) > I (purified by isopropanol) due to the degradation effect of isopropanol on the polysaccharide chain, decrease in molecular weight, and increase in protein content from E to EI to I. CSG and all the purified gum dispersions indicated shear‐thinning behavior, and the Herschel–Bulkley (Eq. (19.1)) and Moore (Eq. (19.2)) models showed high coefficients of determination for all the samples, indicating steady shear flow behavior:
As shown in Table 19.3, all the purification methods increased the pseudoplasticity (nH), thickening (kH), and stabilizing (τ0H) properties of CSG. The yield stress (τ0H) decreased significantly along the series E, EI, and I, which was related to degradation effect of isopropanol on the polysaccharide chain and weakening of the interactions of polymer chains with decreasing molecular weight. The zero‐shear viscosity (the limit viscosity at low shear rate, η0), infinite‐shear viscosity (the limit viscosity at high shear rate, η∞), and relaxation time (typical time for a macromolecule to return to equilibrium, τ) of the CSG increased significantly after purification due to removal of impurities and increase in the entanglement density of the polymer chains (Table 19.3). The values of τ and η0 increased from I to EI to E, which was related to a decrease in protein content and increase in molecular weight along the same series.
Table 19.3 Steady shear rheological parameters of crude and purified cress seed gums (p = 0.05).
Source: Adapted from Razmkhah et al. [15] with permission from Elsevier.
| Model | CSG | E | EI | I |
| Herschel–Bulkley | ||||
| τ0H (Pa) | 0.174 ± 0.003 d | 4.368 ± 0.250 a | 3.429 ± 0.228 b | 1.760 ± 0.160 c |
| kH (Pa sn) | 0.402 ± 0.020 d | 1.581 ± 0.031 b | 1.945 ± 0.167 a | 1.044 ± 0.116 c |
| nH | 0.533 ± 0.020 a | 0.477 ± 0.010 b | 0.456 ± 0.014 b | 0.479 ± 0.019 b |
| R2 | 0.976 | 0.993 | 0.990 | 0.985 |
| Moore | ||||
| η0 (Pa s) | 3.174 ± 0.310 d | 59.095 ± 2.095 a | 37.663 ± 1.653 b | 15.714 ± 2.679 c |
| η∞ (Pa s) | 0.017 ± 0.000 d | 0.050 ± 0.001 b | 0.054 ± 0.001 a | 0.035 ± 0.000 c |
| τ (s) | 1.024 ± 0.080 c | 5.853 ± 0.303 a | 3.163 ± 0.635 b | 2.740 ± 0.509 b |
| R2 | 0.999 | 0.959 | 0.947 | 0.949 |
CSG, crude cress seed gum; E, CSG purified by ethanol; I, CSG purified by isopropanol; EI, CSG purified by ethanol–isopropanol.
Different letters indicate significant differences between samples at P < 0.05 determined by LSD test.
With respect to the wide range of temperatures encountered during the processing and storage of food dispersions containing gums, the response of hydrocolloid viscosity to temperature is significant in the food industries. The apparent viscosity of the crude and purified CSGs decreased as the temperature increased from 2 to 40 °C, and an Arrhenius‐type model was applied to describe the effect of temperature. All the purification methods increased the thermal stability of CSG, because of elimination of impurities (especially protein) and formation of more stable and ordered polysaccharide structures. The purified gums exhibited different temperature sensitivity due to their different structural characteristics (i.e., monosaccharide composition, ash, carbon, protein contents, and molecular weight), and sample EI showed the lowest activation energy (less sensitive to the temperature). As shown in Figure 19.1, all the crude and purified CSGs exhibited thixotropic behavior. The crude gum exhibited the lowest hysteresis loop area and the highest structural recovery, indicating that CSG returned to its original structure more quickly after deformation than the purified samples because of its less structured system. Sample E had the lowest hysteresis loop area among the purified gums, which was consistent with its higher viscoelastic property. The degree of structure recovery (DSR) of the purified gums showed no significant difference [15].
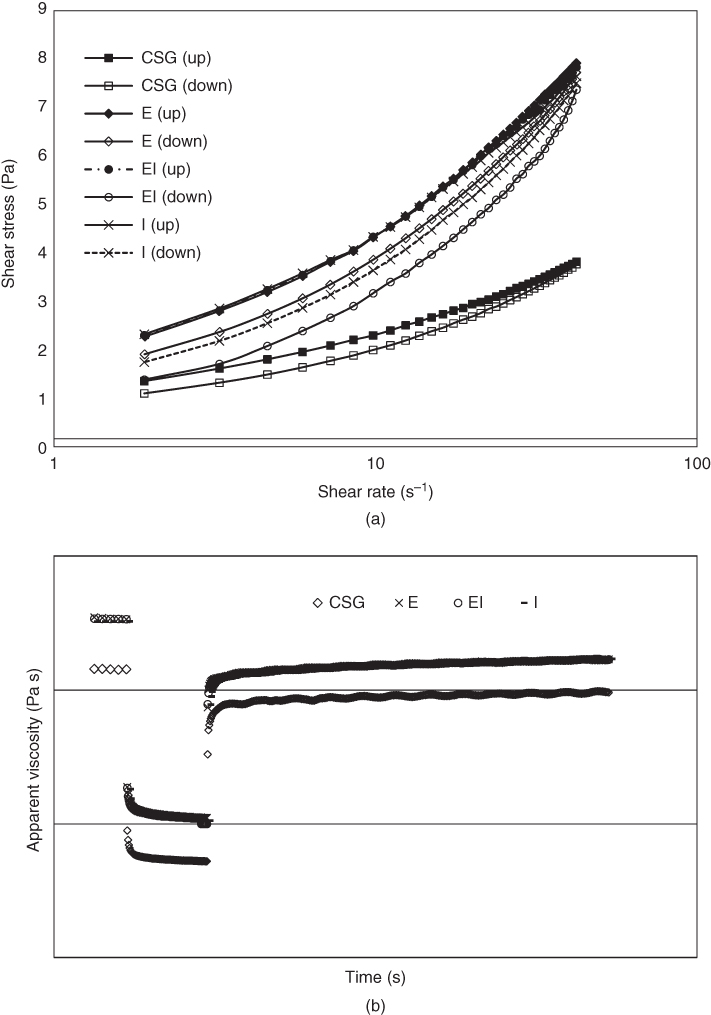
Figure 19.1 (a) Hysteresis loop of the flow curves for crude and purified cress seed gums, (b) Results of the in‐shear structural recovery tests for crude and purified cress seed gums (CSG, crude cress seed gum; E, CSG purified by ethanol; I, CSG purified by isopropanol; EI, CSG purified by ethanol‐isopropanol).
Source: Adapted from Razmkhah et al. [15] with permission from Elsevier.
19.2.6 Functional Characteristics
19.2.6.1 Solubility and Water‐Holding Capacity
Different purification techniques (A [isopropanol and ethanol], B [isopropanol and acetone], C [saturated barium hydroxide], and D [Fehling solution]) significantly improved the solubility of crude durian seed gum (21.4%), which varied from 23.1% to 46.8%. The changes in solubility were related to significant effects of the purification processes on the main chemical constituents (e.g., carbohydrate composition and protein fractions) and reduction in protein content, hydrophobic compounds (e.g., fat) and insoluble impurities (e.g., husk, cellulose, fiber, ash, natural pigments, and enzymes). The crude gum exhibited a relatively low solubility even at high temperature due to the presence of impurities, high galactose content, high molecular weight, or large molecules and insoluble matter. The efficiency of the purification process was dependent upon the purification method and composition of the utilized solvents and reagents: samples C and A showed the highest and the lowest degree of solubility among the purified gums, respectively. The low solubility of the purified gum A was attributed to the possible changes in the molecular structure of the gum induced by the extraction using hot water (80 °C) for 6 h, which caused the gum to be less soluble at ambient temperature, and the presence of a greater number of small molecules in sample C rather than in sample A. The solubility of the purified gums increased significantly with increasing temperature, because some molecules (i.e., high‐molecular‐weight molecules and galactomannan with low galactose content) were dissolved at high temperature, while they were not soluble at low temperature. Also, the hydrogen (H) bonds among the polysaccharide chains were broken at high temperature, and the OH groups were exposed to the water, which enhanced the solubility. In addition, the elevated temperature might alter the soluble mass of galactose in high‐molecular‐weight polysaccharides present in the aqueous solution [8].
The water‐holding capacity (WHC) of durian seed gum increased significantly after purification with four different methods due to the elimination of impurities. Furthermore, the purification processes caused the polysaccharides to unfold, increasing the proportion of ramification, which affected the water absorption capacity. Therefore, it was easier for water to interact with polysaccharide chains after the purification. Sample A had the lowest WHC among the purified gums due to higher content of impurities and strong interactions between polysaccharide molecules and impurities, which reduced the interaction intensity of the polysaccharide molecules with water molecules. The purified gum D exhibited the highest value of WHC, which was mainly attributed to the purification procedure and conditions. In addition, the purified gum D might have a finer uniform gum structure than sample A, thus increasing the water absorption capacity. A fine uniform structure with lots of small pores can result in a higher WHC and better water retention than a coarse structure with large pores [8].
19.2.6.2 Surface Tension
Crude, purified (ethanol‐treated), and protein‐depleted (phenol + ethanol treated) BSG demonstrated the capability to lower the surface tension of pure water, and the surface tension of all the samples decreased considerably when the gum concentration was increased. The capability of the gums to lower the surface tension of the air–water interface was slightly reduced by the treatment to remove protein content (47.8 mN/m for crude BSG, 51.3 mN/m for purified BSG, and 52.5 mN/m for protein‐depleted BSG, at 1% gum concentration). The surface tension of the crude gum as a function of time (at 0.5% gum concentration) showed that the surface tension systematically decreased for a period of time (0–20 min) and equilibrium set in after 30 min, whereas the surface tension values of the purified and protein‐depleted gums slightly increased over time until equilibrium was reached, indicating that purification of BSG probably altered its adsorption behavior by changing its hydrophobic character and thereby reduced its surface activity [17].
Three purification methods (ethanol, isopropanol, and ethanol–isopropanol) improved the surface activity of CSG (at 0.01% concentration), which could be due to the reduction in the molecular weight of the crude gum (CSG) after purification. The surface tension of all the gums decreased with increasing gum concentration to a certain point (0.01% for the purified samples, 0.1% for CSG), but increased as the gum concentration was further increased, owing to excessive viscosity development, which made surface tension measurements difficult. Therefore, higher viscosity and a stronger structural network of the purified gums compared to the crude gum increased the surface tension values at high concentrations. Sample I showed the lowest surface tension at all concentrations among the purified gums because of the highest protein and uronic acid contents and the lowest molecular weight; proteins and uronic acids might possess surface‐active properties [10]. Also, Koocheki et al. and Naji‐Tabasi et al. reported that polysaccharides with low molecular weight had a strong tendency to adsorb at air–water interfaces [ 5,18].
19.2.6.3 Emulsifying Properties
Crude durian seed gum exhibited higher oil‐holding capacity (OHC) than the purified gums, because of the presence of non‐polar side chains and hydrophobic fractions (i.e., fat and protein), which could bind the hydrocarbon units of oil. The purification processes (A [isopropanol and ethanol], B [isopropanol and acetone], C [saturated barium hydroxide], and D [Fehling solution]) reduced those hydrophobic impurities, thereby reducing the OHC. The purified samples C and D had the highest and the lowest OHC among the purified gums, respectively, which is relating to the effectiveness of the purification methods A, B, and D in reducing the hydrophobic (or oil‐soluble) fractions [8].
Crude, purified (ethanol treated), and protein‐free (phenol + ethanol treated) BSGs significantly lowered the interfacial tension at the oil–water interface. The interfacial tension of the samples decreased considerably with increasing gum concentration (0%–1%). The ability of BSG to lower the interfacial tension was reduced by the treatment to remove protein content, which was related to the significant role of a proteinaceous moiety in the gum and modification of the conformational structure of the polysaccharide during the purification processes. The emulsifying properties of BSG in terms of particle size distribution were altered upon removal of protein impurities. Protein‐depleted BSG produced the largest emulsion droplets, which is related to the modification of rheological properties of BSG, increasing the viscosity, which reduced the efficiency of the homogenization and manifested in the formation of larger emulsion droplets. Protein‐free BSG‐stabilized emulsions exhibited the highest complex viscosity and the strongest viscoelastic network. Also, the purification processes changed the functionality of BSG in terms of hydrophobicity and conformational structure, altering its adsorption properties and resulting in bigger emulsions droplets and/or a higher degree of droplet aggregation/coalescence. In addition, the reduction of the protein fraction was detrimental for the adsorption properties of the gum, resulting in bigger sizes due to bridging flocculation and/or coalescence. The dramatic increase in the droplet size of protein‐free BSG emulsions occurred during one‐month storage implies a strong coalescence process occurring over time, meaning that the polysaccharide was not strongly attached to the oil–water interface after being modified by the purification process, and therefore coalescence could not be prevented [ 7, 17].
All crude and purified CSGs had good (more than 92%) emulsifying capacity and stability (after heating at 80 ° C for 30 min). Three purification methods (ethanol precipitation, isopropanol precipitation, and ethanol–isopropanol precipitation) improved the emulsifying properties of CSG, and there was no significant difference among the purified gums. The crude gum had the highest protein content, but exhibited the lowest emulsifying properties, because the rheological properties of the continuous phase of the oil‐in‐water emulsions containing the purified gums modified in a way which could improve the emulsifying properties, and this modification had a stronger effect than the protein content [10]. As discussed earlier, the purified gums had higher viscosity and a stronger structural network than the crude gum [15].
19.2.6.4 Foaming Properties
Razmkhah et al. reported that crude CSG had higher molecular weight and protein content than the purified gums, but exhibited the lowest foaming capacity and foaming stability, which was assumed that CSG was not able to react with ovalbumin and form foam network because of its specific molecular structure [10]. Purification methods (ethanol [sample E], isopropanol [sample I], and ethanol–isopropanol [sample EI]) changed the structure of CSG, enabling the purified gums to react with ovalbumin. As discussed previously, the chemical composition and molecular weight of the crude and purified samples varied significantly, indicating that they had different molecular structures. Also, gums positively affect the foaming properties in food systems because of their high viscosity [19]. Therefore, the lower foaming properties of CSG could be related to its lower viscosity compared to the purified gums. Sample I exhibited the highest foaming capacity, and sample E showed the highest foaming stability, which is attributed to a stronger foam network related to its interactions with ovalbumin.
19.3 Fractionation of New Natural Hydrocolloids
19.3.1 Chemical Compositions
Cress seed (Lepidium sativum) gum fractions (fractionated using stepwise extraction with water: F1 [first extractant], F2 [second extractant], and F3 [third extractant]) had different ash and moisture content; which decreased significantly from F1 to F2 to F3, indicating that the gum generated from the outer parts of the cress seeds (F1) had the highest ash and moisture contents among the fractions. F3 was generated from the inner parts and consisted of components which had no opportunity to be drawn out from the seeds in the first and second steps, and exhibited the highest amount of carbon (C), hydrogen (H), nitrogen (N), and protein, and the percentages of carbon, hydrogen, and nitrogen increased along the series F1, F2, and F3. The amounts of fucose, rhamnose, galactose, and uronic acids decreased significantly from F1 to F2 to F3, whereas the amounts of arabinose and glucose increased along the same series. FTIR spectra revealed that the vibration peaks of OH shifted to the lower wavenumbers along the series F1, F2, and F3 (F1: 3442 cm−1, F2: 3434 cm−1, and F3: 3427 cm−1), indicating that the intermolecular interactions became stronger. Therefore, the stepwise extraction with water could produce different hydrocolloids with different chemical compositions in each step, indicating that they would be able to exhibit different rheological and functional properties [20].
There was no significant difference in moisture and ash content among BSG and its fractions (fractionated using gradual ethanol precipitation; precipitate [PER‐BSG] and supernatant [SUPER‐BSG]).However, protein content varied significantly among the samples (Super‐BSG [2.90%] > BSG [2.37%] > PER‐BSG [1.63%]). The uronic acid content increased along the series PER‐BSG, BSG, and SUPER‐BSG, which conferred more polyelectrolyte character on the gum. Also, the fractions exhibited different monosaccharide building units; PER‐BSG had higher amounts of glucose and galactose and lower content of xylose and rhamnose. Treatment of BSG with protease enzyme (PF‐BSG) reduced protein contaminates to about 0.34% with higher moisture content. Total sugar and uronic acid content of BSG did not change after protein hydrolysis. FTIR spectra confirmed the varying structural features of the BSG fractions, which was in agreement with the monosaccharide composition results [5].
19.3.2 Molecular Weight
CSG fractions showed different molecular weights, following the order F3 (1080 kDa) >F2 (895 kDa) > F1 (863 kDa). It could be concluded that the components with high molecular weight were flushed out from the seeds in the third step, and thus could not be extracted in the first and second steps [20].
Also, different molecular weights were observed for the BSG fractions (gradual ethanol precipitation; precipitate [PER‐BSG] and supernatant [SUPER‐BSG]). PER‐BSG and SUPER‐BSG exhibited the highest (5980 kDa) and the lowest molecular weight (1045 kDa), respectively. The molecular weight of BSG (2320 kDa) was between the fractions as BSG was composed of both fractions [5].
As shown in Table 19.5, controlled depolymerization of chia seed polysaccharide (CSP) yielded various molecular fractions; increased exposure to acid hydrolysis (degradation time: 0–8 h) produced lower‐molecular‐weight fractions [21].
19.3.3 Intrinsic Viscosity
BSG and its fractions (PER‐BSG and SUPER‐BSG) exhibited random coil conformation (b value, the slope of the double logarithmic plot of ηsp against concentration, =1.15–1.22) in dilute regimes (Table 19.4). The Huggins constant (KH) value implied that SUPER‐BSG had the highest chain flexibility, and BSG flexibility was between PER‐BSG and SUPER‐BSG. BSG and PER‐BSG exhibited the highest and the lowest intrinsic viscosity (determined by the Huggins and Kraemer equations), respectively. The lower intrinsic viscosity with higher‐molecular‐weight properties of PER‐BSG was attributed to its more compact conformation (the highest KH) [5].
Table 19.4 Dilute solution parameters of cress seed gum, basil seed gum, and their fractions (p = 0.05).
Source: Adapted from Naji‐Tabasi et al. [5] and Razmkhah et al. [22] with permission from Elsevier.
| Sample | [η] (dl gr−1) | KH | KH + KK | C[η] | b |
| BSG | 39.17 ± 0.23 A | 0.188 ± 0.008 B | 0.455 ± 0.04 A | 0.22–0.91 | 1.19 ± 0.012 A |
| PER‐BSG | 28.73 ± 0.97 C | 0.357 ± 0.017 A | 0.483 ± 0.04 A | 0.25–0.89 | 1.22 ± 0.023 A |
| SUPER‐BSG | 32.49 ± 1.24 B | 0.105 ± 0.06 C | 0.417 ± 0.05 B | 0.24–0.98 | 1.15 ± 0.023 A |
| PF‐BSG | 38.18 ± 0.85 A | 0.201 ± 0.003 B | 0.462 ± 0.04 A | 0.23–0.87 | 1.14 ± 0.046A |
| CSG | 1.659 ± 0.004 b | 0.947 ± 0.012 d | — | 0.414–0.832 | 1.165 ± 0.001 c |
| F1 | 1.545 ± 0.013 c | 1.249 ± 0.007 a | — | 0.383–0.974 | 1.263 ± 0.021 a |
| F2 | 1.650 ± 0.005 b | 1.085 ± 0.011 b | — | 0.308–0.828 | 1.173 ± 0.001 bc |
| F3 | 1.715 ± 0.009 a | 0.996 ± 0.019 c | — | 0.533–0.967 | 1.190 ± 0.005 b |
CSG, whole cress seed gum; F1, first extractant; F2, second extractant and F3, third extractant; BSG, basil seed gum; PER‐BSG, high‐molecular‐weight fraction; SUPER‐BSG, low‐molecular‐weight fraction; PF‐BSG, protein‐free basil seed gum.
Different letters indicate significant differences between cress seed gum and basil seed gum samples by LSD and Duncan tests, respectively.
The b value of CSG and its fractions (F1, F2, and F3) were in the range 1.165–1.263 (Table 19.4), which revealed their random coil conformation. The intrinsic viscosity (determined by the Huggins and Kraemer equations) of the fractions increased significantly from F1 to F2 to F3 due to an increase in the molecular weight of the fractions along the same series. The value of the Huggins constant followed the order F1 > F2 > F3, indicating that the gum generated from the inner parts of the cress seeds had higher chain flexibility, which was another reason for the increasing intrinsic viscosity along the series F1, F2, and F3 [22].
Controlled acid hydrolysis of CSP yielded various fractions with different intrinsic viscosities (determined using the Huggins and Kraemer equations), which decreased with increasing degradation time (0–8 h) due to the reduction in the molecular weight (Table 19.5). The same trend was observed for the Huggins' coefficient (KH). The lower values of KH in depolymerized CSP indicated that the aqueous solubility improved after the hydrolysis. Also, the higher value of KH for the unhydrolyzed CSP was related to additional polymer–polymer interactions in the aqueous solution due to the formation of intermolecular hydrogen bonds through the unsubstituted regions of the backbone [21].
Table 19.5 Relationship of molecular weight and intrinsic viscosity values of native and depolymerized chia seed polysaccharide.
Source: Adapted from Timilsena et al. [21] with permission from Elsevier.
| Degradation time (h) | Number‐average molecular weight (Mn) | Weight‐average molecular weight (Mw) | Intrinsic viscosity Huggins extrapolation (dl g−1) | Huggins coefficient (kH) |
| 0 | 1.07 × 10⁶ | 2.34 × 10⁶ | 16.63 | 0.736 |
| 2 | 2.71 × 10⁵ | 9.84 × 10⁵ | 10.88 | 0.483 |
| 4 | 1.99 × 10⁵ | 6.78 × 10⁵ | 7.71 | 0.436 |
| 8 | 7.82 × 10⁴ | 2.67 × 10⁵ | 3.16 | 0.371 |
19.3.4 Dynamic Shear Rheological Properties
Results of the strain sweep indicated that CSG and its fractions (F1, F2, and F3) exhibited a gel‐like structure (weak gel); the samples showed solid‐like behavior (G′ > G″) in the linear viscoelastic (LVE) region, but after the crossover point (flow point), G″ was higher than G′, and the gums showed more liquid‐like behavior. As shown in Table 19.6, the critical strain (γL) was high for F1 (13.55%), indicating a longer LVE range and higher stability under the strain amplitude, whereas there was no significant difference among the other samples. Tan δ values of CSG and its fractions were lower than 1, but higher than 0.1, implying that all the samples formed gels; however, they were not real gels and were considered “weak gels.” The structural strength (G′LVE) of F3 and whole gum was higher than that of the other fractions, reflecting greater intermolecular interactions and entanglements. The magnitude of Gf (G′ = G″, indicator of structural strength at flow point), G′LVE, τy (yield stress), and τf (stress at flow point) increased along the series F1, F2, and F3, and tan δ decreased along the same series, indicating that the gum generated from the inner parts of the cress seeds had a stronger gel network. CSG fractions had a different chemical composition, and increasing the molecular weight of the fractions from F1 to F2 to F3 could result in more elastic behavior.
Table 19.6 Strain sweep parameters (elastic modulus at critical strain G′LVE, critical strain γL, and loss‐tangent value (tan δ LVE) in the linear viscoelastic (LVE) range, yield stress at the limit of the LVE range, τy, and flow point stress with corresponding modulus Gf: G′ = G″ at frequency of 1 s−1) and frequency sweep parameters (storage modulus (G′), loss modulus (G″) and complex viscosity (η*) at f = 1 Hz, γ=1%) for 1% dispersions of cress seed gum and its fractions at 25 °C (p = 0.05).
Source: Adapted from Razmkhah et al. [22] with permission from Elsevier.
| Parameters | CSG | F1 | F2 | F3 |
| Strain sweep | ||||
| G′LVE (Pa) | 18.10 ± 0.09 a | 5.55 ± 0.02 c | 15.10 ± 0.40 b | 17.81 ± 0.45 a |
| γL (%) | 11.01 ± 0.89 b | 13.55 ± 0.55 a | 9.53 ± 1.58 b | 9.45 ± 0.85 b |
| tan δ LVE | 0.349 ± 0.009 c | 0.552 ± 0.001 a | 0.372 ± 0.009 b | 0.362 ± 0.008 bc |
| τy (Pa) | 1.910 ± 0.132 a | 0.827 ± 0.031 c | 1.405 ± 0.189 b | 1.635 ± 0.110 b |
| τf (Pa) | 10.051 ± 0.003 b | 3.695 ± 0.005 d | 9.812 ± 0.013 c | 10.800 ± 0.040 a |
| Gf (Pa) | 5.29 ± 0.03 b | 2.61 ± 0.02 c | 5.22 ± 0.12 b | 5.72 ± 0.15 a |
| Frequency sweep | ||||
| G′ (Pa) | 18.38 ± 0.10 a | 5.86 ± 0.02 d | 14.10 ± 0.37 c | 16.63 ± 0.46 b |
| G″ (Pa) | 6.02 ± 0.01 a | 3.14 ± 0.14 c | 5.56 ± 0.02 b | 6.08 ± 0.04 a |
| η* (Pa s) | 3.078 ± 0.015 a | 1.058 ± 0.013 d | 2.412 ± 0.058 c | 2.818 ± 0.073 b |
| tan (δ) | 0.328 ± 0.002 d | 0.536 ± 0.022 a | 0.395 ± 0.013 b | 0.366 ± 0.013 c |
| Slope of η* | −0.824 ± 0.003 c | −0.801 ± 0.001 d | −0.846 ± 0.005 b | −0.861 ± 0.006 a |
CSG, whole cress seed gum; F1, first extractant; F2, second extractant, and F3, third extractant.
Different letters indicate significant differences between samples at P < 0.05 determined by LSD test.
The results of frequency sweep tests confirmed the typical weak gel‐like behavior of CSG and its fractions (G′ > G″, tan δ < 1). All the samples exhibited non‐Newtonian shear‐thinning behavior as the complex dynamic viscosity (η*) decreased linearly with increase in frequency on a double logarithmic scale. G′, η*, and slope of log η* versus log ω increased along the series F1, F2, and F3, whereas tan δ and the frequency sensitivity of G′ and G″ (described by the power‐law equation) decreased significantly (Table 19.6), reflecting a stronger and more elastic network structure. With increasing molecular weight from F1 to F2 to F3, much more junction zones were available for intermolecular interactions, and more cross‐linking networks of higher elasticity were formed which could sustain high mechanical deformation [22].
The results of the stress sweep revealed that the storage modulus (G′LVE) of BSG and its fractions ((PER‐BSG and SUPER‐BSG), and treatment of BSG with protease enzyme (PF‐BSG)) was higher than the loss modulus (G″LVE) in the LVE region and before the crossover point, indicating solid‐like (or gel‐like) behavior. All the samples were not true gels (0.1 < tan δ < 1), and chain entanglements and macromolecule connections were temporary, as they were disrupted by applying high shear rates. As shown in Table 19.7, PER‐BSG exhibited the highest value of G′LVE, reflecting that this fraction promoted greater intermolecular interactions and entanglements due to its high molecular weight; therefore PER‐BSG played the main role in the elastic behavior of BSG. PER‐BSG exhibited the lowest value of tan δ (0.2), indicating high elastic, whereas SUPER‐BSG had a much higher tan δ (0.83), indicating that viscous behavior was prominent, and this fraction was not able to form cross bonds and a coherent structure. SUPER‐BSG showed the lowest yield point (τy), flow point (τf), and cross point of elastic and viscous moduli (Gf). The stain sweep parameters of BSG and PF‐BSG were similar, and no significant alteration was observed by omitting protein moiety, because no significant alteration occurred in the molecular weight, total sugar, and uronic acid content of BSG after protein hydrolysis. Also, the results of frequency sweep tests confirmed the weak gel‐like behavior of BSG and its fractions (G′ > G″, tan δ < 1). The complex viscosity (η*) of BSG and the fractions decreased with increasing frequency, reflecting non‐Newtonian shear‐thinning behavior. As shown in Table 19.7, SUPER‐BSG exhibited the lowest G′, G″, and η* values, and the highest tan δ and frequency sensitivity of G′ and G″, which is attributed to the weak ability of its molecular chains to form a network. Treatment of BSG with protease enzyme increased the storage modulus, whereas there was no significant difference between BSG and PF‐BSG for the other frequency sweep parameters. The results confirmed the strong impact of the chain length of the fractions on the degree of cross‐linking; PER‐BSG had the highest molecular weight and exhibited a strong tendency to polymer entanglement formation, which enhanced elastic and solid behavior [ 5,23].
Table 19.7 Stress sweep parameters (storage modulus G′(LVE); loss modulus G″ (LVE); loss‐tangent value (Tan δ LVE) in the linear viscoelastic (LVE) range, yield stress at the limit of the LVE range (τy), and flow point stress (τf); corresponding modulus Gf: G′ = G″ at frequency of 1 s−1) and frequency sweep parameters (storage modulus (G′), loss modulus (G″) and complex viscosity (η*) at f = 1 Hz, τ = 0.1 Pa) for 1% dispersions of basil seed gum and its fractions at 20 °C (p = 0.05).
Source: Adapted from Naji‐Tabasi and Razavi [23] with permission from Elsevier.
| Parameters | BSG | PER‐BSG | SUPER‐BSG | PF‐BSG |
| Stress sweep | ||||
| G′(LVE) (Pa) | 227.00 ± 3.45 b | 266.50 ± 4.91 a | 11.98 ± 0.84 c | 206.50 ± 2.98 b |
| G″ (LVE) (Pa) | 55.20 ± 1.73 a | 52.47 ± 1.87 a | 9.93 ± 0.81 b | 51.67 ± 3.31 a |
| Tan δ LVE | 0.24 ± 0.03 b | 0.20 ± 0.01 b | 0.83 ± 0.03 a | 0.25 ± 0.00 b |
| τy (Pa) | 3.59 ± 0.11 a | 3.12 ± 0.56 a | 1.88 ± 0.17 b | 3.71 ± 0.82 a |
| τf (Pa) | 13.90 ± 0.10 a | 9.93 ± 0.02 b | 5.96 ± 0.42 c | 14.10 ± 0.28 a |
| Gf (Pa) | 54.49 ± 0.59 b | 82.30 ± 0.87 a | 8.94 ± 0.57 c | 62.93 ± 3.32 b |
| Frequency sweep | ||||
| G′ (Pa) | 211.19 ± 6.81 b | 225.98 ± 2.92 ab | 13.81 ± 1.12 c | 258.87 ± 8.43 a |
| G″ (Pa) | 61.45 ± 1.37 a | 48.53 ± 0.99 b | 10.61 ± 1.20 c | 69.37 ± 2.18 a |
| η* (Pa s) | 35.52 ± 1.08 a | 35.29 ± 4.09 a | 2.81 ± 0.01 b | 41.22 ± 5.99 a |
| Tan (δ) | 0.29 ± 0.02 b | 0.22 ± 0.01 b | 0.75 ± 0.01 a | 0.27 ± 0.04 b |
| Slope of η* | −0.90 ± 0.109 a | −0.91 ± 0.112 a | −0.67 ± 0.300 b | −0.91 ± 0.219 a |
BSG, basil seed gum; PER‐BSG, high‐molecular‐weight fraction; SUPER‐BSG, low‐molecular‐weight fraction; PF‐BSG, protein‐free basil seed gum.
Different letters indicate significant differences between samples at P < 0.05 determined by Duncan test.
19.3.5 Steady Shear Rheological Properties
The apparent viscosity of CSG and its fractions (F1, F2, and F3) decreased sharply with an increase in shear rate, indicating the high shear dependency (shear thinning) of the samples. The fractions showed different apparent viscosities, which could be due to their different chemical structure (i.e., monosaccharide composition and protein) and molecular weight; therefore, lower viscosity of F1 (first extractant) was related to its lower molecular weight, lower protein content, and the weakness of the intermolecular entanglements in F1 solution. The Herschel–Bulkley (Eq. ( 19.1)) and Moore (Eq. ( 19.2)) models exhibited high coefficients of determination for all the samples, indicating steady shear flow behavior. As shown in Table 19.8, the values of the flow behavior index (nH) were less than 1 (0.424–0.522), confirming the shear‐thinning (pseudoplastic) nature of CSG and its fractions. F1 had the highest nH and the lowest consistency coefficient (kH) and yield stress (τ0H), reflecting that the gum generated from the outer parts of the cress seeds showed overall lower pseudoplasticity, thickening, and stabilizing properties in comparison to others. No significant difference was observed between F2 (second extractant) and F3 (third extractant) for the values of kH and nH. Relaxation time (τ) and zero‐shear viscosity (η0) increased significantly along the series F1, F2, and F3, because the entanglement density of the polymer chains and number of linkages between the polymer molecules increased with increasing molecular weight along the same series. F1 exhibited the lowest infinite‐shear viscosity (η∞), and there was no significant difference between F2 and F3 [ 20, 22].
Table 19.8 Herschel–Bulkley and Moore models' parameters, hysteresis area (HA), and degree of structure recovery (DSR) of cress seed gum and its fractions (p = 0.05).
Source: Adapted from Razmkhah et al. [ 20, 22] with permission from Elsevier.
| Model | CSG | F1 | F2 | F3 |
| Herschel–Bulkley | ||||
| τ0H (Pa) | 4.368 ± 0.250 ab | 1.877 ± 0.042 c | 4.034 ± 0.431 b | 4.797 ± 0.311 a |
| kH (Pa sn) | 1.581 ± 0.031 b | 0.885 ± 0.021 c | 2.338 ± 0.133 a | 2.217 ± 0.042 a |
| nH | 0.477 ± 0.010 b | 0.522 ± 0.005 a | 0.424 ± 0.012 c | 0.430 ± 0.004 c |
| R2 | 0.993 | 0.985 | 0.986 | 0.993 |
| Moore | ||||
| η∞ (Pa s) | 0.049 ± 0.001 b | 0.038 ± 0.000 c | 0.052 ± 0.001 a | 0.050 ± 0.001 ab |
| η0 (Pa s) | 59.095 ± 2.095 b | 19.883 ± 1.080 d | 54.085 ± 2.085 c | 69.193 ± 2.003 a |
| τ (s) | 5.853 ± 0.303 a | 3.693 ± 0.089 c | 4.853 ± 0.202 b | 5.826 ± 0.411 a |
| R2 | 0.959 | 0.940 | 0.954 | 0.955 |
| Thixotropy | ||||
| HA (Pa s−1) | 21.94 ± 1.01 c | 20.97 ± 0.45 c | 50.11 ± 3.08 b | 74.52 ± 5.31 a |
| DSR | 0.383 ± 0.013 d | 0.471 ± 0.021 c | 0.531 ± 0.024 b | 0.570 ± 0.029 a |
CSG, whole cress seed gum; F1, first extractant; F2, second extractant and F3, third extractant.
Different letters indicate significant differences between samples at P < 0.05 determined by LSD test.
The apparent viscosity of CSG and its fractions decreased gradually with increasing temperature from 2 to 40 °C, and the temperature‐dependent behavior was well described by an Arrhenius‐type relationship for all the samples (R2 > 0.993). F2 and F1 showed the highest and the lowest activation energies, respectively; therefore, the microstructure of F2 was more sensitive to temperature, and the network structure formed by its molecules was affected as the temperature increased. The differing temperature sensitivities of the fractions were related to their different structural characteristics. CSG and its fractions exhibited time‐dependent behavior. As shown in Table 19.8, the DSR increased significantly from F1 to F2 to F3; the higher DSR of F2 and F3 was related to their more elastic networks, which could recover their original structures under low‐shear conditions (1 s−1) after decomposition under high‐shear conditions (100 s−1). The hysteresis loop area also increased significantly along the series F1, F2, and F3 due to an increase in shear‐thinning behavior. The shear rate and time are changed simultaneously in the loop test; therefore, an increase in shear‐thinning behavior resulted in a more significant decrease in the viscosity with increasing shear rate, and there was neither the opportunity nor enough time to rearrange the structured system [22].
The apparent viscosity of BSG and its fractions ((PER‐BSG and SUPER‐BSG), and BSG treated with protease enzyme (PF‐BSG)) decreased with increasing shear rate, reflecting their shear‐thinning behavior. As shown in Table 19.9, the Herschel–Bulkley (Eq. ( 19.1)), power‐law (Eq. (19.3)), and Sisko (Eq. (19.4)) models exhibited high R2 (>0.982) for all the samples, indicating steady shear flow behavior:
Table 19.9 Steady shear rheological parameters and the second‐order structural kinetics model parameters of BSG and its fractions' solutions (1% w/w) at 20 °C (p = 0.05).
Source: Adapted from Naji‐Tabasi and Razavi [23] with permission from Elsevier.
| Model | BSG | PER‐BSG | SUPER‐BSG | PF‐BSG |
| Power‐law | ||||
| kp (Pa sn) | 13.95 ± 0.92 a | 8.64 ± 0.28 b | 2.37 ± 0.27 c | 14.61 ± 1.01 a |
| np | 0.33 ± 0.00 b | 0.30 ± 0.05 b | 0.44 ± 0.01 a | 0.32 ± 0.02 b |
| R2 | 0.9972 | 0.9816 | 0.9975 | 0.9967 |
| RMSE | 1.319 | 1.993 | 0.415 | 1.509 |
| Herschel–Bulkley | ||||
| τ0H (Pa) | 3.39 ± 0.05 a | 3.60 ± 1.11 a | 0.80 ± 0.08 b | 3.85 ± 0.96 a |
| kH (Pa sn) | 10.77 ± 1.16 a | 5.69 ± 1.41 b | 1.83 ± 0.06 c | 11.02 ± 1.16 a |
| nH | 0.36 ± 0.01 b | 0.43 ± 0.05 a | 0.48 ± 0.01 a | 0.37 ± 0.05 b |
| R2 | 0.9994 | 0.9951 | 0.9995 | 0.9997 |
| RMSE | 0.346 | 0.959 | 0.175 | 0.370 |
| Sisko | ||||
| η∞ (Pa s) | 0.64 ± 0.33 b | 0.87 ± 0.13 a | 0.21 ± 0.04 d | 0.45 ± 0.28 c |
| Ks (Pa sn) | 12.76 ± 0.38 a | 7.22 ± 1.54 b | 3.10 ± 0.10 c | 13.90 ± 0.96 a |
| ns | 0.19 ± 0.01 a | 0.23 ± 0.06 a | 0.22 ± 0.01 a | 0.20 ± 0.04 a |
| R2 | 0.9997 | 0.9994 | 0.9987 | 0.9998 |
| RMSE | 0.649 | 0.423 | 0.604 | 0.750 |
| Second‐order structural kinetics | ||||
| η′0 (Pa s) | 1.94 ± 0.05 a | 1.02 ± 0.07 c | 0.49 ± 0.01 d | 1.65 ± 0.08 b |
| η′0/η′∞ | 2.12 ± 0.05 a | 1.95 ± 0.06 b | 1.98 ± 0.03 b | 1.81 ± 0.02 c |
| K | 0.41 ± 0.11 b | 0.48 ± 0.07 b | 0.83 ± 0.12 a | 0.38 ± 0.03 b |
| R2 | 0.982 | 0.979 | 0.983 | 0.981 |
| RMSE | 0.029 | 0.017 | 0.004 | 0.019 |
BSG, basil seed gum; PER‐BSG, high‐molecular‐weight fraction; SUPER‐BSG, low‐molecular‐weight fraction; PF‐BSG, protein‐free basil seed gum.
Different letters indicate significant differences between samples at P < 0.05 determined by Duncan test.
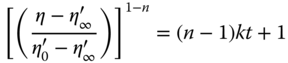
No significant difference was observed between BSG and PF‐BSG for the values of the power‐law and Herschel–Bulkley model parameters. The flow behavior index values also verified the shear‐thinning behavior of BSG and its fractions (np and nH < 1). PER‐BSG had stronger pseudoplastic behavior than SUPER‐BSG because of its higher molecular weight. SUPER‐BSG with the lowest molecular weight exhibited the lowest values for yield stress (τ0H), kp, and kH. The PER‐BSG solution with higher molecular weight exhibited lower consistency coefficients (kp and kH) compared to BSG, which was related to its more compact conformation. PER‐BSG showed the highest value of infinite‐shear viscosity (η∞, obtained with the Sisko model), and the ks (consistency coefficient) values followed the same trend of kp and kH magnitudes. The difference between the ns values of BSG and its fractions was not significant. Infinite‐shear viscosity decreased significantly after the protein content of BSG was decreased by protease enzyme treatment, whereas ks and ns did not change significantly. The viscosity of BSG and its fractions decreased with time, indicating their thixotropy (time‐dependent behavior). As shown in Table 19.9, the second‐order structural kinetic model (Eq. (19.5)) exhibited high coefficients of determination for all the samples, indicating thixotropic behavior:
BSG and SUPER‐BSG showed the highest and the lowest initial apparent viscosity (![]() ), respectively. The breakdown rate constant (k) value of SUPER‐BSG was higher than that for BSG and the other fractions, reflecting the weak linkage between SUPER‐BSG chains; however, the difference between PER‐BSG, PF‐BSG, and BSG was not significant. The ratio of the initial apparent viscosity to the equilibrium apparent viscosity (
), respectively. The breakdown rate constant (k) value of SUPER‐BSG was higher than that for BSG and the other fractions, reflecting the weak linkage between SUPER‐BSG chains; however, the difference between PER‐BSG, PF‐BSG, and BSG was not significant. The ratio of the initial apparent viscosity to the equilibrium apparent viscosity (![]() /
/![]() ) of BSG was slightly higher than that of its fractions, indicating that the presence of both fractions together resulted in extent of thixotropy and more structural modification [23].
) of BSG was slightly higher than that of its fractions, indicating that the presence of both fractions together resulted in extent of thixotropy and more structural modification [23].
19.3.6 Functional Characteristics
19.3.6.1 Surface Tension
The surface activity of BSG and its fractions (PER‐BSG and SUPER‐BSG) was investigated by Naji‐Tabasi et al. As shown in Figure 19.2, the surface tension values increased at higher concentrations of BSG due to gelation and high viscosity, which made the surface tension measurements difficult. PER‐BSG exhibited a similar trend as BSG and reduced the surface tension to approximately 67.65 (mN/m) at 0.1%, but its surface tension value increased considerably by when the gum concentration increased. The surface tension of SUPER‐BSG reduced significantly by when the gum concentration increased from 64 to 57 mN/m (0.1%–0.3%). SUPER‐BSG had the lowest molecular weight (a strong tendency to adsorb at the air–water interface), highest chain flexibility, and the highest content of uronic acid (13%) and protein; these parameters could explain its considerable surface activity. Protein‐free BSG (PF‐BSG) showed a lower surface activity compared to BSG, reflecting the fact that the protein moiety played a pivotal role in reducing surface tension [5].
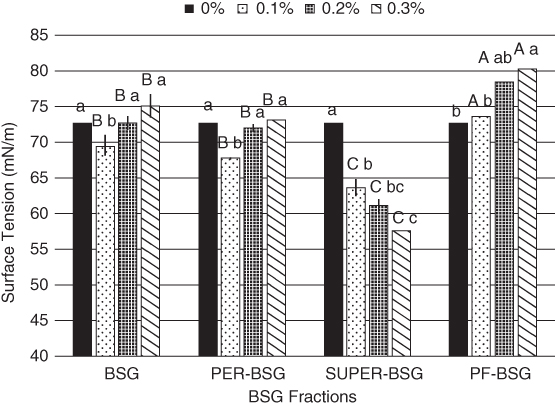
Figure 19.2 Surface activity of BSG and its fractions determined at different concentration. Different letters of each bar indicate significant differences between fractions (capital letter) and different gum concentrations (small letter) at p < 0.05.
Source: Adapted from Naji‐Tabasi et al. [5] with permission from Elsevier.
The surface tension of CSG and its fractions (F1, F2, and F3) decreased with increasing gum concentration to a certain point (0.01% for F3 and CSG, 0.1% for F1 and F2), but increased as the gum concentration was further increased because of the excessive viscosity development at higher concentrations, which hindered the surface tension measurements. The fractions exhibited varying surface activities due to their different molecular structure and protein content; surface tension values decreased from F1 to F2 to F3 at low concentrations (0.01% and 0.05%). The protein content increased significantly along the series F1, F2, and F3, and the protein content of F3 was about 3.7 and 2.2 times of those for F1 and F2, respectively. Therefore, protein played the important role in the surface activity of the fractions. In addition, the chain flexibility of the fractions followed the order F1 < F2 < F3, which was another reason for the increase in surface activity [ 20, 22].
19.3.6.2 Emulsifying Properties
The emulsifying properties of BSG and its fractions (PER‐BSG and SUPER‐BSG), as well as BSG treated with protease enzyme (PF‐BSG), were investigated by Naji‐Tabasi and Razavi [24]. SUPER‐BSG formed an emulsion with the lowest mean diameter and size distribution due to its highest protein content, surface activity, and flexibility. PF‐BSG showed a low tendency to absorb on interfacial surfaces of oil and water during homogenization, and larger droplets were formed because after treatment of BSG with a protease enzyme, the protein moieties were removed, and the surface activity decreased significantly. SUPER‐BSG (83.4%) and PF‐BSG (78.6%) indicated the highest and the lowest emulsion stability (centrifuge stability), respectively. Also, emulsion stability during five weeks of storage followed the order SUPER‐BSG > BSG > PER‐BSG > PF‐BSG; the lower oil droplet size of SUPER‐BSG and BSG emulsions increased stability, whereas big oil droplets and the large distribution size of the PF‐BSG emulsion led to rapid gravitational separation. In addition, SUPER‐BSG had a higher uronic acid content compared to the other fractions, which generated a sufficiently strong electrostatic repulsion between oil droplets, supporting its high emulsion stability. The PER‐BSG emulsion became unstable in the second week, which is related to its lower surface tension. The Herschel–Bulkley model (Eq. ( 19.1)) was applied to describe the steady shear flow behavior of the emulsions (R2 > 0.99); the flow behavior index (np) values were less than 1 (shear‐thinning behavior), but no significant difference was found between emulsions. The SUPER‐BSG emulsion showed the lowest value of kH, due because it had the lowest molecular weight. The consistency coefficient values of PER‐BSG and PF‐BSG were slightly lower than that of BSG; however, PER‐BSG had a higher molecular weight, and PF‐BSG's molecular weight was similar to that of BSG, which was related to the bigger droplet size of PER‐BSG and PF‐BSG. As the droplet size decreases, the width of the particle size distribution generally decreases and the thickness of the adsorbed surfactant layer increases, and the mean distance of separation between the droplets decreases, increasing the hydrodynamic interaction and viscosity [25]. Also, the greater tendency of fine droplets to flocculate can increase the viscosity [26]. The BSG emulsion exhibited the greatest yield stress, whereas SUPER‐BSG had the lowest value of τ0H. The PF‐BSG emulsion showed a lower yield stress value in comparison with BSG, which is related to its larger droplet size distribution. The results of stress sweep tests indicated elastic behavior for all the emulsions (G′ > G″, tan δ < 1). The SUPER‐BSG emulsion showed the lowest storage modulus (G′LVE), loss modulus (G″LVE), yield stress (τy), flow point stress (τf), and corresponding modulus (Gf) and the highest loss‐tangent value (tan δLVE), but there was no significant difference among the other samples for G′, tan δLVE, τy, and Gf. The results of frequency sweep measurements confirmed the solid‐like behavior of BSG and its fractions emulsions, and non‐Newtonian shear‐thinning behavior was observed as the complex viscosity (η*) decreased linearly with an increase in frequency. The SUPER‐BSG emulsion exhibited the lowest G′, G″, η*, and slope of log η*, and the highest tan δ values. BSG showed the highest G′, G″, and η*, which was related to the presence of both fractions together, and the contribution to the elastic storage modulus by PER‐BSG and to a low droplet size by SUPER‐BSG.
CSG and its fractions (F1, F2, and F3) exhibited excellent emulsifying capability (>97%) and stability (>96%). The emulsion capacity increased slightly from F1 to F2 to F3, because of the increasing molecular weight, protein content, and apparent viscosity along the same series. All the emulsions were stable after heating at 80 °C for 30 min, and a slight decrease in the emulsion stability was observed for all the samples; the percentage decrease in emulsion stability increased along the series F1, F2, and F3. The uronic acid content decreased from F1 to F2 to F3, whereas the protein content and viscosity increased, indicating that the uronic acid content had a stronger effect than the protein content and viscosity on the emulsion stability of the samples. Also, a general decrease in viscosity with increasing temperature and a possible negative effect of temperature (80 °C for 30 min) on protein structure could diminish or weaken the effect of these factors on the emulsion stability after heating [20].
19.3.6.3 Foaming Properties
Naji‐Tabasi and Razavi studied the effect of BSG and its fractions (PER‐BSG and SUPER‐BSG), and also PF‐BSG, at different concentrations on the foaming capacity and stability of albumin solution. As shown in Figure 19.3a, SUPER‐BSG improved foaming capability significantly at all concentrations, because it had the highest protein content, surface activity, and flexibility. PF‐BSG exhibited the weakest foaming capacity because of more hydrophilic and fewer hydrophobic bonds, which could not adsorb at the air–liquid interface. The foaming capacity of all the samples exhibited a decreasing trend when the concentration of gum increased, because the greatly increased viscosity of the aqueous phase did not allow air to enter the system. BSG and its fractions significantly improved the foam stability of albumin solution, and foaming stability increased with increasing gum concentration (Figure 19.3b). The highest foaming stability was observed for BSG at 0.3%, which is attributed to modification of the viscosity of the aqueous phase and the creation of a network, which prevented the air droplets from coalescing. As discussed earlier, the viscosity of the samples followed the order SUPER‐BSG < PER‐BSG < BSG. SUPER‐BSG had the lowest viscosity but demonstrated the strongest stability at 0.1% and 0.2% in comparison with BSG and PER‐BSG due to the existence of more hydrophobic chains, flexible structure, high surface activity, and low molecular weight. Therefore, at high viscosity, the foam stability was controlled by increasing the bulk‐phase viscosity, but at lower gum concentrations, surface tension groups played a major role in preventing drainage because the viscosity could not prevent bubble coalescence [24].
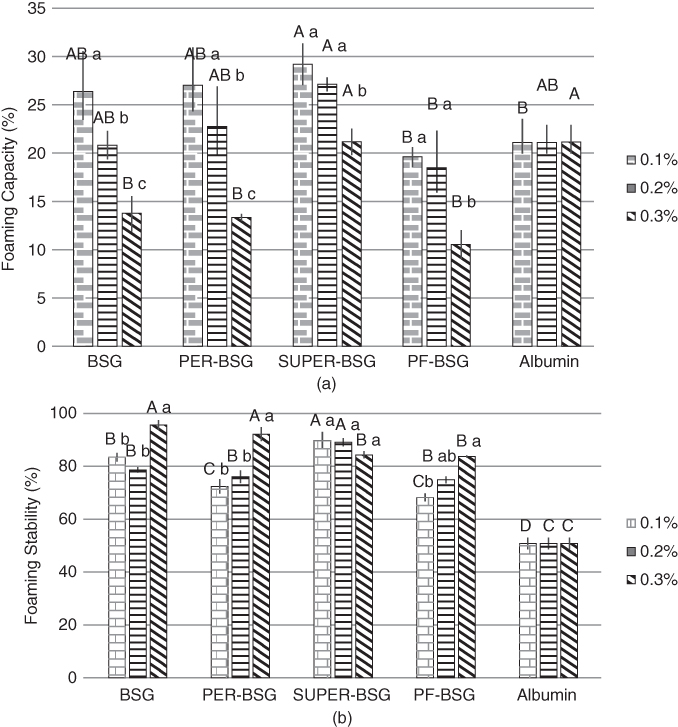
Figure 19.3 Effect of BSG and its fractions on (a) foaming capacity and (b) stability of 0.3% albumin solutions. Different letters of each bar indicate significant differences between fractions (capital letter) and different gum concentrations (small letter) at p < 0.05.
Source: Adapted from Naji‐Tabasi and Razavi [24] with permission from Elsevier.
Razmkhah et al. indicated that CSG had a higher foaming capacity and stability compared to its fractions (F1, F2, and F3). CSG could react with ovalbumin (mainly non‐covalent bonds) because of its specific molecular structure with high molecular weight. Also, CSG exhibited better surface activity than F1 and F2, which was another reason for its better foaming properties. F3 showed the lowest foaming capacity and stability due to its more compact structure compared to the other fractions and CSG; therefore, it was not able to react with ovalbumin as a foam‐forming component. As discussed previously, the chemical composition and molecular weight of the fractions varied significantly, indicating that the fractions had different molecular structures, which is an important factor for foaming properties [20].
19.4 Conclusions and Future Trends
Fractionation and the effect of purification methods on the physicochemical, rheological, and functional properties of some new gums were reviewed in this chapter. Lower yield, protein, fiber, and ash content were reported for purified chia seed gum compared to the crude gum, which was related to the removal of the majority of non‐carbohydrate components during the purification.
Partial purification of crude BSG by alcoholic precipitation had a significant effect on the quantity and quality of the extracted gum. Protein‐free BSG (phenol + ethanol treated)‐stabilized emulsions exhibited the highest complex viscosity and the strongest viscoelastic network. The purification processes changed the functionality of BSG in terms of hydrophobicity and conformational structure, altering its adsorption properties and producing bigger emulsions droplets and/or a higher degree of droplet aggregation/coalescence.
Four different purification methods (A [isopropanol and ethanol], B [isopropanol and acetone], C [saturated barium hydroxide], and D [Fehling solution]) reduced hydrophobic impurities, thereby decreasing the OHC. The purified samples C and D had the highest and the lowest OHCs among the purified gums, respectively, which is related to the effectiveness of the purification methods A, B, and D in reducing the hydrophobic fractions. The solubility and WHC of durian seed gum increased significantly after purification; Sample A had the lowest WHC among the purified gums due to the presence of higher content of impurities. All the purification methods significantly influenced both the G′ and G″ of the crude gum, which could be explained by the significant effects of the purification processes on the chemical composition of the crude gum; purification using saturated barium hydroxide produced the highest values for G′ and G″. The purified gums A and D showed the highest and least viscosities, respectively, due to the different molecular weights.
The chemical composition of crude CSG varied significantly after purification with three different precipitation methods (ethanol [sample E], isopropanol [sample I], and ethanol–isopropanol [sample EI]). The purified samples had a stronger and more elastic network structure than the crude gum due to the elimination of impurities, especially the protein component, after purification. With the elimination of protein to lower levels and increasing molecular weight from I to EI to E, the apparent viscosity and intrinsic viscosity increased along the same series, and the gel network became stronger. All the purification methods increased the thermal stability of CSG, because of elimination of impurities and the formation of more stable and ordered polysaccharide structures; sample EI showed the lowest activation energy (less sensitive to the temperature). The purified gums exhibited stronger thixotropic properties due to their more structured systems. Sample E had the lowest hysteresis loop area among the purified gums, which was consistent with its higher viscoelastic property. The purification methods improved the surface activity of CSG; sample I showed the lowest surface tension among the purified gums because it had the highest protein and uronic acid contents and the lowest molecular weight. All the purification methods improved the emulsifying and foaming properties of CSG, and the emulsifying properties did not differ significantly among the purified gums. Sample I exhibited the highest foaming capacity, and sample E exhibited the highest foaming stability, which can be attributed to the stronger foam network related to its interactions with ovalbumin.
Controlled depolymerization of CSP yielded various molecular fractions. The intrinsic viscosity decreased with increasing degradation time (0–8 h) due to the reduced molecular weight.
The fractions of BSG (fractionated using gradual ethanol precipitation; precipitate [PER‐BSG] and supernatant [SUPER‐BSG]) exhibited different monosaccharide building units. PER‐BSG, in accordance with its higher molecular weight, exhibited a higher viscosity and stronger shear‐thinning behavior than the SUPER‐BSG fraction. BSG and PER‐BSG exhibited the highest and the lowest intrinsic viscosities; the lower intrinsic viscosity and higher molecular weight of PER‐BSG were attributed to its more compact conformation. SUPER‐BSG had the highest surface activity because it had the lowest molecular weight (a strong tendency to adsorb at the air–water interface), the highest chain flexibility, and the highest content of uronic acid and protein. SUPER‐BSG and PF‐BSG exhibited the highest and the lowest emulsion stability, respectively. SUPER‐BSG formed an emulsion with the lowest mean diameter and size distribution because it had the highest protein content, surface activity, and flexibility. SUPER‐BSG improved the foaming capability significantly at all concentrations, because it had the highest protein content, surface activity, and flexibility. Treatment of BSG with protease enzyme (PF‐BSG) increased the storage modulus, whereas there was no significant difference between BSG and PF‐BSG for the other frequency sweep parameters. PF‐BSG showed lower surface activity, foaming capacity, and a low tendency to absorb on interfacial surfaces of oil and water compared to BSG, which was attributed to the elimination of protein.
Fractionation of CSG (fractionated using stepwise extraction with water: F1 [first extractant], F2 [second extractant], and F3 [third extractant]) produced different hydrocolloids with different chemical (ash, moisture, protein, and monosaccharide composition), rheological, and functional characteristics in each step. The intrinsic viscosity of the fractions increased along the series F1, F2, and F3 due to the increase in molecular weight and chain flexibility. The dynamic rheological properties indicated that the gum generated from the inner parts of the cress seeds had a stronger and more elastic network structure. The microstructure of F2 was more sensitive to the temperature (highest value of activation energy), and the hysteresis loop area increased significantly along the series F1, F2, and F3 because of their greater shear‐thinning behavior; the increase in structural recovery along the same series was related to their more elastic networks. Surface activity increased from F1 to F2 to F3 at low concentrations due to an increase in protein content and chain flexibility along the series F1, F2, and F3. The emulsion capacity increased slightly from F1 to F2 to F3, because of the increasing molecular weight, protein content, and apparent viscosity along the same series. F3 showed the lowest foaming capacity and stability due to its more compact structure compared to the other fractions and CSG; therefore, it was not able to react with ovalbumin as a foam‐forming component.
It can be concluded that the physicochemical, rheological, and functional properties of crude gums improve after purification, and various purification methods have different effects. Also, fractionation of polymers produces gums with different characteristics which can be applied to various areas. With respect to the increase in demand for natural hydrocolloids with low cost and proper functionality, fractionation and purification of new gums will expand their availability considerably, and they can be used in a variety of applications depending on their characteristics.
References
- 1 Bouzouita, N., Khaldi, A., Zgoulli, S. et al. (2007). The analysis of crude and purified locust bean gum: a comparison of samples from different carob tree populations in Tunisia. Food Chemistry 101: 1508–1515.
- 2 Cui, S.W. (2005). Food Carbohydrates: Chemistry, Physical Properties, and Applications. Boca Raton, FL: CRC Press, Taylor & Francis Group.
- 3 Cunha, P.L.R., Paula, R.C.M., and Feitosa, J.P.A. (2007). Purification of guar gum for biological applications. International Journal of Biological Macromolecules 41: 324–331.
- 4 da Silva, J.A.L. and Gonçalves, M.P. (1990). Studies on a purification method for locust bean gum by precipitation with isopropanol. Food Hydrocolloids 4: 277–287.
- 5 Naji‐Tabasi, S., Razavi, S.M.A., Mohebbat Mohebbi, M., and Malaekeh‐Nikouei, B. (2016). New studies on basil (Ocimum bacilicum L.) seed gum: part I–fractionation, physicochemical and surface activity characterization. Food Hydrocolloids 52: 350–358.
- 6 Razavi, S.M.A., Mortazavi, S.A., Matia‐Merino, L. et al. (2009). Optimization study of gum extraction from basil seeds (Ocimum basilicum L.) using response surface methodology. International Journal of Food Science and Technology 44: 1755–1762.
- 7 Osano, J.P., Hosseini‐Parvar, S.H., Matia‐Merino, L., and Golding, M. (2014). Emulsifying properties of a novel polysaccharide extracted from basil seed (Ocimum bacilicum L.): effect of polysaccharide and protein content. Food Hydrocolloids 37: 40–48.
- 8 Amid, B.T. and Mirhosseini, H. (2012). Effect of different purification techniques on the characteristics of Heteropolysaccharide‐protein biopolymer from durian (Durio zibethinus) seed. Molecules 17: 10875–10892.
- 9 Timilsena, Y.P., Adhikari, R., Kasapis, S., and Adhikari, B. (2016). Molecular and functional characteristics of purified gum from Australian chia seeds. Carbohydrate Polymers 136: 128–136.
- 10 Razmkhah, S., Mohammadifar, M.A., Razavi, S.M.A., and Ale, M.T. (2016). Purification of cress seed (Lepidium sativum) gum: physicochemical characterization and functional properties. Carbohydrate Polymers 141: 166–174.
- 11 Kök, M.S. (2007). A comparative study on the compositions of crude and refined locust bean gum: in relation to rheological properties. Carbohydrate Polymers 70: 68–76.
- 12 Razavi, S.M.A., Cui, S.W., Guo, Q., and Ding, H. (2014). Some physicochemical properties of sage (Salvia macrosiphon) seed gum. Food Hydrocolloids 35: 453–462.
- 13 Qian, H.F., Cui, S.W., Wang, Q. et al. (2011). Fractionation and physicochemical characterization of peach gum polysaccharides. Food Hydrocolloids 25: 1285–1290.
- 14 Pamies, R., Hernandez Cifre, J.G., Martinez, M.C.L., and Torr, J.G. (2008). Determination of intrinsic viscosities of macromolecules and nanoparticles. Comparison of single‐point and dilution procedures. Colloid Polymer Science 286: 1223–1231.
- 15 Razmkhah, S., Razavi, S.M.A., and Mohammadifar, M.A. (2016). Purification of cress seed (Lepidium sativum) gum: a comprehensive rheological study. Food Hydrocolloids 61: 358–368.
- 16 Amid, B.T. and Mirhosseini, H. (2012). Influence of different purification and drying methods on rheological properties and viscoelastic behaviour of durian seed gum. Carbohydrate Polymers 90: 452–461.
- 17 Osano, J., Matia‐Merino, L., Hosseini‐Parvar, S. et al. (2010). Adsorption properties of basil (Ocimum basilicum L.) seed gum. USM R & D 18: 113–117.
- 18 Koocheki, A., Razavi, S.M.A., and Hesarinejad, M.A. (2012). Effect of extraction procedures on functional properties of Eruca sativa seed mucilage. Food Biophysics 7: 84–92.
- 19 Jahanbin, K., Moini, S., Gohari, A.R. et al. (2012). Isolation, purification and characterization of a new gum from Acanthophyllum bracteatum roots. Food Hydrocolloids 27: 14–21.
- 20 Razmkhah, S., Razavi, S.M.A., Mohammadifar, M.A. et al. (2016). Stepwise extraction of Lepidium sativum seed gum: physicochemical characterization and functional properties. International Journal of Biological Macromolecules 88: 553–564.
- 21 Timilsena, Y.P., Adhikari, R., Kasapis, S., and Adhikari, B. (2015). Rheological and microstructural properties of the chia seed polysaccharide. International Journal of Biological Macromolecules 81: 991–999.
- 22 Razmkhah, S., Razavi, S.M.A., and Mohammadifar, M.A. (2017). Dilute solution, flow behavior, thixotropy and viscoelastic characterization of cress seed (Lepidium sativum) gum fractions. Food Hydrocolloids 63: 404–413.
- 23 Naji‐Tabasi, S. and Razavi, S.M.A. (2017). New studies on basil (Ocimum bacilicum L.) seed gum: part III–steady and dynamic shear rheology. Food Hydrocolloids 67: 243–250.
- 24 Naji‐Tabasi, S. and Razavi, S.M.A. (2016). New studies on basil (Ocimum bacilicum L.) seed gum: part II–emulsifying and foaming characterization. Carbohydrate Polymers 149: 140–150.
- 25 Barnes, H.A. (1994). Rheology of emulsions – a review. Colloids and Surfaces A: Physicochemical and Engineering Aspects 91: 89–95.
- 26 Pal, R. (1996). Effect of droplet size on the rheology of emulsions. AIChE Journal 42: 3181–3190.