20
Improving Texture of Foods using Emerging Hydrocolloids
Ali Rafe
Department of Food Processing, Research Institute of Food Science and Technology (RIFST), PO Box 91851‐76933, Mashhad, Iran
20.1 Introduction
Foods would never be foods if humans did not feel happy and satisfied while eating. From this perspective, palatability is the most important attribute of foods, which is not the case with medicines. Food palatability is determined by organoleptic attributes, including flavor, texture, appearance, sound, and temperature, with flavor and texture being the two major factors that determine food palatability. Flavor, which includes taste and aroma, is associated with relatively small‐molecular‐weight components, and is perceived through the chemical pathway. On the other hand, texture is associated with relatively high‐molecular‐weight components, and is perceived through the physical pathway. Texture is the integration of physical, mechanical, and thermal properties perceived in both the oral and pharyngeal phases of the feeding process. Texture is determined by the dispersal, aggregation, and alignment of food constituents, including molecules, particles, cells, and organizations. It has been found that texture governs more than 30% of food palatability, and when limited to staple foods that require a large quantity in every meal, including rice, noodles, bread, and meat, the percentage is higher [1]. Texture has profound effects on customer acceptance of food products because people obtain great enjoyment from eating and perceive changes in texture, which also affects the release profile of flavor through the retronasal pathway.
Since food texture can be manipulated by the addition of hydrocolloids in processed food products, the effect of some emerging hydrocolloids on food structure, texture, tribology, and psychology of eating are presented here. Furthermore, fractal dimensions of some hydrocolloids such as basil seed gum (BSG) and carrageenan are provided and ultimately, their functionality and applications, especially texture, are discussed in greater detail.
20.2 Influence of Hydrocolloids on Food Structure
Hydrocolloids are a heterogeneous group of long‐chain biopolymers characterized by their property of forming viscous dispersions and/or gels when dispersed in water. The presence of a large number of hydroxyl (‐OH) groups markedly increases their affinity for binding water molecules, making them hydrophilic compounds. Further, they produce a dispersion, which is intermediate between a true solution and a suspension and exhibits the properties of a colloid. Considering these two properties, they are aptly termed “hydrophilic colloids” or “hydrocolloids.” The primary reason behind the ample use of hydrocolloids in foods is their ability to modify the rheology of the food system. This includes two basic properties of food system, namely, flow behavior (viscosity) and mechanical solid property (texture). The modification of texture and/or viscosity of food systems help modify its sensory properties, and hence hydrocolloids are used as important food additives to achieve specific objectives. Several hydrocolloids belong to the category of a permitted food additive in many countries throughout the world. Various food formulations like soups, gravies, salad dressings, sauces, and toppings use hydrocolloids as additives to achieve the desired viscosity and mouthfeel. They are also used in many food products like ice creams, jams, jellies, gelled desserts, cakes, and candies to create the desired texture. Considering their role in modifying the viscosity and texture of food formulations, several studies have been conducted in various food systems employing different hydrocolloids, either singly or in combination.
Basil (Ocimum basilicum L.) is one of the endemic plants in Iran and is mainly used as a pharmaceutical plant [2]. This plant is grown in many parts of the world especially in warm regions of Asia, Africa, and Central and South America [3]. Besides its use as a traditional medicine, basil seeds are commonly incorporated into food products, such as desserts and beverages, and are used as a source of dietary fiber in Iran and some regions of Asia. These seeds, when soaked in water, swell into a gelatinous mass which has a reasonable amount of gum. It has been reported that the polysaccharides extracted from basil seed comprise two major fractions: (1) glucomannan (43%) and (1 → 4)‐linked xylan (24.29%) and (2) a minor fraction, glucan (2.31%). The presence of a highly branched arabinogalactan, in addition to glucomannan and (1 → 4)‐linked xylan, has also been shown [4]. BSG has good functional properties comparable to some commercial food hydrocolloids [ 4–6]. In a study on the steady shear flow behavior of BSG, it was concluded that the existence of yield stress, high viscosity at low shear rates, strong shear‐thinning behavior, and the heat‐resistant nature of BSG make it a good stabilizer in some food formulations such as mayonnaise, salad dressing, and dairy desserts. BSG, by its effects on the apparent viscosity of ice cream mix, draw temperature, meltdown behavior, and total acceptance, has just shown promising results in stabilizing typical fresh ice cream [6]. In addition, its impact on ice crystallization and recrystallization and on the fat structure in ice cream has been investigated [7]. BSG was used at two concentrations (0.1% and 0.2%) to stabilize ice cream, and its impact on selected physical and structural properties, especially ice crystal size, was compared to that of a commercial blend of carboxymethylcellulose (CMC) and guar gums and to an unstabilized control. Samples were temperature‐cycled at subzero temperatures, and ice crystal size was measured before and after cycling. There was no significant difference in ice crystal size after hardening, but the presence of BSG reduced ice recrystallization compared to commercial gums and no stabilizer. The addition of BSG reduced the rate of ice crystal growth by 30%–40% compared to the commercially stabilized ice creams. BSG also decreased the meltdown rate and increased the particle size, thus suggesting that BSG produced a different structure compared to the controls, possibly by lowering the air and fat interfacial tensions. More studies are needed to understand the mechanisms of action of BSG in cryoprotection and its role as a stabilizer and as an emulsifier in ice cream. The addition of selected stabilizers significantly increased the apparent viscosity and consistency coefficient values of ice cream mixes. BSG created higher viscosity at either 0.1% or 0.2% compared to the combination of CMC and guar at equivalent concentrations (Table 20.1). The viscosity of an ice cream mix is considered a key attribute as it affects the body and texture of the finished product [8,9]. In some studies, the function of hydrocolloids in enhancing viscosity and decreasing molecular mobility has been correlated to control of ice crystal growth [10]. Therefore, BSG, by producing high viscosity and low flow behavior index values, provided sufficient rheological properties for ice cream.
Table 20.1 Rheological properties of ice cream mix containing different types and concentrations of stabilizers.
Source: Adapted from Bahram Parvar & Goff [7] with permission from Wiley.
| Formulation | η a (at 50 s−1, Pa.s) | n (−) | K (Pa.sn) |
| No stabilizer | 0.046 ± 0.002c | 0.80 ± 0.03a | 0.098 ± 0.005d |
| 0.1% BSG | 0.180 ± 0.007a | 0.63 ± 0.00bc | 0.750 ± 0.038ab |
| 0.1% CMC/Guar | 0.094 ± 0.004b | 0.73 ± 0.05ab | 0.270 ± 0.043c |
| 0.2% BSG | 0.180 ± 0.010a | 0.59 ± 0.01c | 0.900 ± 0.031a |
| 0.2% CMC/Guar | 0.170 ± 0.011a | 0.67 ± 0.03bc | 0.610 ± 0.020b |
η a , Apparent viscosity; n, Flow behavior index; K, Consistency coefficient; BSG, Basil seed gum; CMC, Carboxymethylcellulose.
Different letters in a column represent significant differences (P < 0.05, n = 3) BSG basil seed gum, CMC carboxymethylcellulose.
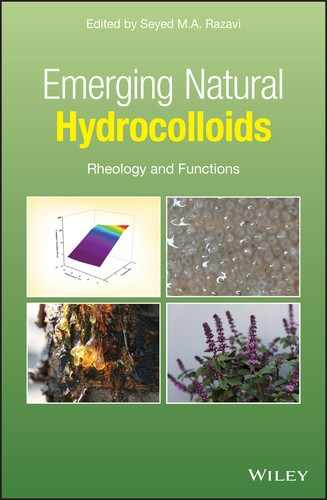
The microstructure of ice creams without stabilizer or containing two levels of stabilizers before and after temperature cycling as seen by cryo‐scanning electron microscopy (SEM) is shown in Figures 20.1 and 20.2. Besides the ice structures, BSG incorporation also induced changes in the colloidal structure of the ice cream, specifically the fat and air structures. Large aggregates were shown by particle size analysis, which may be related to the network structure formation of BSG through its emulsifying capacity. Cryo‐SEM images demonstrated smaller air cells in the presence of BSG. Further investigations, such as rheological behavior during thawing (viscoelastic properties as a function of temperature), fat and protein analysis in drip and remaining portions during meltdown test, and air bubble size in ice cream, are required for better understanding of the structural changes that occurred with the incorporation of BSG.
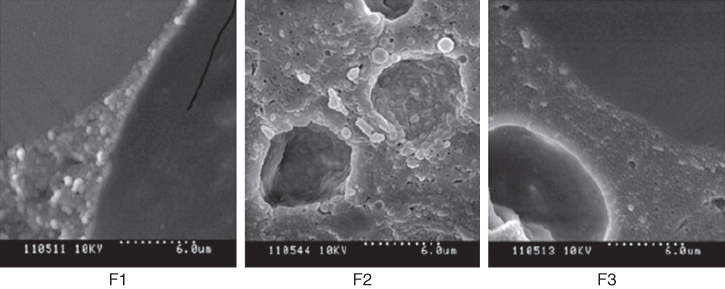
Figure 20.1 Microstructure of air bubbles with fat globules at their interfaces in ice creams subjected to temperature cycling: F1 no stabilizer, F2 containing 0.1% BSG, F3 containing 0.1% CMC/guar.
Source: Adapted from Bahram Parvar & Goff [7] with permission from Wiley.

Figure 20.2 Microstructure of ice cream samples without stabilizer (F1) and containing 0.1% BSG (F2), 0.1% CMC/guar (F3), 0.2% BSG (F4), or 0.2% CMC/guar (F5) after hardening.
Source: Adapted from Bahram Parvar & Goff [7] with permission from Wiley.
20.3 Textural Attributes
Food texture can be manipulated by the addition of hydrocolloids in processed food products. The importance of texture is emphasized in our aging society, where the number of patients with mastication and swallowing difficulties is increasing. Studies on food hydrocolloids have been carried out for the texture design of nursing‐care foods in terms of the safety of eating [1] as well as physiological functions as a dietary fiber. Food texture should be optimized from the rheological, colloidal, and tribological aspects so that foods can be masticated and swallowed easily even by patients with deficient oral strategy. For example, dysphagia is commonly managed using texture‐controlled foods, including thickened liquids and puddings designed to moderate the flow speed of bolus through the pharyngeal phase [11]. For instance, Shahsavani and Rafe [12] have investigated the rheological behavior of binary composite gels of wheat flour and high amylose corn starch, and stated that this composite gel structure can be exploited for dysphagia therapy due to the special textural properties. It has been elucidated that hydrocolloids modify not only food texture but also flavor release from the food matrix. Food products should be formulated using various ingredients to optimize texture, which increases the overall food palatability [13].
According to the soft texture of BSG gel, the penetration test has been recommended to evaluate its texture [14,15]. BSG has this ability to form a gel at 3% (w/w), which imparts 13.5 g hardness. As shown in Figure 20.3, BSG gel shows stable hardness after heating treatments at 50, 75, and 100 °C for 20 min; but heating at a higher temperature (121 °C) not only has a destructive effect on BSG but also produces a gel network with relatively high strength and hardness. It may be hypothesized that higher temperature during gel formation may have more effectively opened and exposed the BSG molecules, thus favoring their interaction, formation of junction zones, and producing a stiffer network. Freezing of BSG gel also improves gel hardness, and this alteration is more pronounced after freezing at −25 °C for 24 h (Figure 20.3) [14].
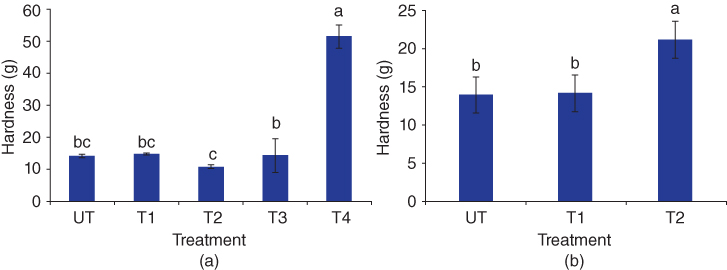
Figure 20.3 Effect of thermal treatments on the hardness of BSG. (a) Heating (UT: 25, T1:50, T2:75, T3:100, and T4: 100 °C for 20 min); (b) freezing/thawing (T1:−18 and T2:−25 °C for 24 h).
Source: Adapted from Zameni et al. [14] with permission from Springer.
Adhesiveness is the ability of gel sample to become sticky. This parameter is important, because it may influence the overall quality, appearance, and shelf life of food. BSG gel has 16.79 g.s adhesiveness, which increases significantly after heat treatment (Figure 20.4). BSG gel adhesiveness also increases after freezing–thawing, but this increment is not significant (−18 and 25 °C for 24 h), as seen in Figure 20.4. The high levels of adhesiveness of BSG make it desirable for use in salad dressing formulations. The consistency of BSG gel is ∼50 (g.s), which on heating at 121 °C causes a dramatic increment in the consistency of BSG gel. The results suggest an increase in junction zones of the gel during heating because of the existence of a large amount of unsubstituted mannan regions. The prevalence of higher molecules in BSG is likely responsible for the greater consistency of BSG gels under thermal treatments. BSG gel consistency increases negligibly after freezing treatment [14].
Figure 20.4 Effect of thermal treatments on the adhesiveness of BSG. (a) Heating (UT: 25, T1:50, T2:75, T3:100, and T4: 100 °C for 20 min); (b) freezing/thawing (T1:−18 and T2:−25 °C for 24 h).
Source: Adapted from Zameni et al. [14] with permission from Springer.
It was also understood that BSG can be utilized for coating and biodegradable films. The produced films were transparent with good mechanical properties and excellent barrier properties. Glycerol had an essential role in making homogeneous flexible films and also affected the physical and mechanical properties of BSG films. Overall, the best properties of BSG‐based films were observed in glycerol‐plasticized films [16].
The effect of freezing treatments (−18 °C for 24 h and − 30 °C for 15 h) on the rheological, emulsifying, foaming, and textural characteristics of cress seed gum (CSG) in comparison with xanthan gum have been investigated [17]. The large‐deformation test was showed an increase in the hardness, consistency, and adhesiveness of CSG gel (7% w/w) after freezing treatments, which are more pronounced at ‐30 °C for 15 h. The adhesiveness property of CSG makes it interesting for coating, binding, and agglomerating powders. The cohesiveness remains constant after freezing at −18 °C for 24 h, but there is an increase in the springiness after the freezing treatments. In contrast, freezing at −30 °C causes a dramatic increase in the gumminess property from 44.19 to 61.73 g. CSG has an excellent ability to control ice crystal growth, because the texture shows minimal change after freezing–thawing. CSG has also good emulsifying capability (490%) that is maintained after freezing. The o/w emulsion containing CSG is stable after heating at 80 °C for 30 min, but a slight decrease in its stability occurs after freezing treatments. Freezing causes both the foaming capacity and foaming stability of CSG solutions to increases slightly. The foam stability of xanthan improves after freezing treatment, but its foam‐forming capability decreases. In comparison, CSG has better foaming properties than xanthan after freezing treatments as shown in Figure 20.5. It was suggested that CSG may minimize freezing damage by reducing free water availability, controlling moisture migration, and preventing the growth of ice crystal in frozen foods, on account of the strong cross‐linking of the CSG polymer. On the other hand, conversion of water to ice increases molecular association and improves textural characteristics. Therefore, CSG like xanthan gum has potential use in the food industry and can ensure that quality is maintained throughout freezing conditions during processing, transportation, and storage [17].
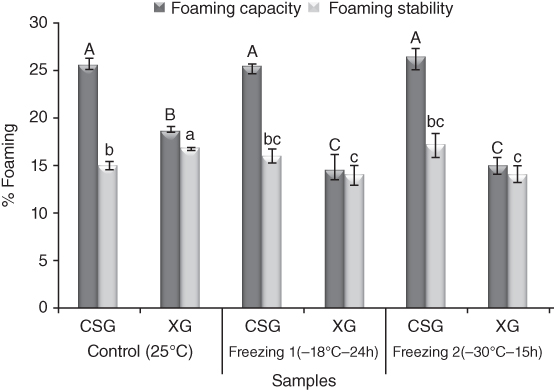
Figure 20.5 Effect of freeze–thaw treatments on the foaming properties of cress seed gum and xanthan gum.
Source: Adapted from Naji et al. [17] with permission from Springer.
In another study, Naji and Razavi [18] studied the influences of low temperature (4 °C, 96 h and 10 °C, 40 h) on the functional properties (flow behavior, time dependency, emulsifying, and foaming behavior) and textural attributes of CSG and xanthan gum. CSG gel showed elastic, adhesiveness, and cohesiveness properties, which could maintain product integrity during refrigeration operations and reduce moisture loss throughout the product shelf life; maximum flavor, texture, and color were maintained. CSG gel was also subjected to different thermal treatments (60 °C, 30 min; 80 °C, 23 min; 100 °C, 18 min; and 121 °C, 15 min) to investigate the stability of its textural characteristics using penetration and texture profile analysis (TPA) tests [19]. The results demonstrated that cress seed gel is heat stable with respect to most of the textural attributes (hardness, consistency, adhesiveness, apparent modulus of elasticity, cohesiveness, and springiness), and in some cases, the heat had an improving effect on the gel. Therefore, CSG is employed as a texture modifier in the formulation of foods subjected to high‐temperature processes. These properties are especially useful and make it easy to modulate CSG gel in specialty food as a gelling agent, for example, re‐structured foods, cold prepared instant bakery, and especially for foods subjected to high temperature that require further processing steps like blanching, pasteurization, and sterilization in food and cosmetic industries.
The effect of BSG, CSG, and quince seed gum (QSG) at concentrations of 0.1% and 0.3% on the physical, textural, and rheological properties of low‐fat whipped cream with 30% fat content was investigated and compared with a high‐fat (HF) whipped cream sample (55%) as a control. Flow curves were analyzed using the Herschel–Bulkley and Carreau models. The rheological results confirmed that all samples were shear‐thinning fluid, exhibiting yield stress and thixotropy properties. The frequency sweep test showed that at the same gum concentration, mixtures containing BSG have higher storage, loss moduli, and complex viscosity than those of mixes with QSG and CSG, and all mixes containing gum displayed weak gel‐like behavior. Analysis showed that increasing gum content led to increased viscosity, hardness, and overrun, leading to better quality in the final products. Moreover, textural properties showed that the effect of BSG on hardness and adhesiveness was significantly greater than that of QSG and CSG at the same concentration. On the basis of the obtained result, 0.3% concentration of added BSG had a much greater effect on the whipped cream properties than those of mixes with QSG and CSG [20]. Overall, the textural characteristics of whipped cream indicated a positive correlation between gum level and hardness or adhesiveness. QSG samples showed less overrun but 0.3% CSG and BSG with HF whipped cream had the same overrun. Also, QSG mixes showed the least value of drainage volume. Data analysis showed that the hysteresis loop values of whipped cream mixes containing BSG 0.1, CSG 0.1, CSG 0.3, and HF whipped cream were equal. The concentration of added BSG had a much greater effect on the whipped cream properties. All results suggested the appropriate potential application of BSG and QSG in the formulation of whipped cream as fat replacers [20].
20.4 Tribology (Body–Texture Interaction)
Food texture is perceived during oral processing, in which a series of oral operations occur in the right sequence with a variety of organs and muscles working in a coordinated manner from the first bite to swallowing [21]. Food oral processing is well described by the in‐mouth process model (Figure 20.6) [22]. The x‐axis represents time, which increases as the oral processing proceeds, and the y‐axis represents the degree of lubrication, which increases as the mixing of food bolus with saliva proceeds. The z‐axis represents the degree of structure, decreasing as the mastication proceeds. According to this model, solid foods should be masticated to lower the degree of structure (lower than the plane ABCD) and also should be mixed with saliva to increase the degree of lubrication (to pass the right side of the plane EFGH) prior to swallowing. Solid foods like steak and cake should be masticated and lubricated to break down the structure and to form a coherent bolus, while liquids and raw oyster are swallowed immediately as a bolus is formed without great effort. When the behavior of oral processing is compared between solid foods and liquid foods, solid foods take more time to enter the “swallowing box” along with larger changes in the structure until a ready‐to‐swallow bolus is formed. The reasons why texture is more important in solid foods than in liquid foods include [23,24] the following:
- The mechanical, geometrical, and surface properties of solid foods can be changed to a greater degree than those of liquid foods during oral processing.
- Residual time in the mouth for solid foods is longer than that for liquid foods.
- Humans are more sensitive to changes in elasticity than in viscosity [25].
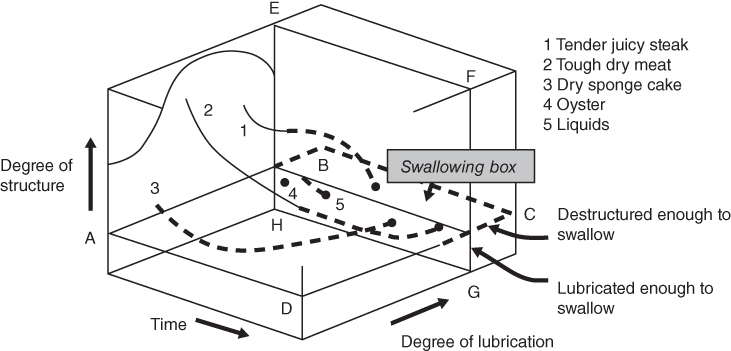
Figure 20.6 In‐mouth process model from mastication to swallowing.
Source: Adapted from Hutchings and Lillford [22] with permission from Wiley.
These points emphasize the importance of the optimization of food texture, particularly in developing solid‐ and gel‐type food products.
Food oral processing is an essential daily dynamic activity that includes all muscle activities, jaw movements, and tongue movements that contribute to preparing food for swallowing [26]. A number of processes occur in the mouth, including a mechanical breakdown of solid pieces into smaller fragments, enzymatic reduction of starches into sugars, molecular interaction with microorganisms, and mixing with saliva. It is the first step in the food intake and metabolism process that delivers energy and essential nutrients to our body [27]. The intensity of the muscular, jaw, and tongue movements during oral processing is dependent on the type of food in the oral cavity. Four categories of food products can be defined on the basis of their rheological and sensory properties: liquids, semisolids, soft solids, and hard solids [28] that are defined by Stieger and van de Velde [27] as follows. Liquids flow and do not require chewing before swallowing, although liquids are orally processed (e.g., milk, beverages, yogurt drinks). Semisolids are predominantly squeezed between the tongue and palate during oral processing using the molars (e.g., pudding, custard). Soft solids require (initial) chewing between the molars, but do not elicit “crispy” sensations (e.g., cheese, processed meat). Hard solids are crispy, require chewing between the molars, and generally produce sounds during oral processing (e.g., crackers, raw vegetables, apples).
The perception of food texture is vital in determining its acceptance and preference by consumers. Traditionally, texture is measured with a sensory panel; however, this method is subjective and time consuming. Hence, interest is growing in an instrumental method that can provide an objective measure of texture. Once in the mouth, the food is manipulated by the tongue, teeth, inside of the cheeks, and lips with different speeds and pressures [29]. Through the various stages of mastication, food is continuously chewed, mixed up with the saliva, and gradually converted into a bolus ready to be swallowed [30]. Various sensory textural attributes that human senses perceive during different stages of the mastication process include hardness, softness, adhesiveness, springiness, thickness, brittleness, crispiness, sponginess, smoothness, roughness, lumpiness, pastiness, creaminess, slipperiness, and many others [30]. Foster et al. [31] have rightly described sensory perception during oral processing as a dynamic process. Over the past few decades, extensive studies in food texture studies have attempted to qualify and quantify the physical properties of foods using techniques such as a texture analyzer [32], posthumous funnel [33], viscometer [34], and rheometer [35–37]. Many textural features, such as hardness, springiness, adhesiveness, fracturability, and thickness perceived during oral processing, have been well explained by some specific physical parameters measured using these techniques [21]. However, these approaches are essentially based on bulk destruction and shear deformation. Therefore, these methods are feasible only for those texture properties which are linked directly to bulk phase deformation but are not applicable to some of the sensations that are detected by rubbing and squeezing actions (upward/downward movement along with horizontal movements) of the tongue against the palate, such as creaminess, slipperiness, and smoothness. Such actions create both a normal and a shearing force in the mouth and generate a friction/lubrication sensation between the palate and the tongue with the food product (or food–saliva mixture) acting as the lubricant. These oral actions are no longer associated with bulk phase deformation but have more to do with thin layer rheology or tribology. In view of the limitation of the rheometer, posthumous funnel, viscometer, and texture analyzer, which tend to utilize either the normal force or the shear force to describe some of the oral sensations, tribology, the study of thin film and lubrication, has attracted growing interest in the past decade in food texture studies. It has been hypothesized that food tribology could explain the physical fundamentals for food texture studies where rheology and texture analysis have failed. One of the most obvious implications of food tribology is the study of smoothness sensation, an essential texture feature linked to oil/fat presence and creaminess perception. The food industry is under a growing pressure to develop tasty fat‐reduced food to combat the increased number of fat‐related diseases worldwide and an instrument that can mimic fat‐related sensory attributes such as creaminess and fattiness [38].
Tribology, a sub‐category of rheology, is the study of friction between two interacting surfaces, and is related to wearing and lubrication. Tribology promotes a fundamental understanding of food structure–texture relationships [38]. During oral processing, food structure is continually broken down, and the food is mixed with saliva, resulting in the formation of a thin film on the oral surfaces, particularly just prior to, during, and after swallowing. At this stage, the tribology of the tongue–palate contact rather than the bulk rheological properties of the food dominate textural sensations. Liquid and semi‐solid foods have short oral retention times (<5 s) [39], with little to no chewing requirement. As a result, the texture of liquid and semi‐solid foods must be assessed rapidly and are mainly governed by their lubricating behaviors during retention in the mouth. In recent years, tribology has been used to determine structure–function relationships that are not revealed by the traditional rheometer, allowing important advances in understanding how colloidal systems affect lubrication and influence in‐mouth sensory perception in different food systems [40].
The ability of polysaccharides to modify the texture of liquid and semi‐solid foods is associated with polysaccharide lubrication properties [41]. However, there are relatively few studies that investigate polysaccharides as aqueous lubricants in tribological contacts. Hence, a better understanding of the tribological behaviors of these biopolymers is of importance to food manufacturers for more precise control of food texture as well as improvement of sensory behavior of the product during oral processing. In a recent study, the large amplitude oscillatory shear (LAOS) behavior and tribological properties of gum extracted from Alyssum homolocarpum seed gum were investigated [42]. The gum displayed weak gel behavior and had viscoelastic moduli that were dependent on both concentration and temperature. Moreover, its viscosity showed low‐temperature dependence, indicating that A. homolocarpum seed gum is a promising ingredient in food formulations requiring good temperature stability. At higher concentrations, greater stability to permanent deformation under large deformations and lower friction coefficients were observed. The results were likely related to the higher degree of molecular connectivity and development of network structures at higher concentrations. Decreasing the temperature, interestingly, reduced stability to permanent deformation. A stronger gel‐like network structure at lower temperatures achieved through molecular entanglements and hydrogen bindings (as secondary forces) probably reduced the flexibility of the network, resulting in greater structural damage under large strains. They stated that their knowledge can be extended to other hydrocolloids with similar structures and will assist in the development of hydrocolloid‐based food products with improved stability and favorable textural features [42]. However, additional study of nonlinear viscoelastic and tribological behavior is needed before introducing this polysaccharide as a novel food additive in different liquid and semi‐solid systems.
Fish gelatin–gum arabic complexation significantly impacted the small amplitude oscillatory shear (SAOS), LAOS, and tribological behaviors of concentrated emulsion [43]. They understood that reducing the pH of the concentrated emulsion resulted in greater nonlinear behavior and increased shear thinning under LAOS, but higher critical strain, higher moduli values in the linear viscoelastic region (LVR), and lower friction coefficients were observed. These results were related to emulsion microstructures: greater fish gelatin–gum arabic complexation at lower pH resulted in higher monodispersity in oil droplet size distribution and increased network extensibility. They obtained fundamental knowledge of the relationships between concentrated emulsion microstructures, mechanical properties, and friction behavior, as well as the influence of biopolymer interactions on these relationships. This knowledge can be used to develop emulsion‐based food products with greater stability and specific textural attributes [43].
In another study, the effect of some commonly used hydrocolloids in yogurt formulation, including gelatin (0.5%–1.5%), xanthan gum (0.005%–0.015%), carrageenan (0.01%–26 0.08%) and modified starch (0.5%–1.5%) on the physical, tribological, and organoleptic characteristics of skim pot‐set yogurt (0.1% fat) was evaluated. Their results support the development of a tribology model for yogurt, which can be directly correlated with the scores on texture and mouthfeel attributes from the sensory panel by means of statistical analysis. The tribological behavior, which signifies the lubrication property of the product, depended on the fat content and on the type and dosage of hydrocolloid. Among the four hydrocolloids investigated, gelatin appeared to be the best hydrocolloid due to its ability to reduce the syneresis and increase the texture, viscosity, gel strength, and lubrication properties of skim yogurt. As a result, its sensory perception was significantly improved, and it achieved the same sensory scores as full‐fat yogurt for various desired sensory attributes, such as thickness, smoothness, and creaminess. Both xanthan gum and carrageenan increased the firmness and viscosity of skim yogurt, but also significantly increased the syneresis and undesired sensory mouthfeel characteristics, such as chalkiness and lumpiness. Modified starch slightly improved the lubrication properties and thickness of skim yogurt without significant changes in the product texture. From the tribological analysis of investigated samples, a four‐zone tribology model for yogurt was proposed. Each zone corresponds to different mechanisms of fluid entrained between the two contact surfaces. The tribology behavior of the yogurt fluid can therefore be represented by the position of each transition point and the slope of each friction zone, which were aligned with the sensory scores from the trained panel [44].
As explained earlier, there are only a few limited works on the tribological behavior of hydrocolloids and gum, which mainly related to the limitation of technology, and as a result, tribological studies on food systems in the past few decades have been inadequate. However, with the recent emergence of new experimental devices, there has been a surge in research and development in the food tribology area. Data obtained from various tribological devices show that the friction and lubrication properties of food samples can be measured and are related to attributes like fatty feel, astringency, smoothness, roughness, and slipperiness. A few of the most representative tribology apparatuses have been discussed, from the former technology, such as the friction tester, to the latest technology, the mini‐traction machine [38]. It is stressed that, besides applying an appropriate sliding speed and load for accurate tribological measurements, another important factor that should be considered is the representative surface on which the measurements are conducted. It has been demonstrated that different surface characteristics lead to completely different lubricating behavior of the same food. Polydimethylsiloxane (PDMS) is currently a feasible choice for food tribology studies due to its elastic characteristics, which are close to that of tongue tissue. Although very limited studies are available on the application of the tribometer in food systems, the outcomes so far show the great potential of the approach in establishing a relationship between tribological parameters and the perceived texture and mouthfeel attributes.
20.5 Consumer Perceptions of Food Hydrocolloids
Consumer perceptions and resulting action or inaction dictate the commercial future of any food product or ingredient [45]. In consequence, it would be interesting to know whether food hydrocolloids are more “label friendly” than others, in terms of perception as additives, and how much consumers know about them, since labeling is a key quality factor in food acceptance. Seisun [45] stated that in terms of perception and label image, pectin probably has the best and most friendly image, while other hydrocolloids such as CMC have “a very chemical” (negative) connotation. However, as far as the authors know, a rare scientific study has dealt with consumer perceptions of food hydrocolloids as additives [46].
Perception of the healthiness of food hydrocolloids, as mentioned in the Figure 20.7, are awarded scores between 1 and 9 in answer to the question “How healthy do you consider a dairy food product containing [Name of the Food Hydrocolloid]?”. It should be noted that “modified potato, tapioca or corn starches” thickeners were rated more highly than the generic term “modified starch.” This response also suggests that when the source of the substance is familiar (all the plant sources mentioned are known ones), consumers perceive it as close to them, more natural, or less worrying. That is a useful fact for hydrocolloid producers to know, as they can confidently state the origin of a pectin, a starch, or a gum that is produced from plant sources with which consumers are familiar. Following the same line of reasoning, all the more “chemical” names are perceived as less healthy. This applies even to carrageenans, which seem to be unfamiliar. The exception is sodium alginate. This hydrocolloid has been popularized by its applications in avant‐garde cuisine, in which Spanish chefs have achieved international fame. Regarding the type of name used to identify an added ingredient, Ares et al. [47] found highly significant influences on consumers' evaluations; these authors determined that the use of common names such as “fiber” resulted in an increased perception of healthiness when compared to the use of compound or scientific names [46]. Consequently, little knowledge and a relatively negative perception of additives were identified, but the consumers did not have food hydrocolloids in mind when they thought of additives. Thickeners were principally identified with flour and starches, and a little knowledge about gums was also found. A strong association between “industrially processed” food and additives/thickeners was identified. Good prospects can be predicted for food hydrocolloids due to their natural origin in familiar sources which are “cleaner” in the consumers' eyes [46].
![Horizontal bar graph for consumer perception as a response to the question: How healthy do you consider a dairy product that contains. [Name of the hydrocolloid]? with 18 bars for cornstarch, gelatin, etc.](http://imgdetail.ebookreading.net/202009/02/9781119418665/9781119418665__emerging-natural-hydrocolloids__9781119418665__images__c20f007.jpg)
Figure 20.7 Consumer perception as a response to the question: “How healthy do you consider a dairy product that contains. [Name of the hydrocolloid]?
Source: Adapted from Varela and Fiszman [46] with permission from Elsevier.
In general, work concerning eating psychology is rare. For example, Stanley and Taylor [37] have reviewed the rheological basis of the oral characteristics of the fluid and semi‐solid foods. There is considerable speculation as to the actual stimuli and mechanisms involved in the oral evaluation of fluid and semi‐solid foods. There is also evidence to suggest that non‐oral cues, such as tilting and stirring, may also influence the oral judgments of assessors. Small‐deformation stimuli from semi‐solid and fluid food materials may be implicated in the oral evaluation of texture, but it is difficult to imagine how the mouth is capable of such sensitivity. A large‐deformation stimulus which correlates with small‐deformation measures is more likely, such as the peak shear stress generated in moving the sample from rest. For all practical purposes, dynamic viscosity, measured through small deformations by oscillation at a frequency of 50 rad s−1, is most predictive of oral thickness assessments for fluid and semi‐solid foods. Viscosity measurements at a steady shear rate of 10 s−l, giving large deformations, also correlate with oral thickness ratings, but tend to underestimate the thickness of many foods, particularly weak gels. There is no reason to believe, however, that either large deformations (rotation) or small deformations (oscillation) actually occur in the mouth as they do in rheological instruments.
20.6 Fractal Analysis
20.6.1 Concepts and Theory
Gelation can be described using the scaling laws. Various scaling laws have been developed and are used to explain or predict the rheological features of gelling systems, especially for the sol–gel transition. The widely used scaling law for the rheological behavior of a gelling system in the vicinity of the gel point is developed as follows [48–50]:
which is based on the power‐law behavior of the shear relaxation modulus G (t) at the gel point:
where n is called the critical relaxation exponent, which determines the stress relaxation rate at the gel point. S g is the critical gel strength, which can be simply understood as the relaxation modulus at the gel point when the relaxation time is 1 s. A similar expression can also be applied for G' and G″ at the critical gel point:
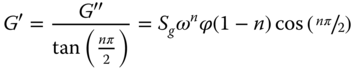
where ϕ(1‐n) is the gamma function. If n is known, S g can be calculated from G′ or G″ at the gel point using Eq. (20.3).
A number of studies have shown that n is not universal and varies with the gelling system. For example, at the sol–gel transition induced by electrostatic interaction in the mixture consisting of oppositely charged polyelectrolyte (quaternized hydroxyethylcellulose ethoxylate, QHEC) and nanocrystalline cellulose (NCC), n changes from 0.785 to 0.773 at different concentrations of QHEC [51]. For the gelation of alginate induced by Cu2+ ions and in situ released Ca2+ ions, it was found that n decreased with increasing alginate concentration in the former case, while n was independent of alginate concentration in the latter case. Many studies have also demonstrated that n is a constant [52–54]. It was found that the n value of κ‐carrageenan hydrogel is independent of its concentration [55]. The universal value of n means that the sol–gel transition takes place at the same viscoelastic distance from a completely viscous liquid (n = 1) or from a completely elastic solid (n = 0). It was also shown that by increasing the temperature, the critical gel temperature increased for κ‐carrageenan gels, which implies that more junctions are formed at a higher sol–gel transition temperature to maintain the same viscoelasticity.
The physical nature of a gelling system at the gel point can also be described by the critical gel strength, S g , defined by Eq. ( 20.3). Studies of chemical gels have shown that a decrease in n increases S g , which is related to the physical strength of a gel network at the gel point. The rheological study on S g of κ‐carrageenan showed that in spite of the independence of n relative to concentration, S g increased with increasing gum concentration. This indicates that S g is related to the total mass of κ‐carrageenan in the solution [55]. The increase in S g with κ‐carrageenan concentration may be considered to be due to the increase in the aggregate density at the gel point.
The fractal dimension can be explained in another form. When colloidal gels are far from the gelation threshold, the scaling law for the elasticity and the limit of linearity (γo) can be considered from the standpoint of the fractal nature of the colloidal flocs [56]. Depending on the strength of inter and intra‐floc links, there are two regimes: (1) a strong‐link regime (inter‐floc links have higher elasticity than those in the intra‐floc links) and (2) a weak‐link regime (inter‐floc links are weaker than intra‐floc links). In the strong‐link regime, the dependence of the elasticity and the limit of linearity of the gels on the particle concentration (ϕ) can be described as follows:
In the weak‐link regime:
where d is the Euclidean dimension, d f is the fractal dimension of the flocs (d f ≤ 3), and x is the fractal dimension of the floc backbone (1 ≤ x < d f ) [56].
Recently, Wu and Morbidelli [57] have extended the Shih et al. model [56] by considering an appropriate effective microscopic elastic constant α (where α ∈[0, 1]) to estimate the fractal dimension for both inter‐ and intra‐floc links. This indicates the relative importance of these two contributions and helps identify the different gelation regimes prevailing in the system.
20.6.2 Scaling Behavior and Fractal Analysis of BSG Gels
The volume fraction of particles (ϕ) in the gels was assumed to be proportional to the hydrocolloid concentration (C). Fractal dimension values of BSG gels were evaluated using values of the slopes of log G′ versus log C and of log γo versus log C and on the basis of the models developed by Shih et al. [56] and Wu and Morbidelli [57].
The rheological data showed BSG and BSG cross‐linked with sodium trimetaphosphate (BSG‐STMP) gels exhibited a power‐law behavior or a scaling relationship with respect to particle concentration that can be fitted as G′ ∼ Cn, where n is the power‐law exponent. The n values were positive for both gels and for the BSG–STMP gel (1.52) was more than that of the BSG gel (1.36), suggesting that STMP addition plays an important role in the structural changes in the gel network of BSG [58]. However, the n value of BSG with and without STMP was less than that of most protein gels, which varied from 2 to 7 [59–65]. In comparison with protein gels, increasing the particle concentration of the colloidal gel made from BSG had little effect on the gel elasticity. Since the n values of BSG in the presence and lack of STMP were less than 2.0, reflecting the fact that the measurements are too far from the critical gel concentration (percolation threshold), and the overall concentration dependence of G′ follows a simple power‐law model [64]. Consequently, the corrections for the frequency dependence of the modulus and instrumental artifacts are not necessary, and the scaling law theories can be used for BSG gels [58].
The limit of linearity or critical strain (γo) is defined as the end point of the linear region, where G' deviates by more than 5% from its maximum value. The maximum linear strain or limiting strain of BSG gels with and without STMP has shown a power‐law relationship with the BSG concentration as γo ∼ Cm, where m is the power‐law exponent. For both BSG gels, negative m values were obtained [58]. The m value of BSG cross‐linked with STMP (0.49) was greater than that of BSG without STMP (0.26), while the m value of BSG was less than that of globular protein gels. Depending on the nature of the gels and the preparation method, the m value extends the extreme range of negative and positive values from −3.4 to 5.3. The literature has shown that β‐lactoglobulin (BLG) transparent gels at pH 7 had the lowest m value (−3.4), and the highest m value (5.3) was obtained for bovine serum albumin turbid gels [57].
The fractal dimension (d f ) is an indicator of the connectivity of the gel network, which can uniquely describe the structure of a particular cluster [66]. It varies from 1 for a completely random system like an inert gas to 3 for a completely ordered system such as a perfect crystal. The fractal dimension of BSG in the presence and absence of STMP was measured by the scaling models of Shih et al. [56] and Wu and Morbidelli [57]. The results showed that both G′ and γo increased when the BSG concentration increased, showing that the gel system can be considered to be in the weak‐link regime [58]. d f and x are easily calculated by applying Eqs. (20.5) and (20.6) according to the Shih model. The fractal dimensions were 2.34 and 2.26, and the x values were 1.3 and 1.2 for BSG and BSG‐STMP gels, respectively. This implies that less compact 3‐D clusters had formed (scattered cotton or batting structure), and there is more space for the solvent in the BSG molecules, which has been established by SEM images [67]. In fact, the molecular structure of BSG resembles a layer such as cotton batting in which there is enough space for water to entangle with functional groups of BSG. The particular structure may be the reason for the ultralow friction and high lubricant properties of BSG [68]. Therefore, several layers of BSG formed a pad with high water absorption capacity. Furthermore, by cross‐linking STMP to BSG, d f increased, indicating that cross‐linking of STMP with a functional group of BSG such as alcohol groups occurred, building a structure which is desirable for swelling and hydrogel preparations such as hydrogels based on pullulan cross‐linked with STMP [69]. The d f values of BSG are also in good agreement with those of most other protein gels, whose d f values lie between 1.5 and 2.8 [ 59–62,65,70, 71].
The model of Wu and Morbidelli [57] allows one to obtain two additional parameters, β, and α: The parameter α indicates the relative importance of the elastic contributions of both inter‐ and intra‐floc links and can be determined on the basis of the values of β and x (Eq. (20.10)). According to the model, the parameter α allows the different gelation regimes (i.e., weak‐link, transition, or strong‐link) prevailing in the system to be identified. The x value was estimated two times (1 and 1.3) to calculate the α value according to the model of Wu and Morbidelli [57]. As expected, the α value was obtained as 1, indicating the weak‐link regime of BSG gels [58]. According to the theory of Shih et al. [56], strong‐link and weak‐link regimes have α values of 0 and 1, respectively.
In order to compare the d f values of BSG with computer simulations by the box‐counting method, SEM images of BSG from our previous work were applied [67]. Results of simulations showed that fractal aggregates made in a diffusion‐limited process indicating a fractal dimension of 1.8 [58]. Similar findings have also been found for a wide range of colloidal particles such as latex, silica, gold and white egg protein [ 65 72–74]. Indeed, the d f of biological macromolecules such as hydrocolloids and proteins have higher fractal dimensions than those forecast by simulations, which may be attributed to the nature of biological aggregates and their restructuring [72]. As a result, the fractal power‐law model showed good agreement between fractal dimensions obtained from the gel modulus and structural approaches for BSG gels [58].
20.6.3 Scaling Behavior and Fractal Analysis of κ‐Carrageenan
In another work, the fractal dimension was studied for κ‐carrageenan solutions [55]. It was found that when the temperature was reduced from 40 to 36 °C, G' becomes independent of frequency and approached a plateau value. If G' is considered as the quasi‐equilibrium modulus (Ge), the scaling law may be established as follows:
where k is the front constant, ɛ = (p − p g )/p g is the relative distance of a gel variable (p) from the sol–gel transition point (p g ), and z is the scaling exponent [75]. It was observed that G e increased with decreasing temperature at a constant κ‐carrageenan concentration due to the formation of a much larger quantity of aggregates. On the other hand, the relative distance at a fixed temperature increases with increasing κ‐carrageenan due to the increase in the critical gel temperature, which leads to the conclusion that G e increases with increasing κ‐carrageenan concentration at a certain temperature. To examine the validity of the scaling law for G e in the stable gel state, a linear fitting to the data has been performed, which gave the following relation:
The theories based on the different assumptions have predicted different values of z. For example, using the percolation model, de Gennes [76] predicted z = 1.9. On the basis of the Bethe lattice, the mean‐field theory predicted z = 3.0 [77]. Different values of z were also experimentally obtained from various gel systems such as z = 2.6 for polyvinyl chloride (PVC) gels [53], z = 1.9 for gelatin gel [78], and z = 2.2 for κ‐carrageenan hydrogels [55]. The variation in z in various gel systems suggests that z is related to the different gelation mechanisms and structures. The thermoreversible gelation behavior of the κ‐carrageenan hydrogels was clarified, and the rheological scaling laws were examined and discussed to gain an understanding of the gelation and the relationship of the viscoelastic properties with the gel microstructures [55].
20.7 Microstructure of BSG
SEM micrographs of BSG provide detailed information about the structures of the polysaccharide (Figure 20.8). It is seen that BSG has a fibril structure, containing a globular structure similar to scattered cotton [67]. The average BSG diameter was about 3.2 μm. It was also found that after adding BSG to BLG, the structure was no longer protein continuous and changed into a bicontinuous microstructure [67]. Furthermore, as the BSG‐to‐BLG ratio increased, the network became finer, and the pores became smaller. This microstructure has also been seen for some other hydrocolloids such as gellan gels and mixed systems like whey protein isolate (WPI)‐κ‐carrageenan [79–81]. A continuous κ‐carrageenan network with dispersed WPI aggregates was also observed for a similar system [82].
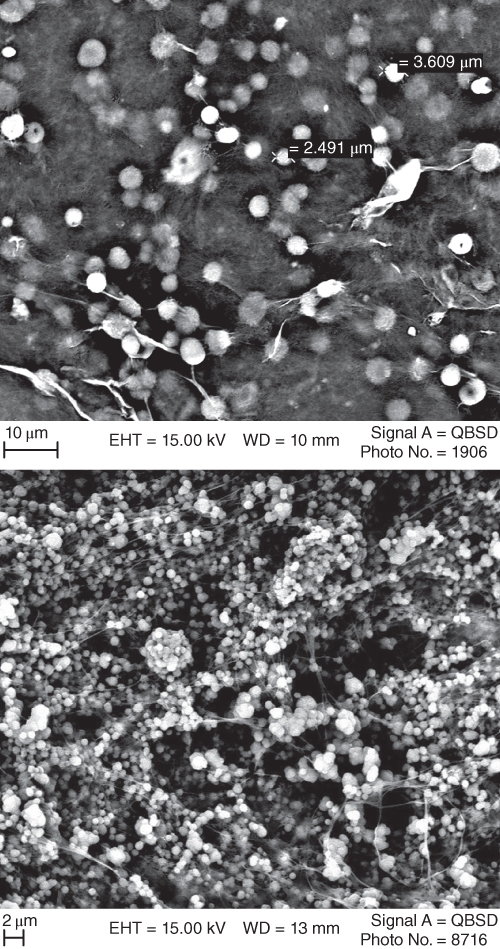
Figure 20.8 From top SEM micrographs of BSG at 1% concentration and BLG–BSG mixture in the ratio 5:1, respectively.
Source: Adapted from Rafe et al. [67] with permission from Elsevier.
In order to gain a better insight into the molecular structure of BSG, CLMS microscopy has been studied [83]. The confocal images of BLG 10% and BLG–BSG mixtures for different ratios are shown in Figure 20.9. The protein network, stained with Rhodamine B, is depicted as cyan areas. It can be seen that all gels exhibited fine‐stranded structures. In addition, confocal microscopy demonstrated that the network structures of the BSG–BLG mixed gels were different from those of the pure BLG gels; that is, the mixed gels seemed less dense and compact (Figure 20.9a,b). In addition, a less homogeneous network formed that was made up of larger particles and pores, similar to the observation reported by Stading et al. [84]. The protein globules were grouped in large clusters first, and then with a further increase of BSG, more fine structure of the protein occurred (Figure 20.9c). The smaller protein aggregates seem to be distributed quite homogeneously throughout the sample, and the large aggregates may just be the result of polydispersity of the aggregate sizes. Further increases of BSG resulted in aggregation of the spherical protein domains probably with higher protein concentration. Even further increase would probably lead to the collapse of the gel structure (Figure 20.9d).

Figure 20.9 Confocal microscopic photographs of a (a) 10% B‐lactoglobulin gel, (b) 10:1 BLG–BSG, (c) 5:1 BLG–BSG and (d) 2:1 BLG–BSG.
Source: Adapted from Rafe et al. [83] with permission from Elsevier.
In fact, the molecular structure of BSG resembled a layer such as cotton batting. The particular structure may be the reason for the ultralow friction and high lubricant properties of BSG (Figure 20.10) [68]. Therefore, several layers of BSG formed a pad with high water absorption capacity. Furthermore, when STMP was added to BSG, d f increased, indicating that cross‐linking of STMP with a functional group of BSG such as alcohol groups occurred, building a structure which is desirable for swelling and hydrogel preparations such as hydrogels based on pullulan cross‐linked with STMP [58].
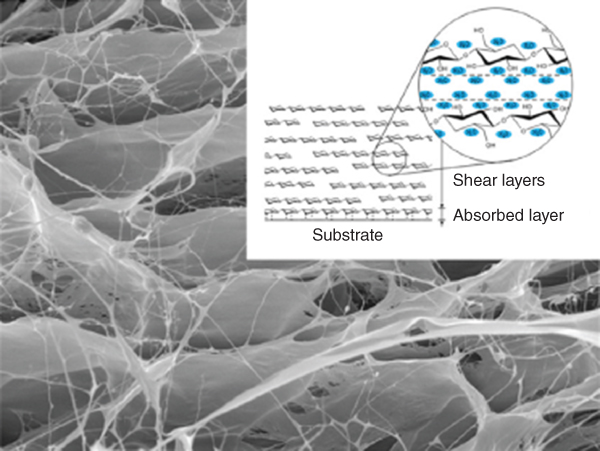
Figure 20.10 SEM micrograph of hydrated BSG and its ultralow friction property.
Source: Adapted from Zhang et al. [68] with permission from Elsevier.
20.8 Conclusions and Future Trends
Hydrocolloids have a wide array of functional properties in foods from thickening, gelling, emulsifying, stabilizing, and so on. Among the different functionalities of hydrocolloids, texture design of food is a key factor in food industries, and many attempts have been made on this property. Features such as gelling and emulsifying properties have been found in novel biopolymers like BSG and CSG in the recent decade. Limiting studies have been carried out on new hydrocolloids as well as on their textural properties, and so much effort is needed to remove the scientific gap of research on the textural properties of novel biopolymers. Although it is possible to produce all kinds of gels by manipulating the biopolymer concentration, it is important to have precise knowledge of the hydrocolloid interactions, gel properties, and microstructure in order to be able to provide the proper conditions to obtain the desired structure. The fractal analysis also provides valuable structural knowledge on hydrocolloid gels that could be determined from simple rheological measurements. Cross‐linkers such as STMP can be used with a functional group of BSG such as alcohol groups to build a structure which is desirable for swelling and hydrogel preparations. As can be understood from this chapter, studies on the effect of new hydrocolloids on food texture, psychology, and fractal analysis are rare, and much research on these aspects needs to be done.
References
- 1 Nishinari, K. (2009). Texture and rheology in food and health. Food Science and Technology Research 15: 99–106.
- 2 Naghibi, F., Mosaddegh, M., Mohammadi Motamed, S., and Ghorbani, A. (2005). Labiatae family in folk medicine in Iran: from ethnobotany to pharmacology. Iranian Journal of Pharmaceutical Research 2: 63–79.
- 3 Paton, A., Harley, M.R., and Harley, M.M. (1999). The genus Ocimum. In: Basil (ed. R. Hiltumen and Y. Hol), 1–38. The Netherlands: Harwood Academic Publishers.
- 4 Hosseini‐Parvar, S.H., Mortazavi, S.A., Razavi, S.M.A. et al. (2010). Steady shear flow behavior of gum extracted from basil seed gum (Ocimum basilicum L.): effect of concentration and temperature. Journal of Food Engineering 101: 236–243.
- 5 Razavi, S.M.A., Mortazavi, S.A., Matia‐Merino, L. et al. (2009). Optimization study of gum extraction from basil seeds (Ocimum basilicum L.). International Journal of Food Science and Technology 44: 1755–1762.
- 6 Bahram Parvar, M. and Razavi, S.M.A. (2012). Rheological interactions of selected food hydrocolloids: effects of sugar, milk and emulsifier. International Journal of Food Science and Technology 47: 854–860.
- 7 Bahram Parvar, M. and Goff, H.D. (2013). Basil seed gum as a novel stabilizer for structure formation and reduction of ice recrystallization in ice cream. Dairy Science and Technology 93: 273–285.
- 8 Miller‐Livney, T. and Hartel, R.W. (1997). Ice recrystallization in ice cream: interactions between sweeteners and stabilizers. Journal of Dairy Science 80: 447–456.
- 9 Marshall, R.T., Goff, H.D., and Hartel, R.W. (eds.) (2003). Ice Cream. New York: Kluwer Academic/Plenum.
- 10 Bahram Parvar, M. and Mazaheri Tehrani, M. (2011). Application and functions of stabilizers in ice cream. Food Reviews International 27 (4): 389–407.
- 11 Quinchia, L.A., Valencia, C., Partal, P. et al. (2011). Linear and non‐linear viscoelasticity of puddings for nutritional management of dysphagia. Food Hydrocolloids 25: 586–593.
- 12 Shahsavani Mojarrad, L. and Rafe, A. (2017). Rheological characteristics of binary composite gels of wheat flour and high amylose corn starch. Journal of Texture Studies https://doi.org/10.1111/jtxs.12302.
- 13 Funami, T. (2011). Next target for food hydrocolloid studies: texture design of foods using hydrocolloid technology. Food Hydrocolloids 25: 1904–1914.
- 14 Zameni, A., Kashaninejad, M., Aalami, M. et al. (2014). Effect of thermal and freezing treatments on rheological, textural and color properties of basil seed gum. Journal of Food Science and Technology 1–8.
- 15 Rafe, A. and Razavi, S.M.A. (2012). Dynamic viscoelastic study on the gelation of basil seed gum. International Journal of Food Science and Technology 48: 556–563.
- 16 Khazaei, N., Esmaiili, M., Emam Djomeh, Z. et al. (2014). Characterization of new biodegradable edible film made from basil seed (Ocimum basilicum L.) gum. Carbohydrate Polymers 102: 199–206.
- 17 Naji, S., Razavi, S.M.A., and Karazhiyan, H. (2013). Effect of freezing on functional and textural attributes of cress seed gum and xanthan gum. Food and Bioprocess Technology 6 (5): 1302–1311.
- 18 Naji, S. and Razavi, S.M.A. (2014). Functional and textural characteristics of cress seed (Lepidium sativum) gum and xanthan gum: effect of refrigeration condition. Food Bioscience 1–8.
- 19 Naji, S., Razavi, S.M.A., Karazhiyan, H. et al. (2012). Influence of thermal treatments on textural characteristics of cress seed (Lepidium Sativum) gum gel. Electronic Journal of Environmental, Agriculture and Food Chemistry 11 (3): 222–237.
- 20 Farahmandfar, R., Asnaashari, M., Salahi, R., and Khosravi, T. (2017). Effects of basil seed gum, cress seed gum and quince seed gum on the physical, textural and rheological properties of whipped cream. International Journal of Biological Macromolecules 98: 820–828.
- 21 Chen, J.S. (2009). Food oral processing‐a review. Food Hydrocolloids 23 (1): 1–25.
- 22 Hutchings, J.B. and Lillford, P.J. (1988). The perception of food texture e the philosophy of the breakdown path. Journal of Texture Studies 19: 103–115.
- 23 Nishinari, K. (2004). Rheology, food texture and mastication. Journal of Texture Studies 35: 113–124.
- 24 Nishinari, K. (2007). Rheology in food and health. Nihon Reoroji Gakkaishi. Journal of the Society of Rheology 35: 35–47. (in Japanese).
- 25 Stevens, S.S. and Guirao, M. (1964). Scaling of apparent viscosity. Science 144: 1157–1158.
- 26 Koc, H., Vinyard, C.J., Essick, G.K., and Foegeding, E.A. (2013). Food oral processing: conversion of food structure to textural perception. Annual Reviews in. Food Science and Technology 4: 237–266.
- 27 Stieger, M. and van de Velde, F. (2013). Microstructure, texture and oral processing: new ways to reduce sugar and salt in foods. Current Opinion in Colloid Interface Science 18 (4): 334–348.
- 28 van Vliet, T., van Aken, G.A., de Jongh, H.H.J., and Hamer, R.J. (2009). Colloidal aspects of texture perception. Advances in Colloid Interface Science 150 (1): 27–40.
- 29 Prinz, J.F., de Wijk, R.A., and Huntjens, L. (2007). Load dependency of the coefficient of friction of oral mucosa. Food Hydrocolloids 21 (3): 402–408.
- 30 de Wijk, R.A., Prinz, J., and Janssen, A.M. (2006). Explaining perceived oral texture of starch‐based custard desserts from standard and novel instrumental tests. Food Hydrocolloids 20 (1): 24–34.
- 31 Foster, K.D., Grigor, J.M.V., Cheong, J.N. et al. (2011). The role of oral processing in dynamic sensory perception. Journal of Food Science 76 (2): R49–R61.
- 32 Bourne, M.C. (2002). Food Texture and Viscosity: Concept and Measurement. San Diego: Academic Press.
- 33 Kutter, A., Singh, J.P., Rauh, C., and Delgado, A. (2011). Improvement of the prediction of mouthfeel attributes of liquid foods by a posthumous funnel. Journal of Texture Studies 42 (3): 217–227.
- 34 Christensen, C.M. (1979). Oral perception of solution viscosity. Journal of Texture Studies 10 (2): 153–164.
- 35 de Wijk, R.A., van Gemert, L.J., Terpstra, M.E.J., and Wilkinson, C.L. (2003). Texture of semi‐solids; sensory and instrumental measurements on vanilla custard desserts. Food Quality Preferences 14 (4): 305–317.
- 36 Janssen, A.M., Terpstra, M.E.J., De Wijk, R.A., and Prinz, J.F. (2007). Relations between rheological properties, saliva‐induced structure breakdown and sensory texture attributes of custards. Journal of Texture Studies 38 (1): 42–69.
- 37 Stanley, N.L. and Taylor, L.J. (1993). Rheological basis of oral characteristics of fluid and semisolid foods‐a review. Acta Psychology 84 (1): 79–92.
- 38 Prakash, S., Tan, D.D.Y., and Chen, J.S. (2013). Applications of tribology in studying food oral processing and texture perception. Food Research International 54 (2): 1627–1635.
- 39 Engelen, L. and de Wijk, R.A. (2012). Oral processing and texture perception. In: Food Oral Processing (ed. J. Chen and L. Engelen), 157–176. Wiley‐Blackwell.
- 40 Fernández Farrés, I., Moakes, R.J.A., and Norton, I.T. (2014). Designing biopolymer fluid gels: a microstructural approach. Food Hydrocolloids 42: 362–372.
- 41 Stokes, J., Macakova, L., Chojnicka‐Paszun, A. et al. (2011). Lubrication, adsorption, and rheology of aqueous polysaccharide solutions. Langmuir 27 (385): 3474–3484.
- 42 Anvari, M., Tabarsa, M., and Joyner, H.S. (2017). Large amplitude oscillatory shear behavior and tribological properties of gum extracted from Alyssum homolocarpum seed. Food Hydrocolloids https://doi.org/10.1016/j.foodhyd.2017.11.008.
- 43 Anvari, M. and Joyner, H.S. (2017). Effect of fish gelatin and gum Arabic interactions on concentrated emulsion large amplitude oscillatory shear behavior and tribological properties. Food Hydrocolloids https://doi.org/10.1016/j.foodhyd.2017.12.016.
- 44 Nguyen, P.T.M., Kravchuk, O., Bhandari, B., and Prakash, B. (2017). Effect of different hydrocolloids ontexture, rheology, tribology and sensory perception of texture and mouthfeel of low‐fat pot‐set yoghurt. Food Hydrocolloids 72: 90–104.
- 45 Seisun, D. (2010). Introduction. In: Food Stabilisers, Thickeners and Gelling Agents (ed. A. Imeson). Oxford: Blackwell Publishing Ltd.
- 46 Varela, P. and Fiszman, S.M. (2013). Exploring consumers' knowledge and perceptions of hydrocolloids used as food additives and ingredients. Food Hydrocolloids 30: 477–484.
- 47 Ares, G., Giménez, A., and Gámbaro, A. (2008). Understanding consumers' perception of conventional and functional yogurts using word association and hard laddering. Food Quality and Preference 19: 636–643.
- 48 te Nijenhuis, K. and Winter, H.H. (1989). Mechanical properties at the gel point of a crystallizing poly(vinyl chloride) solution. Macromolecules 22: 411–414.
- 49 Martin, J.E. and Adolf, D. (1991). The sol‐gel transition in chemical gel. Annual Reviews of Physical Chemistry 42: 311–339.
- 50 Martin, J.E., Adolf, D., and Wilcoxon, J.P. (1988). Viscoelasticity of near critical gels. Physical Reviews. Letter 61: 2620–2623.
- 51 Lu, A., Wang, Y.X., and Boluk, Y. (2014). Investigation of the scaling law on gelation of oppositely charged nanocrystalline cellulose and polyelectrolyte. Carbohydrate Polymer 105: 214–221.
- 52 Li, L., Uchida, H., Aoki, Y., and Yao, M.L. (1997). Rheological images of poly (vinyl chloride) gels. 2. Divergence of viscosity and the scaling law before the sol‐gel transition. Macromolecules 30: 7842–7848.
- 53 Aoki, Y., Li, L., and Kakiuchi, M. (1998). Rheological images of poly (vinyl chloride) gels. 6. Effect of temperature. Macromolecules 31: 8117–8123.
- 54 Aoki, Y., Li, L., Uchida, H. et al. (1998). Rheological images of poly (vinyl chloride) gels. 5. Effect of molecular weight distribution. Macromolecules 31: 7472–7478.
- 55 Liu, S., Huang, S., and Li, L. (2017). Thermoreversible gelation and viscoelasticity of κ−carrageenan hydrogels. Journal of Rheology 60: 203–214.
- 56 Shih, W.H., Shih, W.Y., Kim, S.I. et al. (1990). Scaling behavior of the elastic properties of colloidal gels. Physical Review. A 42: 4772–4779.
- 57 Wu, H. and Morbidelli, M. (2001). A model relating structure of colloidal gels to their elastic properties. Langmuir 17: 1030–1036.
- 58 Rafe, A. and Razavi, S.M.A. (2017). Scaling law, fractal analysis and rheological characteristics of basil seed gum cross‐linked with sodium trimetaphosphate. Food Hydrocolloids 62: 58–65.
- 59 Hagiwara, T., Kumagai, H., and Matsunaga, T. (1997). Fractal analysis of the elasticity of BSA and β‐Lactoglobulin gels. Journal of Agriculture and Food Chemistry 45: 3807–3812.
- 60 Hagiwara, T., Kumagai, H., and Nakamura, K. (1998). Fractal analysis of aggregates in heat‐induced BSA gels. Food Hydrocolloids 12: 29–36.
- 61 Verheul, M., Roefs, S.P.F.M., Mellema, J., and de Kruif, K.G. (1998). Power law behavior of structural properties of protein gels. Langmuir 14: 2263–2268.
- 62 Ikeda, S., Foegeding, E.A., and Hagiwara, T. (1999). Rheological study on the fractal nature of the protein gel structure. Langmuir 15: 8584–8589.
- 63 Kavanagh, G.M., Clark, A.H., and Ross‐Murphy, S.B. (2000). Heat induced gelation of globular protein. 4. Gelation kinetics of low pH β‐lactoglobulin gels. Langmuir 16: 9584–9594.
- 64 Ould Eleya, M.M. and Gunasekaran, S. (2002). Gelling properties of egg white produced using a conventional and a low‐shear reverse osmosis processes. Journal of Food Science 67: 725–729.
- 65 Ould Eleya, M.M., Ko, S., and Gunasekaran, S. (2004). Scaling and fractal analysis of viscoelastic properties of heat‐induced protein gels. Food Hydrocolloids 18: 315–323.
- 66 Mellema, M., van Vliet, T., and van Opheudsen, J.H.J. (2000). Categorization of rheological scaling models for particle gels. In: Proceedings of the Second International Symposium on Food Rheology and Texture (ed. P. Fischer, I. Marti and E. Windhab). Zurich: ETH.
- 67 Rafe, A., Razavi, S.M.A., and Farhoosh, R. (2013). Rheology and microstructure of basil seed gum and β‐lactoglobulin mixed gels. Food Hydrocolloids 30: 134–142.
- 68 Zhang, L., Liu, Y., Chen, Z., and Liu, P. (2016). Behavior and mechanism of ultralow friction of basil seed gel. Colloids and Surfaces A: Physicochemical Engineering Aspects 489: 454–460.
- 69 Lack, S., Dulong, V., Le Cerf, D. et al. (2004). Hydrogels based on pullulan cross‐linked with sodium trimetaphosphate (STMP): rheological study. Polymer Bulletin 52: 429–436.
- 70 Bremer, L.G.B., Bijsterbosch, B.H., Schrijvers, R. et al. (1990). On the fractal nature of the structure of acid casein gels. Colloids Surface 51: 159–170.
- 71 Vreeker, R., Hoekstra, L.L., den Boer, D.C., and Agterof, A.G.M. (1992). Fractal aggregation of whey proteins. Food Hydrocolloids 6: 423–435.
- 72 Aubert, C. and Cannell, D.S. (1986). Restructuring of colloidal silica aggregates. Physics Review Letters 56: 738–741.
- 73 Weitz, D.A. and Oliveria, M. (1984). Fractal structures formed by kinetic aggregation of aqueous gold colloids. Physical Review Letters 52: 1433–1436.
- 74 Lin, M.Y., Lindsay, H.M., Weitz, D.A. et al. (1989). Universality in colloid aggregation. Nature 339: 360–362.
- 75 Mours, M. and Winter, H.H. (1996). Relaxation patterns of nearly critical gels. Macromolecules 29: 7221–7229.
- 76 de Gennes, P.G. (1979). Scaling Concepts in Polymer Physics. New York: Cornell University.
- 77 Flory, P.J. (1941). Molecular size distribution in three dimensional polymers. I. Gelation. Journal of American Chemist Society 63: 3083–3090.
- 78 Hsu, S.H. and Jamieson, A.M. (1993). Viscoelastic behaviour at the thermal sol‐gel transition of gelatin. Polymer 34: 2602–2608.
- 79 Van den Berg, L., Van Vlieta, T., Van der Linden, E. et al. (2007). Breakdown properties and sensory perception of whey proteins/polysaccharide mixed gels as a function of microstructure. Food Hydrocolloids 21: 961–976.
- 80 Ould Eleya, M.M. and Turgeon, S.L. (2000). Rheology of κ‐carrageenan and β‐lactoglobulin mixed gels. Food Hydrocolloids 14: 29–40.
- 81 Turgeon, S.L. and Beaulieu, M. (2001). Improvement and modification of whey protein gel texture using polysaccharides. Food Hydrocolloids 15: 583–591.
- 82 Hemar, Y., Hall, C.E., Munro, P.A., and Singh, H. (2002). Small and large deformation rheology and microstructure of κ‐carrageenan gels containing commercial milk protein products. International Dairy Journal 12: 371–381.
- 83 Rafe, A., Razavi, S.M.A., and Khan, S. (2012). Rheological and structural properties of β‐lactoglobulin and basil seed gum mixture: effect of heating rate. Food Research International 49: 32–38.
- 84 Stading, M., Langton, M., and Hermansson, A.M. (1993). Microstructure and rheological behavior of particulate β‐lactoglobulin gels. Food Hydrocolloids 7: 195–212.