
CHAPTER 6
MARKET-BASED VALUATION: PRICE AND ENTERPRISE VALUE MULTIPLES
LEARNING OUTCOMES
After completing this chapter, you will be able to do the following:
• Distinguish among types of valuation indicators.
• Distinguish between the method of comparables and the method based on forecasted fundamentals as approaches to using price multiples in valuation.
• Define a justified price multiple.
• Discuss the economic rationales for the method of comparables and the method based on forecasted fundamentals.
• List and discuss rationales for each price multiple and dividend yield in valuation.
• Discuss possible drawbacks to the use of each price multiple and dividend yield.
• Define and calculate each price multiple and dividend yield.
• Define underlying earnings and, given earnings per share (EPS) and nonrecurring items in the income statement, calculate underlying earnings.
• Define normalized EPS, discuss the methods of normalizing EPS, and calculate normalized EPS by each method.
• Explain and justify the use of earnings yield (i.e., EPS divided by share price).
• Identify and discuss the fundamental factors that influence each price multiple and dividend yield.
• Calculate the justified price-to-earnings ratio (P/E), price-to-book ratio, and price-to-sales ratio for a stock, based on forecasted fundamentals.
• Calculate a predicted P/E given a cross-sectional regression on fundamentals and explain limitations to the cross-sectional regression methodology.
• Define the benchmark value of a multiple.
• Evaluate a stock using the method of comparables.
• Discuss the importance of fundamentals in the method of comparables.
• Define and calculate the P/E-to-growth ratio and explain its use in relative valuation.
• Calculate and explain the use of price multiples in determining terminal value in a multistage discounted cash flow model.
• Discuss alternative definitions of cash flow used in price and enterprise value multiples (including enterprise value to earnings before interest, taxes, depreciation, and amortization) and explain the limitations of each.
• Discuss the sources of differences in cross-border valuation comparisons.
• Describe the main types of momentum indicators and their use in valuation.
• Explain the use of stock screens in investment management.
1. INTRODUCTION
Among the most familiar and widely used valuation tools are price and enterprise value multiples. Price multiples are ratios of a stock’s market price to some measure of fundamental value per share. Enterprise value multiples, by contrast, relate the total market value of all sources of a company’s capital to a measure of fundamental value for the entire company.
The intuition behind price multiples is that investors evaluate the price of a share of stock—judge whether it is fairly valued, overvalued, or undervalued—by considering what a share buys in terms of per-share earnings, net assets, cash flow or some other measure of value (stated on a per-share basis). The intuition behind enterprise value multiples is similar; investors evaluate the market value of an entire enterprise relative to the amount of earnings before interest and taxes (EBIT), sales, or operating cash flow it generates. As valuation indicators (measures or indicators of value), multiples have the appealing qualities of simplicity in use and ease in communication. A multiple summarizes in a single number the relationship between the market value of a company’s stock (or of its total capital) and some fundamental quantity, such as earnings, sales, or book value(owners’ equity based on accounting values).
Among the questions we study in this chapter for answers that will help in making correct use of multiples as valuation tools are the following:
• What accounting issues affect particular price and enterprise value multiples, and how can analysts address them?
• How do price multiples relate to fundamentals, such as earnings growth rates, and how can analysts use this information when making valuation comparisons among stocks?
• For which types of valuation problems is a particular price or enterprise value multiple appropriate or inappropriate?
• What challenges arise in applying price and enterprise value multiples internationally?
Multiples may be viewed as valuation indicators relating to individual securities. Another type of valuation indicator used in securities selection is momentum indicators. They typically relate either price or a fundamental (such as earnings) to the time series of its own past values or, in some cases, to its expected value. The logic behind the use of momentum indicators is that such indicators may provide information on future patterns of returns over some time horizon. Because the purpose of momentum indicators is to identify potentially rewarding investment opportunities, they can be viewed as a class of valuation indicators with a focus that is different from and complementary to the focus of price and enterprise value multiples.
This chapter is organized as follows. In Section 2, we put the use of price and enterprise value multiples in an economic context and present certain themes common to the use of any price or enterprise value multiple. Section 3 presents price multiples; a subsection is devoted to each multiple. The treatment of each multiple follows a common format: usage considerations, the relationship of the multiple to investors’ expectations about fundamentals, and using the multiple in valuation based on comparables. Section 4 presents enterprise value multiples and is organized similarly to Section 3. Section 5 presents international considerations in using multiples. A treatment of momentum indicators follows in Section 6. Section 7 discusses several practical issues that arise in using valuation indicators. We summarize the chapter in Section 8, and the chapter concludes with practice problems.
2. PRICE AND ENTERPRISE VALUE MULTIPLES IN VALUATION
In practice, two methods underpin analysts’ use of price and enterprise value multiples: the method of comparables and the method based on forecasted fundamentals. Each of these methods relates to a definite economic rationale. In this section, we introduce the two methods and their associated economic rationales.
2.1. The Method of Comparables
The method of comparables refers to the valuation of an asset based on multiples of comparable (similar) assets—that is, valuation based on multiples benchmarked to the multiples of similar assets. The similar assets may be referred to as the comparables, the comps, or the guideline assets(or in the case of equity valuation, guideline companies). For example, multiplying a benchmark value of the price-to-earnings (P/E) multiple by an estimate of a company’s earnings per share (EPS) provides a quick estimate of the value of the company’s stock that can be compared with the stock’s market price. Equivalently, comparing a stock’s actual price multiple with a relevant benchmark multiple should lead the analyst to the same conclusion on whether the stock is relatively fairly valued, relatively undervalued, or relatively overvalued.
The idea behind price multiples is that a stock’s price cannot be evaluated in isolation. Rather, it needs to be evaluated in relation to what it buys in terms of earnings, net assets, or some other measure of value. Obtained by dividing price by a measure of value per share, a price multiple gives the price to purchase one unit of value in whatever way value is measured. For example, a P/E of 20 means that it takes 20 units of currency (for example, €20) to buy one unit of earnings (for example, €1 of earnings). This scaling of price per share by value per share also makes possible comparisons among various stocks. For example, an investor pays more for a unit of earnings for a stock with a P/E of 25 than for another stock with a P/E of 20. Applying the method of comparables, the analyst would reason that if the securities are otherwise closely similar (if they have similar risk, profit margins, and growth prospects, for example), the security with the P/E of 20 is undervalued relative to the one with the P/E of 25.
The word relative is necessary. An asset may be undervalued relative to a comparison asset or group of assets, and an analyst may thus expect the asset to outperform the comparison asset or assets on a relative basis. If the comparison asset or assets themselves are not efficiently priced, however, the stock may not be undervalued—it could be fairly valued or even overvalued (on an absolute basis, i.e., in relation to its intrinsic value). Example 6-1 presents the method of comparables in its simplest application.
EXAMPLE 6-1 The Method of Comparables at Its Simplest
Company A’s EPS is $1.50. Its closest competitor, Company B, is trading at a P/E of 22. Assume the companies have a similar operating and financial profile.
1. If Company A’s stock is trading at $37.50, what does that indicate about its value relative to Company B?
2. If we assume that Company A’s stock should trade at about the same P/E as Company B’s stock, what will we estimate as an appropriate price for Company A’s stock?
Solution to 1: If Company A’s stock is trading at $37.50, its P/E will be 25 ($37.50 divided by $1.50). If the companies are similar, this P/E would indicate that Company
A is overvalued relative to Company B.
Solution to 2: If we assume that Company A’s stock should trade at about the same P/E as Company B’s stock, we will estimate that an appropriate price for Company A’s stock is $33 ($1.50 times 22).
The method of comparables applies also to enterprise value multiples. In this application, we would evaluate the market value of an entire company in relation to some measure of value relevant to all providers of capital, not only providers of equity capital. For example, multiplying a benchmark multiple of enterprise value (EV) to earnings before interest, taxes, depreciation, and amortization (EBITDA) times an estimate of a company’s EBITDA provides a quick estimate of the value of the entire company. Similarly, comparing a company’s actual enterprise value multiple with a relevant benchmark multiple allows an assessment of whether the company is relatively fairly valued, relatively undervalued, or relatively overvalued.
Many choices for the benchmark value of a multiple have appeared in valuation methodologies, including the multiple of a closely matched individual stock and the average or median value of the multiple for the stock’s industry peer group. The economic rationale underlying the method of comparables is the law of one price—the economic principle that two identical assets should sell at the same price.117 The method of comparables is perhaps the most widely used approach for analysts reporting valuation judgments on the basis of price multiples. For this reason, the use of multiples in valuation is sometimes viewed solely as a type of relative-valuation approach; however, multiples can also be derived from, and expressed in terms of, fundamentals, as discussed in the next section.
2.2. The Method Based on Forecasted Fundamentals
The method based on forecasted fundamentals118refers to the use of multiples that are derived from forecasted fundamentals—characteristics of a business related to profitability, growth, or financial strength. Fundamentals drive cash flows, and we can relate multiples to company fundamentals through a discounted cash flow (DCF) model. Algebraic expressions of price multiples in terms of fundamentals facilitate an examination of how valuation differences among stocks relate to different expectations for those fundamentals. We illustrated this concept in Chapter 3, where we explained P/E in terms of perhaps the simplest DCF model, the Gordon growth dividend discount model, in an expression that includes (among other variables) the expected dividend growth rate.
One process for relating multiples to forecasted fundamentals begins with a valuation based on a DCF model. Recall that DCF models estimate the intrinsic value of a firm or its equity as the present value of expected cash flows, and that fundamentals drive cash flows. Multiples are stated with respect to a single value of a fundamental, but any price or enterprise value multiple relates to the entire future stream of expected cash flows through its DCF value.
We can illustrate this concept by first taking the present value of the stream of expected future cash flows and then expressing the result relative to a forecasted fundamental. For example, if the DCF value of a UK stock is £10.20 and its forecasted EPS is £1.2, the forward P/E multiple consistent with the DCF value is £10.20/£1.2 = 8.5. (The term forward P/E refers to a P/E calculated on the basis of a forecast of EPS and is discussed in further detail later in this chapter.) This exercise of relating a valuation to a price multiple applies to any definition of price multiple and any DCF model or residual income model.119
In summary, we can approach valuation by using multiples from two perspectives. First, we can use the method of comparables, which involves comparing an asset’s multiple to a standard of comparison. Similar assets should sell at similar prices. Second, we can use the method based on forecasted fundamentals, which involves forecasting the company’s fundamentals rather than making comparisons with other companies. The price multiple of an asset should be related to its expected future cash flows. We can also incorporate the insights from the method based on forecasted fundamentals in explaining valuation differences based on comparables, because we seldom (if ever) find exact comparables. In the sections covering each multiple, we present the method based on forecasted fundamentals first so we can refer to it when using the method of comparables.
Using either method, how can an analyst communicate a view about the value of a stock? Of course, the analyst can offer simply a qualitative judgment about whether the stock appears to be fairly valued, overvalued, or undervalued (and offer specific reasons for the view). The analyst may also be more precise by communicating a justified price multiple for the stock. The justified price multiple is the estimated fair value of that multiple, which can be justified on the basis of the method of comparables or the method of forecasted fundamentals.
For an example of a justified multiple based on the method of comparables, suppose we use the price-to-book (P/B) multiple in a valuation and find that the median P/B for the company’s peer group, which would be the standard of comparison, is 2.2.120 The stock’s justified P/B based on the method of comparables is 2.2 (without making any adjustments for differences in fundamentals). We can compare the justified P/B with the actual P/B based on market price to form an opinion about value. If the justified P/B is larger (smaller) than the actual P/B, the stock may be undervalued (overvalued). We can also, on the assumption that the comparison assets are fairly priced, translate the justified P/B based on comparables into an estimate of absolute fair value of the stock. If the current book value per share is $23, then the fair value of the stock is 2.2 x $23 = $50.60, which can be compared with its market price.
For an example of a justified multiple based on fundamentals, suppose that we are using a residual income model and estimate that the value of the stock is $46. Then the justified P/B based on forecasted fundamentals is $46/$23 = 2.0, which we can again compare with the actual value of the stock’s P/B. We can also state our estimate of the stock’s absolute fair value as 2 x $23 = $46. (Note that the analyst could report valuation judgments related to a DCF model in terms of the DCF value directly; price multiples are a familiar form, however, in which to state valuations.) Furthermore, we can incorporate the insights from the method based on fundamentals to explain differences from results based on comparables.
In the next section, we begin a discussion of specific price and enterprise value multiples used in valuation.
3. PRICE MULTIPLES
In this section, we first discuss the most familiar price multiple, the price-to-earnings ratio. In the context of that discussion, we introduce a variety of practical issues that have counterparts for most other multiples. These issues include analyst adjustments to the denominator of the ratio for accuracy and comparability and the use of inverse price multiples. Then we discuss four other major price multiples from the same practical perspective.
3.1. Price to Earnings
In the first edition of Security Analysis(1934, p. 351), Benjamin Graham and David L. Dodd described common stock valuation based on P/Es as the standard method of that era, and the P/E is still the most familiar valuation measure today.
We begin our discussion with rationales offered by analysts for the use of P/E and with the possible drawbacks of its use. We then define the two chief variations of the P/E: the trailing P/E and the forward P/E (also called the leading P/E). The multiple’s numerator, market price, is (as in other multiples) definitely determinable; it presents no special problems of interpretation. But the denominator, EPS, is based on the complex rules of accrual accounting and presents significant interpretation issues. We discuss those issues and the adjustments analysts can make to obtain more meaningful P/Es. Finally, we conclude the section by examining how analysts use P/Es to value a stock using the method of forecasted fundamentals and the method of comparables. As mentioned earlier, we discuss fundamentals first so that we can draw insights from that discussion when using comparables.
Several rationales support the use of P/E multiples in valuation:
• Earning power is a chief driver of investment value, and EPS, the denominator in the P/E ratio, is perhaps the chief focus of security analysts’ attention.121 In a 2007 survey of CFA Institute members, P/E ranked first among price multiples used in market-based valuation.122
• The P/E ratio is widely recognized and used by investors.
• Differences in stocks’ P/Es may be related to differences in long-run average returns on investments in those stocks, according to empirical research.123
Potential drawbacks to using P/Es derive from the characteristics of EPS:
• EPS can be zero, negative, or insignificantly small relative to price, and P/E does not make economic sense with a zero, negative, or insignificantly small denominator.
• The ongoing or recurring components of earnings that are most important in determining intrinsic value can be practically difficult to distinguish from transient components.
• The application of accounting standards requires corporate managers to choose among acceptable alternatives and to use estimates in reporting. In making such choices and estimates, managers may distort EPS as an accurate reflection of economic performance. Such distortions may affect the comparability of P/Es among companies.
Methods to address these potential drawbacks are discussed later in the chapter. In the next section, we discuss alternative definitions of P/E based on alternative specifications of earnings.
3.1.1. Alternative Definitions of P/E
In calculating a P/E, the numerator most commonly used is the current price of the common stock, which is generally easily obtained and unambiguous for publicly traded companies. Selecting the appropriate EPS figure to be used in the denominator is not as straightforward. The following two issues must be considered:
1. The time horizon over which earnings are measured, which results in alternative definitions of P/E.
2. Adjustments to accounting earnings that the analyst may make so that P/Es for various companies can be compared.
Common alternative definitions of P/E are trailing P/E and forward P/E.
• A stock’s trailing P/E(sometimes referred to as a current P/E124) is its current market price divided by the most recent four quarters’ EPS. In such calculations, EPS is sometimes referred to as “trailing 12 month (TTM) EPS.”
• The forward P/E(also called the leading P/E or prospective P/E) is a stock’s current price divided by next year’s expected earnings. Trailing P/E is the P/E usually presented first in stock profiles that appear in financial databases, but most databases also provide the forward P/E. In practice, the forward P/E has a number of important variations that depend on how “next year” is defined, as discussed in Section 3.1.3.
Other names and time-horizon definitions for P/E exist. For example, Thomson First Call125 provides various P/Es, including ratios that have as the denominator a stock’s trailing twelve months EPS, last reported annual EPS, and EPS forecasted for one year to three years ahead. Another example is Value Line’s company reports which display a median P/E, which is a rounded average of the four middle values of the range of annual average P/Es over the past 10 years.
In using the P/E, an analyst should apply the same definition to all companies and time periods under examination. Otherwise, the P/Es are not comparable, for a given company over time or for various companies at a specific point in time. One reason is that the differences in P/Es calculated by different methods may be systematic (as opposed to random). For example, for companies with rising earnings, the forward P/E will be smaller than the trailing P/E because the denominator in the forward P/E calculation will be larger.
Valuation is a forward-looking process, so analysts usually focus on the forward P/E when earnings forecasts are available. For large public companies, an analyst can develop earnings forecasts and/or obtain consensus earnings forecasts from a commercial database. When earnings are not readily predictable, however, a trailing P/E (or another valuation metric) may be more appropriate than forward P/E. Furthermore, logic sometimes indicates that a particular definition of the P/E is not relevant. For example, a major acquisition or divestiture or a significant change in financial leverage may change a company’s operating or financial risk so much that the trailing P/E based on past EPS is not informative about the future and thus not relevant to a valuation. In such a case, the forward P/E is the appropriate measure. In the following sections, we address issues that arise in calculating trailing and forward P/Es.
Trailing P/Es and forward P/Es are based on a single year’s EPS. If that number is negative or viewed as unrepresentative of a company’s earning power, however, an analyst may base the P/E calculation on a longer-run expected average EPS value. P/Es based on such normalized EPS data may be called normalized P/Es. Because the denominators in normalized P/Es are typically based on historical information, they are covered in the section on calculating the trailing P/E.
3.1.2. Calculating the Trailing P/E
When using trailing earnings to calculate a P/E, the analyst must take care in determining the EPS to be used in the denominator. The analyst must consider the following:
• Potential dilution of EPS.126
• Transitory, nonrecurring components of earnings that are company specific.
• Transitory components of earnings ascribable to cyclicality (business or industry cyclicality).
• Differences in accounting methods (when different companies’ stocks are being compared).
Among the considerations mentioned, potential dilution of EPS generally makes the least demands on analysts’ accounting expertise because companies are themselves required to present both basic EPS and diluted EPS. Basic earnings per share data reflect total earnings divided by the weighted average number of shares actually outstanding during the period. Diluted earnings per share reflects division by the number of shares that would be outstanding if holders of securities such as executive stock options, equity warrants, and convertible bonds exercised their options to obtain common stock. The diluted EPS measure also reflects the effect of such conversion on the numerator, earnings.127 Because companies present both EPS numbers, the analyst does not need to make the computation. Companies also typically report details of the EPS computation in a footnote to the financial statements. Example 6-2, illustrating the first bullet point, shows the typical case in which the P/E based on diluted EPS is higher than the P/E based on basic EPS.
EXAMPLE 6-2 Basic versus Diluted EPS
For the fiscal year ended 31 December 2007, WPP Group PLC (London: WPP) reported basic EPS of £39.6 and diluted EPS of £38.0. Based on a closing stock price of £596.5 on 29 February 2008, the day on which the company issued its earnings press release, WPP’s trailing P/E is 15.1 if basic EPS is used and 15.7 if diluted EPS is used.
When comparing companies, analysts generally prefer to use diluted EPS so that the EPS of companies with differing amounts of dilutive securities are on a comparable basis. The other bulleted considerations frequently lead to analyst adjustments to reported earnings numbers and are discussed in order next.
3.1.2.1. Analyst Adjustments for Nonrecurring Items
Items in earnings that are not expected to recur in the future are generally removed by analysts because valuation concentrates on future cash flows. The analyst’s focus is on estimating underlying earnings(other names for this concept include persistent earnings, continuing earnings, and core earnings)—that is, earnings that exclude nonrecurring items. An increase in underlying earnings reflects an increase in earnings that the analyst expects to persist into the future. Companies may disclose adjusted earnings, which may be called non-IFRS (not reportable under International Financial Reporting Standards) earnings, non-GAAP (not reportable under U.S. generally accepted accounting principles) earnings, pro forma earnings, adjusted earnings, or, as in Example 6-3, core earnings. All of these terms indicate that the earnings number differs in some way from that presented in conformity with accounting standards. Example 6-3 shows the calculation of EPS and P/E before and after analyst adjustments for nonrecurring items.
EXAMPLE 6-3 Calculating Trailing 12 Months EPS and Adjusting EPS for Nonrecurring Items
You are calculating a trailing P/E for AstraZeneca PLC (NYSE, LSE: AZN) as of 24 April 2008, when the share price closed at $41.95 in New York (£21.19 in London). In its first quarter of 2008, ended 31 March, AZN reported EPS according to IFRS of $1.03, which included $0.06 of restructuring costs, $0.07 of amortization of intangibles arising from acquisitions, and $0.12 of impairment charges taken to reflect the egative impact of a competing generic product on the value of one of the company’s patented products. Adjusting for all of these items, AZN reported core EPS of $1.28 for the first quarter of 2008, compared with core EPS of $1.07 for the first quarter of 2007. Because the core EPS differed from the EPS calculated under IFRS, the company provided a reconciliation of the two EPS figures.
Other data for AZN as of April 2008 are given in the following table. The trailing 12 months EPS includes one quarter in 2008 and three quarters in 2007.
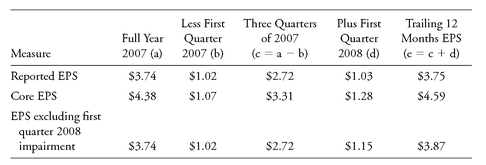
Based on the table and information about AZN, address the following:
1. Based on the company’s reported EPS, determine the trailing P/E of AZN as of 24 April 2008.
2. Determine the trailing P/E of AZN as of 24 April 2008 using core earnings as determined by AZN.
Suppose you expect the amortization charges to continue for some years and note that, although AZN excluded restructuring charges from its core earnings calculation, AZN has reported restructuring charges in previous years. After reviewing all relevant data, you conclude that, in this instance only, the asset impairment should be viewed as clearly nonrecurring.
3. Determine the trailing P/E based on your adjustment to EPS.
Solution to 1: Based on reported EPS and without any adjustments for nonrecurring items, the trailing P/E is $41.95/$3.75 = 11.2.
Solution to 2: Using the company’s reported core earnings, you find that the trailing EPS would be $4.59 and the trailing P/E would be $41.95/$4.59 = 9.1.
Solution to 3: The trailing EPS excluding only what you consider to be nonrecurring items is $3.87 and the trailing P/E on that basis is $41.95/$3.87 = 10.8.
Example 6-3 makes several important points:
• By any of its various names, underlying earnings or core earnings is a non-IFRS concept without prescribed rules for its calculation.
• An analyst’s calculation of underlying earnings may well differ from that of the company supplying the earnings numbers. Company-reported core earnings may not be comparable among companies because of differing bases of calculation. Analysts should thus always carefully examine the calculation and, generally, should not rely on such company-reported core earnings numbers.
• In general, the P/E that an analyst uses in valuation should reflect the analyst’s judgment about the company’s underlying earnings and should be calculated on a consistent basis among all stocks under review.
The identification of nonrecurring items often requires detailed work—in particular, examination of the income statement, the footnotes to the income statement, and the management discussion and analysis section. The analyst cannot rely on income statement classifications alone to identify nonrecurring components of earnings. Nonrecurring items (for example, gains and losses from the sale of assets, asset write-downs, goodwill impairment, provisions for future losses, and changes in accounting estimates) often appear in the income from continuing operations portion of a business’s income statement.128 An analyst may decide not to exclude income/loss from discontinued operations when assets released from discontinued operations are redirected back into the company’s earnings base. An analyst who takes income statement classifications at face value may draw incorrect conclusions in a valuation.
This discussion does not exhaust the analysis that may be necessary to distinguish earnings components that are expected to persist into the future from those that are not. For example, earnings may be decomposed into cash flow and accrual components.129 The broad implication of research is that the cash flow component of earnings should receive a greater weight than the accrual component of earnings in valuation (see Richardson and Tuna 2009). And analysts may attempt to reflect that conclusion in the earnings used in calculating P/Es.
3.1.2.2. Analyst Adjustments for Business-Cycle Influences
In addition to company-specific effects, such as restructuring costs, transitory effects on earnings can come from business-cycle or industry-cycle influences. These effects are somewhat different from company-specific effects. Because business cycles repeat, business-cycle effects, although transitory, can be expected to recur in subsequent cycles.
Because of cyclical effects, the most recent four quarters of earnings may not accurately reflect the average or long-term earning power of the business, particularly for cyclical businesses—those with high sensitivity to business- or industry-cycle influences, such as automobile and steel manufacturers. The trailing EPS for such stocks is often depressed or negative at the bottom of a cycle and unusually high at the top of a cycle. Empirically, P/Es for cyclical companies are often highly volatile over a cycle even without any change in business prospects: High P/Es on depressed EPS at the bottom of the cycle and low P/Es on unusually high EPS at the top of the cycle reflect the countercyclical property of P/Es known as the Molodovsky effect.130Analysts address this problem by normalizing EPS—that is, estimating the level of EPS that the business could be expected to achieve under mid-cyclical conditions (normalized EPS or normal EPS).131Two of several available methods to calculate normalized EPS are as follows:
1. The method of historical average EPS, in which normalized EPS is calculated as average EPS over the most recent full cycle.
2. The method of average return on equity, in which normalized EPS is calculated as the average return on equity (ROE) from the most recent full cycle, multiplied by current book value per share.
The first method is one of several possible statistical approaches to the problem of cyclical earnings; however, this method does not account for changes in a business’s size. The second alternative, by using recent book value per share, reflects more accurately the effect on EPS of growth or shrinkage in the company’s size. For that reason, the method of average ROE is sometimes preferred.132 When reported current book value does not adequately reflect company size in relation to past values (because of items such as large write-downs), the analyst can make appropriate accounting adjustments. The analyst can also estimate normalized earnings by multiplying total assets by an estimate of the long-run return on total assets133 or by multiplying shareholders’ equity by an estimate of the long-run return on total shareholders ’ equity. These methods are particularly useful for a period in which a cyclical company has reported a loss.
Example 6-4 illustrates this concept. The example uses data for an American Depositary Receipt(ADR) but is applicable to any equity security. An ADR is intended to facilitate U.S. investment in non-U.S. companies. It is a negotiable certificate issued by a depositary bank that represents ownership in a non-U.S. company’s deposited equity (i.e., equity held in custody by the depositary bank in the company’s home market). One ADR may represent more than one, or fewer than one, deposited share. The number of, or fraction of, deposited securities represented by one ADR is referred to as the ADR ratio.
EXAMPLE 6-4 Normalizing EPS for Business-Cycle Effects
You are researching the valuation of Taiwan Semiconductor Manufacturing Company (NYSE: TSM, TAIEX: 2330), the world’s largest dedicated semiconductor foundry (www.tsmc.com). Your research is for a U.S. investor who is interested in the company’s ADRs rather than the company’s shares listed on the Taiwan Stock Exchange. On 28 February 2008, the closing price of TSM, the NYSE listed ADR, was $10.01. The semiconductor industry is notably cyclical, so you decide to normalize earnings as part of your analysis. You believe that data from 2001 reasonably captures the beginning of the most recent business cycle, and you want to evaluate a normalized P/E. Exhibit 6-1 supplies data on EPS for one TSM ADR, book value per share (BVPS) for one ADR, and the company’s ROE.134
EXHIBIT 6-1 Taiwan Semiconductor Manufacturing Company (currency in U.S. dollars)
Source: Value Line Investment Survey.
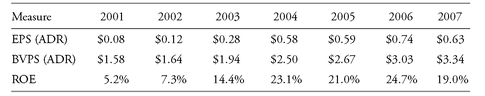
Using the data in Exhibit 6-1:
1. Calculate a normalized EPS for TSM by the method of historical average EPS and then calculate the P/E based on that estimate of normalized EPS.
2. Calculate a normalized EPS for TSM by the method of average ROE and the P/E based on that estimate of normalized EPS.
3. Explain the source of the differences in the normalized EPS calculated by the two methods, and contrast the impact on the estimate of a normalized P/E.
Solution to 1: Averaging EPS over the 2001-2007 period, you would find it to be ($0.08 + $0.12 + $0.28 + $0.58 + $0.59 + $0.74 + 0.63)/7 = $0.43. Thus, according to the method of historical average EPS, TSM’s normalized EPS is $0.43. The P/E based on this estimate is $10.01/$0.43 = 23.3.
Solution to 2: Average ROE over the 2001-2007 period is (5.2% + 7.3% + 14.4% + 23.1% + 21.0% + 24.7% + 19.0%)/7 = 16.39%. Based on the current BVPS of $3.34, the method of average ROE gives 0.1639 x $3.34 = $0.55 as normalized EPS. The P/E based on this estimate is $10.01/$0.55 = 18.2.
Solution to 3: From 2001 to 2007, BVPS increased from $1.58 to $3.34, an increase of about 111 percent. The estimate of normalized EPS of $0.55 from the average ROE method reflects the use of information on the current size of the company better than does the $0.43 calculated from the historical average EPS method. Because of that difference, TSM appears more conservatively valued (as indicated by a lower P/E) when the method based on average ROE is used.
3.1.2.3. Analyst Adjustments for Comparability with Other Companies
Analysts adjust EPS for differences in accounting methods between the company and other companies with which it is being compared so that the P/Es will be comparable. For example, if an analyst is comparing a company that uses the last-in, first-out (LIFO) method of inventory accounting as permitted by U.S. GAAP (but not by IFRS) with another company that uses the first-in, first-out (FIFO) method, the analyst should adjust earnings to provide comparability in all ratio and valuation analyses. In general, any adjustment made to a company’s reported financials for purposes of financial statement analysis should be incorporated into an analysis of P/E and other multiples.
3.1.2.4. Dealing with Extremely Low, Zero, or Negative Earnings
Having addressed the challenges that arise in calculating P/E because of nonrecurring items, business-cycle influences, and for comparability among companies, we present in this section the methods analysts have developed for dealing with extremely low, zero, or negative earnings.
Stock selection disciplines that use P/Es or other price multiples often involve ranking stocks from highest value of the multiple to lowest value of the multiple. The security with the lowest positive P/E has the lowest purchase cost per currency unit of earnings among the securities ranked. Zero earnings and negative earnings pose a problem if the analyst wishes to use P/E as the valuation metric. Because division by zero is undefined, P/Es cannot be calculated for zero earnings.
A P/E can technically be calculated in the case of negative earnings. Negative earnings, however, result in a negative P/E. A negative-P/E security will rank below the lowest positive-P /E security but, because earnings are negative, the negative-P/E security is actually the most costly in terms of earnings purchased. Thus, negative P/Es are not meaningful.
In some cases, an analyst might handle negative EPS by using normalized EPS instead. Also, when trailing EPS is negative, the year-ahead EPS and thus the forward P/E may be positive. An argument in favor of either of these approaches based on positive earnings is that if a company is appropriately treated as a going concern, losses cannot be the usual operating result.
If the analyst is interested in a ranking, however, one solution (applicable to any ratio involving a quantity that can be negative or zero) is the use of an inverse price ratio—that is, the reciprocal of the original ratio, which places price in the denominator. The use of inverse price multiples addresses the issue of consistent ranking because price is never negative. 135 In the case of the P/E, the inverse price ratio is earnings to price (E/P), known as the earnings yield. Ranked by earnings yield from highest to lowest, the securities are correctly ranked from cheapest to most costly in terms of the amount of earnings one unit of currency buys.
Exhibit 6-2 illustrates these points for a group of beer companies, two of which have negative EPS. When reporting a P/E based on negative earnings, analysts should report such P/Es as “NM” (not meaningful).
EXHIBIT 6-2 P/E and E/P for Five Beer Companies (as of 16 June 2008; in U.S. Dollars)
Source: Yahoo! Finance.
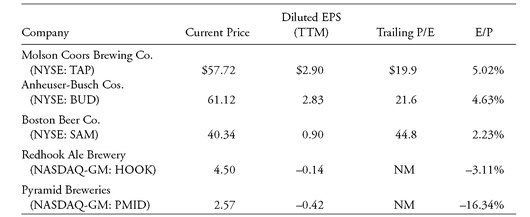
In addition to zero and negative earnings, extremely low earnings can pose problems when using P/Es—particularly for evaluating the distribution of P/Es of a group of stocks under review. In this case, again, inverse price ratios can be useful. The P/E of a stock with extremely low earnings may, nevertheless, be extremely high because an earnings rebound is anticipated. An extremely high P/E—an outlier P/E—can swamp the effect of the other P/Es in the calculation of the mean P/E. Although the use of median P/Es and other techniques can mitigate the problem of skewness caused by outliers, the distribution of inverse price ratios is inherently less susceptible to outlier-induced skewness.
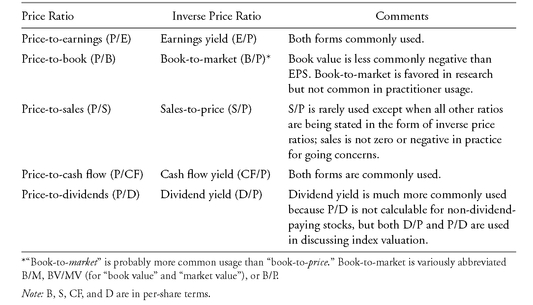
As mentioned, earnings yield is but one example of an inverse price ratio—that is, the reciprocal of a price ratio. Exhibit 6-3 summarizes inverse price ratios for all the price ratios we discuss in this chapter.
EXHIBIT 6-3 Summary of Price and Inverse Price Ratios
3.1.3. Forward P/E
The forward P/E is a major and logical alternative to the trailing P/E because valuation is naturally forward looking. In the definition of forward P/E, analysts have interpreted “next year’s expected earnings” as expected EPS for either (1) the next four quarters, (2) the next 12 months, or (3) the next fiscal year.
In this section, unless otherwise stated, we use the first definition of forward P/E (i.e., the next four quarters), which is closest to how cash flows are dated in our discussion of DCF valuation.136 To illustrate the calculation, suppose the current market price of a stock is $15 as of 1 March 2008 and the most recently reported quarterly EPS (for the quarter ended 31 December 2007) is $0.22. Our forecasts of EPS are as follows:
• $0.15 for the quarter ending 31 March 2008.
• $0.18 for the quarter ending 30 June 2008.
• $0.18 for the quarter ending 30 September 2008.
• $0.24 for the quarter ending 31 December 2008.
The sum of the forecasts for the next four quarters is $0.15 + $0.18 + $0.18 + $0.24 = $0.75, and the forward P/E for this stock is $15/$0.75 = 20.0.
Another important concept related to the forward P/E is the next 12 months (NTM) P/E, which corresponds in a forward-looking sense to the TTM P/E concept of trailing P/E. A stock’s NTM P/E is its current market price divided by an estimated next 12 months EPS, which typically combines the annual EPS estimates from two fiscal years, weighted to reflect the relative proximity of the fiscal year. For example, assume that in August 2008, an analyst is looking at Microsoft Corporation (NASDAQ-GS: MSFT). Microsoft has a June fiscal year-end, so at the time of the analyst’s scrutiny, there were 10 months remaining until the end of the company’s 2009 fiscal year (i.e., September 2008 through June 2009, inclusive). The estimated next 12 months EPS for Microsoft would be calculated as [(10/12) x FY09E EPS] + [(2/12) x FY10E EPS]. NTM P/E is useful because it facilitates comparison of companies with different fiscal year-ends without the need to use quarterly estimates, which for many companies are not available.
Applying the fiscal-year concept, Thomson First Call reports a stock’s forward P/E in two ways: first, based on the mean of analysts’ current fiscal year(FY1 = fiscal year 1) forecasts, for which analysts may have actual EPS in hand for some quarters; second, based on analysts’ following fiscal year(FY2 = fiscal year 2) forecasts, which must be based entirely on forecasts. For Thomson First Call, forward P/E contrasts with current P/E, which is based on the last reported annual EPS.
Clearly, analysts must be consistent in the definition of forward P/E when comparing stocks. Examples 6-5 and 6-6 illustrate two ways of calculating forward P/E.
EXAMPLE 6-5 Calculating a Forward P/E (1)
A market price for the common stock of IBM (NYSE: IBM) in mid-June 2008 was $126.15. IBM’s fiscal year coincides with the calendar year. According to data from Thomson First Call, the consensus EPS forecast for 2008 (FY1) as of June 2008 was $8.54. The consensus EPS forecast for 2009 (FY2) as of June 2008 was $9.59.
1. Calculate IBM’s forward P/E based on a fiscal-year definition per Thomson First Call and FY1 consensus forecasted EPS.
2. Calculate IBM’s forward P/E based on a fiscal-year definition and FY2 consensus forecasted EPS.
Solution to 1: IBM’s forward P/E is $126.15/$8.54 = 14.8 based on FY1 forecasted EPS. Note that this EPS number involves the forecast of three remaining quarters as of mid-June 2008. Solution to 2: IBM’s forward P/E is $126.15/$9.59 = 13.2 based on FY2 forecasted EPS.
In Example 6-5, the company’s EPS was expected to increase by slightly more than 12 percent, so the forward P/Es based on the two different EPS specifications differed from one another somewhat but not dramatically. Example 6-6 presents the calculation of forward P/Es for a company with volatile earnings.
EXAMPLE 6-6 Calculating a Forward P/E (2)
In this example, we use alternative definitions of forward to compute forward P/Es. Exhibit 6-4 presents actual and forecasted EPS for Alcatel-Lucent (Euronext Paris: ALU; NYSE: ALU), a telecommunications equipment manufacturer formed by the merger of a French company (Alcatel) with a U.S. company (Lucent). ALU is based in France. The company’s ADRs trade on the NYSE. The company’s recent results reflect a slowdown in equipment purchases by many telecom operators and the incurring of additional expenses related to integrating operations following the merger.
EXHIBIT 6-4 Quarterly EPS for Alcatel-Lucent ADR (in U.S. dollars; excluding nonrecurring items)
Source : Value Line Investment Survey.
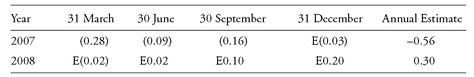
On 21 November 2007, the company’s ADRs closed at $7.37. ALU’s fiscal year ends on 31 December. As of 21 November 2007, solve the following problems by using the information in Exhibit 6-4:
1. Calculate ALU’s forward P/E based on the next four quarters of forecasted EPS.
2. Calculate ALU’s NTM P/E.
3. Calculate ALU’s forward P/E based on a fiscal-year definition and current fiscal year (2007) forecasted EPS.
4. Calculate ALU’s forward P/E based on a fiscal-year definition and next fiscal year (2008) forecasted EPS.
Solution to 1: We sum forecasted EPS as follows:
| 4Q:2007 EPS (estimate) | ($0.03) |
| 1Q:2008 EPS (estimate) | ($0.02) |
| 2Q:2008 EPS (estimate) | $0.02 |
| 3Q:2008 EPS (estimate) | $0.10 |
| Sum | $0.07 |
The forward P/E by this definition is $7.37/$0.07 = 105.3.
Solution to 2: As of 21 November 2007, approximately one month remained in FY2007. Therefore, the estimated next 12 months EPS for ALU would be based on annual estimates in the last column of Exhibit 6-4: [(1/12) x FY07E EPS] + [(11/12) x FY08E EPS] = (1/12)(-0.56) + (11/12)(0.30) = 0.228. The NTM P/E would be $7.37/0.228 = 32.3.
Solution to 3: We sum EPS as follows:
| 1Q:2007 EPS (actual) | ($0.28) |
| 2Q:2007 EPS (actual) | ($0.09) |
| 3Q:2007 EPS (actual) | ($0.16) |
| 4Q:2007 EPS (estimate) | ($0.03) |
| Sum | ($0.56) |
The forward P/E is $7.37/($0.56) = -13.2, which is not meaningful. Note that because this example assumes that financial results for 9 of the 12 months of the fiscal year have been reported, this forward P/E is nearly the same as a trailing P/E.
Solution to 4: We sum EPS as follows:
| 1Q:2008 EPS (estimate) | ($0.02) |
| 2Q:2008 EPS (estimate) | $0.02 |
| 3Q:2008 EPS (estimate) | $0.10 |
| 4Q:2008 EPS (estimate) | $0.20 |
| Sum | $0.30 |
The forward P/E by this definition is $7.37/$0.30 = 24.6.
As illustrated in Example 6-6, for companies with volatile earnings, forward P/Es and thus valuations based on forward P/Es can vary dramatically depending on the definition of earnings. The analyst would probably be justified in normalizing EPS for the Alcatel-Lucent ADR.
Having explored the issues involved in calculating P/Es, we turn to using them in valuation.
3.1.4. Valuation Based on Forecasted Fundamentals
The analyst who understands DCF valuation models can use them not only in developing an estimate of the justified P/E for a stock but also to gain insight into possible sources of valuation differences when the method of comparables is used. Linking P/Es to a DCF model helps us address what value the market should place on a dollar of EPS when we are given a particular set of expectations about the company’s profitability, growth, and cost of capital.
3.1.4.1. Justified P/E
The simplest of all DCF models is the Gordon (constant) growth form of the dividend discount model (DDM). Presentations of discounted dividend valuation commonly show that the P/E of a share can be related to the value of a stock as calculated in the Gordon growth model through the expressions
 for the forward P/E, and for the trailing P/E,
(6-2)
where
P = price
E = earnings
D = dividends
r = required rate of return g = dividend growth rate b = retention rate
Under the assumption of constant dividend growth, the first expression gives the justified forward P/E and the second gives the justified trailing P/E. Note that both expressions state P/E as a function of two fundamentals: the stock’s required rate of return, r, which reflects its risk, and the expected (stable) dividend growth rate, g. The dividend payout ratio, 1 - b, also enters into the expressions.
A particular value of the P/E is associated with a set of forecasts of the fundamentals and the dividend payout ratio. This value is the stock’s justified P/E based on forecasted fundamentals (that is, the P/E justified by fundamentals). All else being equal, the higher the expected dividend growth rate or the lower the stock’s required rate of return, the higher the stock’s intrinsic value and the higher its justified P/E.
This intuition carries over to more-complex DCF models. Using any DCF model, all else being equal, justified P/E is
• Inversely related to the stock’s required rate of return.
• Positively related to the growth rate(s) of future expected cash flows, however defined.
We illustrate the calculation of a justified forward P/E in Example 6-7.
EXAMPLE 6-7 Forward P/E Based on Fundamental Forecasts (1)
BP p.l.c. (London: BP) is one of the world’s largest integrated oil producers. Jan Unger,
an energy analyst, forecasts a long-term earnings retention rate, b, for BP of 15 percent and a long-term growth rate of 6 percent. Unger also calculates a required rate of return of 9.5 percent. Based on Unger’s forecasts of fundamentals and Equation 6-1, BP’s justified forward P/E is
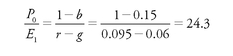
When using a complex DCF model to value the stock (e.g., a model with varying growth rates and varying assumptions about dividends), the analyst may not be able to express the P/E as a function of fundamental, constant variables. In such cases, the analyst can still calculate a justified P/E by dividing the value per share (that results from a DCF model) by estimated EPS, as illustrated in Example 6 -8. Approaches similar to this one can be used to develop other justified multiples.
EXAMPLE 6-8 Forward P/E Based on Fundamental Forecasts (2)
Toyota Motor Corporation (TYO: 7203; NYSE: TM) is one of the world’s largest vehicle manufacturers. The company’s most recent fiscal year ended on 31 March 2008. In early May 2008, you are valuing Toyota stock, which closed at ¥5,480 on the previous day. You have used a free cash flow to equity (FCFE) model to value the company stock and have obtained a value of ¥6,122 for the stock. For ease of communication, you want to express your valuation in terms of a forward P/E based on your forecasted fiscal year 2009 EPS of ¥580. Toyota’s fiscal year 2009 is from April 2008 through March 2009.
1. What is Toyota’s justified P/E based on forecasted fundamentals?
2. Based on a comparison of the current price of ¥5,480 with your estimated intrinsic value of ¥6,122, the stock appears to be slightly undervalued. Use your answer to question 1 to state this evaluation in terms of P/Es.
Solution to 1:
Value of the stock derived from FCFE = ¥6,122
Forecasted EPS = ¥580 ¥6,122/¥580 = 10.6 is the justified forward P/E.
Solution to 2: The justified P/E of 10.6 is slightly higher than the forward P/E based on current market price, ¥5,480/¥580 = 9.4.
The next section illustrates another, but less commonly used, approach to relating price multiples to fundamentals.
3.1.4.2. Predicted P/E Based on Cross-Sectional Regression
A predicted P/E, which is conceptually similar to a justified P/E, can be estimated from cross-sectional regressions of P/E on the fundamentals believed to drive security valuation. Kisor and Whitbeck (1963) and Malkiel and Cragg (1970) pioneered this approach. The studies measured P/Es for a group of stocks and the characteristics thought to determine P/E: growth rate in earnings, payout ratio, and a measure of volatility, such as standard deviation of earnings changes or beta. An analyst can conduct such cross-sectional regressions by using any set of explanatory variables considered to determine investment value; the analyst must bear in mind, however, potential distortions that can be introduced by multicollinearity among independent variables. Example 6-9 illustrates the prediction of P/E using cross-sectional regression.
EXAMPLE 6-9 Predicted P/E Based on a Cross-Sectional Regression
You are valuing a food company with a beta of 0.9, a dividend payout ratio of 0.45, and an earnings growth rate of 0.08. The estimated regression for a group of other stocks in the same industry is
where
DPR = dividend payout ratio EGR = five-year earnings growth rate
1. Based on this cross-sectional regression, what is the predicted P/E for the food company?
2. If the stock’s actual trailing P/E is 18, is the stock fairly valued, overvalued, or undervalued?
Solution to 1: Predicted P/E = 12.12 + (2.25 x 0.45) - (0.20 x 0.9) + (14.43 x 0.08) = 14.1. The predicted P/E is 14.1.
Solution to 2: Because the predicted P/E of 14.1 is less than the actual P/E of 18, the stock appears to be overvalued. That is, it is selling at a higher multiple than is justified by its fundamentals.
A cross-sectional regression summarizes a large amount of data in a single equation and can provide a useful additional perspective on a valuation. It is not frequently used as a main tool, however, because it is subject to at least two limitations:
1. The method captures valuation relationships only for the specific stock (or sample of stocks) over a particular time period. The predictive power of the regression for a different stock and different time period is not known.
2. The regression coefficients and explanatory power of the regressions tend to change substantially over a number of years. The relationships between P/E and fundamentals may thus change over time. Empirical evidence based on data for 1987-1991 suggest that the relationships between P/Es and such characteristics as earnings growth, dividend payout, and beta are not stable over time. Furthermore, because distributions of multiples change over time, the predictive power of results from a regression at any point in time can be expected to diminish with the passage of time (Damodaran 2006).
Because regressions based on this method are prone to the problem of multicollinearity (correlation within linear combinations of the independent variables), interpreting individual regression coefficients is difficult.
Overall, rather than examining the relationship between a stock’s P/E multiple and economic variables, the bulk of capital market research examines the relationship between companies’ stock prices (and returns on the stock) and explanatory variables, one of which is often earnings (or unexpected earnings). A classic example of such research is the Fama and French (1992) study showing that, used alone, a number of factors explained cross-sectional stock returns in the 1963-1990 period; the factors were E/P, size, leverage, and the book -to-market multiples. When these variables were used in combination, however, size and book-to-market had explanatory power that absorbed the roles of the other variables in explaining cross-sectional stock returns. Research building on that study eventually resulted in the Fama-French three-factor model (with the factors of size, book-to-market, and beta). Another classic academic study providing evidence that accounting variables appear to have predictive power for stock returns is Lakonishok, Shleifer, and Vishny (1994), which also provided evidence that value strategies—buying stocks with low prices relative to earnings, book value, cash flow, and sales growth—produced superior five-year buy-and-hold returns in the 1968-1990 period without involving greater fundamental risk than a strategy of buying growth stocks.
3.1.5. Valuation Based on Comparables
The most common application of the P/E approach to valuation is to estimate the value of a company’s stock by applying a benchmark multiple to the company’s actual or forecasted earnings. An essentially equivalent approach is to compare a stock’s actual price multiple with a benchmark value of the multiple. This section explores these comparisons for P/Es. Using any multiple in the method of comparables involves the following steps:
• Select and calculate the price multiple that will be used in the comparison.
• Select the comparison asset or assets and calculate the value of the multiple for the comparison asset(s). For a group of comparison assets, calculate a median or mean value of the multiple for the assets. The result in either case is the benchmark value of the multiple.
• Use the benchmark value of the multiple, possibly subjectively adjusted for differences in fundamentals, to estimate the value of a company’s stock. (Equivalently, compare the subject stock’s actual multiple with the benchmark value.)
• When feasible, assess whether differences between the estimated value of the company’s stock and the current price of the company’s stock are explained by differences in the fundamental determinants of the price multiple and modify conclusions about relative valuation accordingly. (An essentially equivalent approach is to assess whether differences between a company’s actual multiple and the benchmark value of the multiple can be explained by differences in fundamentals.)
These bullet points provide the structure for this chapter’s presentation of the method of comparables. The first price multiple that will be used in the comparison is the P/E. Practitioners’ choices for the comparison assets and the benchmark value of the P/E derived from these assets include the following:
• The average or median value of the P/E for the company’s peer group of companies within an industry, including an average past value of the P/E for the stock relative to this peer group.
• The average or median value of the P/E for the company’s industry or sector, including an average past value of the P/E for the stock relative to the industry or sector.
• The P/E for a representative equity index, including an average past value of the P/E for the stock relative to the equity index.
• An average past value of the P/E for the stock.
To illustrate the first bullet point, the company’s P/E (say, 15) may be compared to the median P/E for the peer companies currently (say, 10), or the ratio 15/10 = 1.5 may be compared to its average past value. The P/E of the most closely matched individual stock can also be used as a benchmark; because of averaging, however, using a group of stocks or an equity index is typically expected to generate less valuation error than using a single stock. In Section 3.3, we illustrate a comparison with a single closely matched individual stock.
Economists and investment analysts have long attempted to group companies by similarities and differences in their business operations. A country’s economy overall is typically grouped most broadly into economic sectors or large industry groupings. These groupings differ depending on the source of the financial information, and an analyst should be aware of differences among data sources. Classifications often attempt to group companies by what they supply (e.g., energy, consumer goods), by demand characteristics (e.g., consumer discretionary), or by financial market or economic theme (e.g., consumer cyclical, consumer noncyclical).
Two classification systems that are widely used in equity analysis are the Global Industry Classification System (GICS) sponsored by Standard & Poor’s and MSCI Barra, and the Industrial Classification Benchmark (ICB) developed by Dow Jones and FTSE, which in 2006 replaced the FTSE Global Classification System. Many other classification schemes developed by commercial and governmental organizations and by academics are also in use.137
The GICS structure assigns each company to one of 154 subindustries, an industry (68 in total), an industry group (24 in total), and an economic sector (10 in total: consumer discretionary, consumer staples, energy, financials, health care, industrials, information technology, materials, telecommunication services, and utilities).138 The assignment is made by a judgment as to the company’s principal business activity, which is based primarily on sales. Because a company is classified on the basis of one business activity, a given company appears in just one group at each level of the classification. A classification of “industrial conglomerates” is available under the economic sector of industrials for companies that cannot be assigned to a principal business activity.
The ICB, like GICS, has four levels, but the terminology of ICB uses the terms sector and industry in nearly opposite senses. At the bottom of the four levels are 114 subsectors, each of which belongs to one of 41 sectors; each sector belongs to one of 19 supersectors; and each supersector belongs to one of 10 industries at the highest level of classification.139 The industries are oil and gas, basic materials, industrials, consumer goods, health care, consumer services, telecommunications, utilities, financials, and technology.140
For these classification systems, analysts often choose the narrowest grouping (i.e., subindustry for GICS and subsector for ICB) as an appropriate starting point for comparison asset identification. For example, the company Continental AG (Xetra Level 1: 543900, also traded as an ADR; NASDAQ: CTTAY), a manufacturer of tires headquartered in Hanover, Germany, appears in the ICB subsector “tires.” This subsector also includes Michelin (NYSE Euronext Paris: 4588364), Goodyear Tire & Rubber Company (NYSE: GT), Bridgestone (Tokyo Stock Exchange: 5810; also traded as an ADR with ticker BRDCY), and Cooper Tire and Rubber (NYSE: CTB). One level up, the sector “automobiles and parts” includes, in addition to tire companies, such disparate companies as automobile manufacturers and their nontire parts suppliers. To narrow the list of comparables in the subsector, an analyst might use information on company size (as measured by revenue or market value of equity) and information on the specific markets served.
Analysts should be aware that, although different organizations often group companies in a broadly similar fashion, sometimes they differ sharply. For example, Reuters Company Research places GATX Corporation (NYSE: GMT), which has several distinct business units, under “miscellaneous transportation” (within a transportation sector), GICS places it under “trading companies and distributors” (within its industrials sector), and BNY Jaywalk and Yahoo! Finance place it under “rental and leasing services” (in a services sector); the lists of peer companies or competitors given by each are, as a result, quite distinct.141
The comparable companies—selected by using any of the choices described previously—provide the basis for calculating a benchmark value of the multiple. In analyzing differences between the subject company’s multiple and the benchmark value of the multiple, financial ratio analysis serves as a useful tool. Financial ratios can point out
• A company’s ability to meet short-term financial obligations (liquidity ratios).
• The efficiency with which assets are being used to generate sales (asset turnover ratios).
• The use of debt in financing the business (leverage ratios).
• The degree to which fixed charges, such as interest on debt, are being met by earnings or cash flow (coverage ratios).
• Profitability (profitability ratios).
With this understanding of terms in hand, we turn to using the method of comparables. We begin with cross-sectional P/Es derived from industry peer groups and move to P/Es derived from comparison assets that are progressively less closely matched to the stock. We then turn to using historical P/Es—that is, P/Es derived from the company’s own history. Finally, we sketch how both fundamentals- and comparables-driven models for P/Es can be used to calculate the terminal value in a multistage DCF valuation.
3.1.5.1. Peer-Company Multiples
Companies operating in the same industry as the subject company (i.e., its peer group) are frequently used as comparison assets. The advantage of using a peer group is that the constituent companies are typically similar in their business mix to the company being analyzed. This approach is consistent with the idea underlying the method of comparables—that similar assets should sell at similar prices. The subject stock’s P/E is compared with the median or mean P/E for the peer group to arrive at a relative valuation. Equivalently, multiplying the benchmark P/E by the company’s EPS provides an estimate of the stock’s value that can be compared with the stock’s market price. The value estimated in this way represents an estimate of intrinsic value if the comparison assets are efficiently (fairly) priced.
In practice, analysts often find that the stock being valued has some significant differences from the median or mean fundamental characteristics of the comparison assets. In applying the method of comparables, analysts usually attempt to judge whether differences from the benchmark value of the multiple can be explained by differences in the fundamental factors believed to influence the multiple. The following relationships for P/E hold, all else being equal:
• If the subject stock has higher-than-average (or higher-than-median) expected earnings growth, a higher P/E than the benchmark P/E is justified.
• If the subject stock has higher-than-average (or higher-than-median) risk (operating or financial), a lower P/E than the benchmark P/E is justified.
Another perspective on these two points is that for a group of stocks with comparable relative valuations, the stock with the greatest expected growth rate (or the lowest risk) is, all else equal, the most attractively valued. Example 6-10 illustrates a simple comparison of a company with its peer group.
EXAMPLE 6-10 A Simple Peer-Group Comparison
As a telecommunications industry analyst at a brokerage firm, you are valuing Verizon Communications, Inc. (NYSE: VZ), the second largest U.S. telecommunications service provider. The valuation metric that you have selected is the trailing P/E. You are evaluating the P/E using the median trailing P/E of peer-group companies as the benchmark value. According to GICS, VZ is in the telecommunications services sector and, within it, the integrated telecommunication services subindustry. Exhibit 6-5 presents the relevant data. (Note that although BCE Inc. is a Canadian company, it is classified in this peer group.)
EXHIBIT 6-5 Trailing P/Es of Telecommunications Services Companies (as of 19 June 2008)
Source : Thomson Financial.
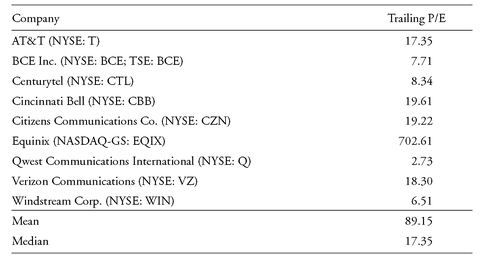
Based on the data in Exhibit 6-5, address the following:
1. Given the stated definition of the benchmark, determine the most appropriate benchmark value of the P/E for VZ.
2. State whether VZ is relatively fairly valued, relatively overvalued, or relatively undervalued, assuming no differences in fundamentals among the peer group companies. Justify your answer.
3. Identify the stocks in this group of telecommunication companies that appear to be relatively undervalued when the median trailing P/E is used as a benchmark. Explain what further analysis might be appropriate to confirm your answer.
Solution to 1: As stated earlier, the use of median values mitigates the effect of outliers on the valuation conclusion. In this instance, the P/E for EQIX is clearly an outlier. Therefore, the median trailing P/E for the group, 17.35, is more appropriate than the mean trailing P/E of 89.15 for use as the benchmark value of the P/E. Note: When a group includes an odd number of companies, as here, the median value will be the middle value when the values are ranked (in either ascending or descending order). When the group includes an even number of companies, the median value will be the average of the two middle values.
Solution to 2: If you assume no differences in fundamentals among the peer group companies, VZ appears to be overvalued because its P/E is greater than the median P/E of 17.35.
Solution to 3: Q, WIN, BCE, and CTL appear to be undervalued relative to their peers because their trailing P/Es are lower than the median P/E. T appears to be relatively fairly valued because its P/E equals the median P/E. To confirm the valuation conclusion, you should analyze the companies for differences in risk and expected growth rates. Specifically, a relatively low P/E may reflect greater risk and/or lower expected earnings growth than the benchmark. Financial ratio analysis is one tool to help analysts determine the dimensions along which companies may differ in risk, growth, or profitability.
A metric that appears to address the impact of earnings growth on P/E is the P/E-to-growth (PEG) ratio. PEG is calculated as the stock’s P/E divided by the expected earnings growth rate in percent. The ratio, in effect, is a calculation of a stock’s P/E per percentage point of expected growth. Stocks with lower PEGs are more attractive than stocks with higher PEGs, all else being equal. Some consider that a PEG ratio less than 1 is an indicator of an attractive value level. PEG is useful but must be used with care for several reasons:
• PEG assumes a linear relationship between P/E and growth. The model for P/E in terms of the DDM shows that, in theory, the relationship is not linear.
• PEG does not factor in differences in risk, an important determinant of P/E.
• PEG does not account for differences in the duration of growth. For example, dividing P/Es by short-term (five-year) growth forecasts may not capture differences in long-term growth prospects.
The way in which fundamentals can add insight to comparables is illustrated in Example 6-11.
EXAMPLE 6-11 A Peer-Group Comparison Modified by Fundamentals
Continuing with the valuation of telecommunication service providers, you gather information on selected fundamentals related to risk (beta), profitability (five-year earnings growth forecast), and valuation (trailing and forward P/Es).142 These data are reported in Exhibit 6-6, which lists companies in order of descending earnings growth forecast. The use of forward P/Es recognizes that differences in trailing P/Es could be the result of transitory effects on earnings.
EXHIBIT 6-6 Valuation Data for Telecommunications Services Companies (as of 19 June 2008)
Sources: Yahoo! Finance for P/Es; Value Line Investment Survey for growth forecasts and betas.
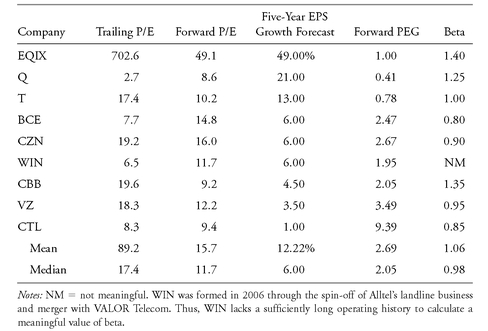
Based on the data in Exhibit 6-6, answer the following questions:
1. In Example 6-10, problem 3, Q, WIN, BCE, and CTL were identified as possibly relatively undervalued compared with the peer group as a whole, and T was identified as relatively fairly valued. What does the additional information in Exhibit 6-6 relating to profitability and risk suggest about the relative valuation of these stocks?
2. The consensus year-ahead EPS forecast for T is $3.42. Suppose the median P/E of 11.72 for the peer group is subjectively adjusted upward to 12.00 to reflect T’s superior profitability and below-average risk. Estimate T’s intrinsic value.
3. The current market price for T is $35.15. State whether T appears to be fairly valued, overvalued, or undervalued when compared with the intrinsic value estimated in answer to question 2.
Solution to 1: According to the profitability data and PEG given in Exhibit 6-6, among the stocks Q, WIN, BCE, and CTL, Q appears to represent the greatest undervaluation. Of the four stocks, Q has
• The highest five-year consensus earnings growth forecast.
• The lowest PEG based on forward P/E.
Of the four stocks, Q has the highest level of risk based on its beta, however, and thus does not clearly dominate the other three stocks. Q’s expectations of faster growth are accompanied by expectations of higher risk.
Some analysts consider a PEG ratio below 1 to be attractive, implying that T is attractive when judged by expected earnings growth. In addition to its attractive growth expectations, T’s level of risk, as measured by beta, is approximately the same as the median for the peer group.
Solution to 2: $3.42 x 12 = $41.04 is an estimate of intrinsic value.
Solution to 3: Because the estimated intrinsic value of $41.04 is greater than the current market price of $35.15, T appears to be undervalued by the market on an absolute basis.
In problem 2 of Example 6-11, a peer median P/E of 11.72 was subjectively adjusted upward to 12.00. Depending on the context, the justification for using the specific value of 12.00 as the relevant benchmark rather than some other value, such as 11.75, 12.25, or 13.00, could be raised. To avoid that issue, one way to express the analysis and results would be as follows: Given its above-average growth and similar risk, T should trade at a premium to the median P/E (11.72) of its peer group.
Analysts frequently compare a stock’s multiple with the median or mean value of the multiple for larger sets of assets than a company’s peer group. The next sections examine comparisons with these larger groups.
3.1.5.2. Industry and Sector Multiples
Median or mean P/Es for industries and for economic sectors are frequently used in relative valuations. Although median P/Es have the advantage that they are insensitive to outliers, some databases report only mean values of multiples for industries.
The mechanics of using industry multiples are identical to those used for peer-group comparisons. Taking account of relevant fundamental information, we compare a stock’s multiple with the median or mean multiple for the company’s industry.
Using industry and sector data can help an analyst explore whether the peer-group comparison assets are themselves appropriately priced. Comparisons with broader segments of the economy can potentially provide insight about whether the relative valuation based on comparables accurately reflects intrinsic value. For example, Value Line reports a relative P/E that is calculated as the stock’s current P/E divided by the median P/E of all issues under Value Line review. The less closely matched the stock is to the comparison assets, the more dissimilarities are likely to be present to complicate the analyst’s interpretation of the data. Arguably, however, the larger the number of comparison assets, the more likely that mispricing of individual assets cancel out. In some cases, we may be able to draw inferences about an industry or sector overall. For example, during the 1998-2000 Internet bubble, comparisons of an individual Internet stock’s value with the overall market would have been more likely to point to overvaluation than would comparisons of relative valuation only among Internet stocks.
3.1.5.3. Overall Market Multiple
Although the logic of the comparables approach suggests the use of industry and peer companies as comparison assets, equity market indexes also have been used as comparison assets. The mechanics of using the method of comparables do not change in such an approach, although the user should be cognizant of any size differences between the subject stock and the stocks in the selected index.
The question of whether the overall market is fairly priced has captured analyst interest throughout the entire history of investing. We mentioned one approach to market valuation (using a DDM) in an earlier chapter.
Example 6-12 shows a valuation comparison to the broad equity market on the basis of P/E.
EXAMPLE 6-12 Valuation Relative to the Market
You are analyzing three large-cap U.S. stock issues with approximately equal earnings growth prospects and risk. As one step in your analysis, you have decided to check valuations relative to the S&P 500 Composite Index. Exhibit 6-7 provides the data.
EXHIBIT 6-7 Comparison with an Index Multiple (prices and EPS in U.S. dollars; as of 12 June 2008)
Source: Standard & Poor’s The Outlook (18 June 2008) for S&P 500 data.
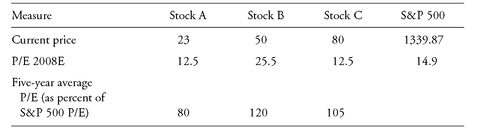
Based only on the data in Exhibit 6-7, address the following:
1. Explain which stock appears relatively undervalued when compared with the S&P 500.
2. State the assumption underlying the use of five-year average P/E comparisons.
Solution to 1: Stock C appears to be undervalued when compared to the S&P 500. Stock A and Stock C are both trading at a P/E of 12.5 relative to 2008 estimated earnings, versus a P/E of 14.9 for the S&P 500. But the last row of Exhibit 6-7 indicates that Stock A has historically traded at a P/E reflecting a 20 percent discount to the S&P 500 (which, based on the current level of the S&P 500, would imply a P/E of 0.8 x 14.9 = 11.9). In contrast, Stock C has usually traded at a premium to the S&P 500 P/E but now trades at a discount to it. Stock B is trading at a high P/E, even higher than its historical relationship to the S&P 500’s P/E (1.2 x 14.9 = 17.9). Solution to 2: Using historical relative-value information in investment decisions relies on an assumption of stable underlying economic relationships (that is, that the past is relevant for the future).
Because many equity indexes are market capitalization-weighted, financial databases often report the average market P/E with the individual P/Es weighted by the company’s market capitalization. As a consequence, the largest constituent stocks heavily influence the calculated P/E. If P/Es differ systematically by market capitalization, however, differences in a company’s P/E multiple from the index’s multiple may be explained by that effect. Therefore, particularly for stocks in the middle-cap range, the analyst should favor using the median P/E for the index as the benchmark value of the multiple.
As with other comparison assets, the analyst may be interested in whether the equity index itself is efficiently priced. A common comparison is the index’s P/E in relation to historical values. Siegel (2002) noted that P/Es in 2001 were more than twice as high as the average P/E for U.S. stocks over a 130-year period (1871-2001) of 14.5. Potential justifications for a higher-than-average P/E include lower-than-average interest rates and/or higher-than-average expected growth rates. An alternative hypothesis in a situation such as that noted by Siegel is that the market as a whole is overvalued or, alternatively, that earnings are abnormally low.
The time frame for comparing average multiples is important. For example, at the end of the second quarter of 2008, the P/E for the S&P 500, based on 2008 earnings estimates, was 17.6. That value, although higher than the 15.8 historical average since 1935, fell below the historical average for the previous 5-, 10-, and 20-year time periods, when the P/E ranged between 20 and 26. The use of past data relies on the key assumption that the past (sometimes the distant past) is relevant for the future.
We end this section with an introduction to valuation of the equity market itself on the basis of P/E. A well-known comparison is the earnings yield (the E/P) on a group of stocks and the interest yield on a bond. The so-called Fed Model, based on a paper written by three analysts at the U.S. Federal Reserve, predicts the return on the S&P 500 on the basis of the relationship between forecasted earnings yields and yields on bonds (Lander, Orphanides, and Douvogiannis 1997). Example 6-13 illustrates the Fed Model.
EXAMPLE 6-13 The Fed Model
One of the main drivers of P/E for the market as a whole is the level of interest rates. The inverse relationship between value and interest rates can be seen from the expression of P/E in terms of fundamentals, because the risk-free rate is one component of the required rate of return that is inversely related to value. The Fed Model relates the earnings yield on the S&P 500 to the yield to maturity on 10-year U.S. Treasury bonds. As we have defined it, the earnings yield (E/P) is the inverse of the P/E; the Fed Model uses expected earnings for the next 12 months in calculating the ratio.
Based on the premise that the two yields should be closely linked, on average, the trading rule based on the Fed Model considers the stock market to be overvalued when the market’s current earnings yield is less than the 10-year Treasury bond (T-bond) yield. The intuition is that when risk-free T-bonds offer a yield that is higher than stocks—which are a riskier investment—stocks are an unattractive investment.
According to the model, the justified or fair-value P/E for the S&P 500 is the reciprocal of the 10-year T-bond yield. As of 2 July 2008, according to the model, with a 10-year T-bond yielding 3.79 percent, the justified P/E on the S&P 500 was 1/0.0379 = 26.4. The forward P/E based on 2009 earnings estimates for the S&P 500 as of same date was 18.3.
We previously presented an expression for the justified P/E in terms of the Gordon growth model. That expression indicates that the expected growth rate in dividends or earnings is a variable that enters into the intrinsic value of a stock (or an index of stocks). A concern in considering the Fed Model is that this variable is lacking in the model.143 Example 6-14 presents a valuation model for the equity market that incorporates the expected growth rate in earnings.
EXAMPLE 6-14 The Yardeni Model
Yardeni (2000) developed a model that incorporates the expected growth rate in earnings—a variable that is missing in the Fed Model.144 Yardeni’s model is
where
CEY = current earnings yield on the market index CBY = current Moody’s Investors Service A-rated corporate bond yield LTEG = consensus five-year earnings growth rate forecast for the market index
The coefficient b measures the weight the market gives to five-year earnings projections. (Recall that the expression for P/E in terms of the Gordon growth model is based on the long-term sustainable growth rate and that five-year forecasts of growth may not be sustainable.) Although CBY incorporates a default risk premium relative to T-bonds, it does not incorporate an equity risk premium per se. For example, in the bond yield plus risk premium model for the cost of equity, an analyst typically adds 300-400 basis points to a corporate bond yield.
Yardeni found that, historically, the coefficient b has averaged 0.10. Noting that CEY is E/P and taking the inverse of both sides of this equation, Yardeni obtained the following expression for the justified P/E on the market: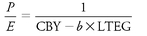
Consistent with valuation theory, in Yardeni’s model, higher current corporate bond yields imply a lower justified P/E and higher expected long-term growth results in a higher justified P/E.
Critics of the Fed Model point out that the model inadequately reflects the effects of inflation and incorrectly incorporates the differential effects of inflation on earnings and interest payments (e.g., Siegel 2002). Some empirical evidence has shown that prediction of future returns based on simple P/E outperforms prediction based on the Fed Model’s differential with bond yields (for the U.S. market, see Arnott and Asness 2003; for nine other markets, see Aubert and Giot 2007).
Another drawback to the Fed Model is that the relationship between interest rates and earnings yields is not a linear one. This drawback is most noticeable at low interest rates. For example, in August 2008, the yield on 10 -year Japanese government bonds was 1.42 percent, which, according to the Fed Model, implied an unreasonably high justified P/E of 70.4 for the Nikkei 225 (1/0.0142 = 70.4) at that time. Furthermore, small changes in interest rates and/or corporate profits can significantly alter the justified P/E predicted by the model. Overall, an analyst should look to the Fed Model only as one tool for calibrating the overall value of the stock market and should avoid overreliance on the model as a predictive method, particularly in periods of low inflation and low interest rates.
3.1.5.4. Own Historical P/E
As an alternative to comparing a stock’s valuation with that of other stocks, one traditional approach uses past values of the stock’s own P/E as a basis for comparison. Underlying this approach is the idea that a stock’s P/E may regress to historical average levels.
An analyst can obtain a benchmark value in a variety of ways with this approach. Value Line reports as a “P/E median” a rounded average of four middle values of a stock’s average annual P/E for the previous 10 years. The five-year average trailing P/E is another reasonable metric. In general, trailing P/Es are more commonly used than forward P/Es in such computations. In addition to “higher” and “lower” comparisons with this benchmark, justified price based on this approach may be calculated as follows:
Justified price = (Benchmark value of own historical P/Es) x (Most recent EPS) (6-3) Normalized EPS replaces most recent EPS in this equation when EPS is negative and whenever otherwise appropriate.
Example 6-15 illustrates the use of past values of the stock’s own P/E as a basis for reaching a valuation conclusion.
EXAMPLE 6-15 Valuation Relative to Own Historical P/Es
As of mid-2008, you are valuing Honda Motor Company (TSE: 7267; NYSE ADR: HMC), Japan’s second largest auto maker in terms of sales, assets, and market capitalization. You are applying the method of comparables using HMC’s five-year average P/E as the benchmark value of the multiple. Exhibit 6-8 presents the data.
EXHIBIT 6-8 Historical P/Es for HMC
Sources: Value Line Investment Survey for average annual P/Es; calculations for mean and medium P/Es.
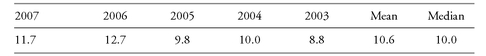
1. State a benchmark value for Honda’s P/E.
2. Given EPS for the year ended 31 March 2008 of ¥330.54, calculate and interpret a justified price for Honda.
3. Compare the justified price with the stock’s recent price of ¥3,590.
Solution to 1: From Exhibit 6-8, the benchmark value based on the median P/E value is 10.0 and based on the mean P/E value is 10.6.
Solution to 2: The calculation is 10.0 x ¥330.54 = ¥3,305 when the median-based benchmark P/E is used and 10.6 x ¥330.54 = ¥3,504 when the mean-based benchmark P/E is used.
Solution to 3: The stock’s recent price is 8.6 percent (calculated as 3,590/3,305 - 1) more than the justified price of the stock based on median historical P/E but only 2.5 percent (calculated as 3,590/3,504 - 1) more than the justified price of the stock based on mean historical P/Es. The stock may be overvalued but misvaluation, if present, appears slight.
In using historical P/Es for comparisons, analysts should be alert to the impact on P/E levels of changes in a company’s business mix and leverage over time. If the company’s business has changed substantially within the time period being examined, the method based on a company’s own past P/Es is prone to error. Shifts in the use of financial leverage may also impair comparability based on average own past P/E.
Changes in the interest rate environment and economic fundamentals over different time periods can be another limitation to using an average past value of P/E for a stock as a benchmark. A specific caution is that inflation can distort the economic meaning of reported earnings. Consequently, if the inflationary environments reflected in current P/E and average own past P/E are different, a comparison between the two P/Es may be misleading. Changes in a company’s ability to pass through cost inflation to higher prices over time may also affect the reliability of such comparisons, as illustrated in Example 6-16 in the next section.
3.1.6. P/Es in Cross-Country Comparisons
When comparing the P/Es of companies in different countries, the analyst should be aware of the following effects that may influence the comparison:
• The effect on EPS of differences in accounting standards. Comparisons (without analyst adjustments) among companies preparing financial statements based on different accounting standards may be distorted. Such distortions may occur when, for example, the accounting standards differ as to permissible recognition of revenues, expenses, or gains.
• The effect on marketwide benchmarks of differences in their macroeconomic contexts.
Differences in macroeconomic contexts may distort comparisons of benchmark P/E levels among companies operating in different markets.
A specific case of the second bullet point is differences in inflation rates and in the ability of companies to pass through inflation in their costs in the form of higher prices to their customers. For two companies with the same pass-through ability, the company operating in the environment with higher inflation will have a lower justified P/E; if the inflation rates are equal but pass-through rates differ, the justified P/E should be lower for the company with the lower pass-through rate. Example 6-16 provides analysis in support of these conclusions.
EXAMPLE 6-16 An Analysis of P/Es and Inflation145
Assume that a company with no real earnings growth, such that its earnings growth can result only from inflation, will pay out all its earnings as dividends. Based on the Gordon (constant growth) DDM, the value of a share is:
where
P0 = current price, which is substituted for the intrinsic value, V0, for purposes of analyzing a justified P/E
E0 = current EPS, which is substituted for current dividends per share, D0, because the assumption in this example is that all earnings are paid out as dividends
I = rate of inflation, which is substituted for expected growth, g, because of the assumption in this example that the company’s only growth is from inflation r = required return
Suppose the company has the ability to pass on some or all inflation to its customers and let λ represent the percentage of inflation in costs that the company can pass through to revenue. The company’s earnings growth may then be expressed as λI and the equation becomes
Now introduce a real required rate of return, defined here as r minus I and represented as ρ. The value of a share and the justified forward P/E can now be expressed, respectively, as follows:146
and
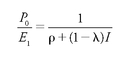
If a company can pass through all inflation, so that λ = 1 (100 percent), then the P/E is equal to 1/ρ. But if the company can pass through no inflation, so that λ = 0, then the P/E is equal to 1/(ρ + I )—that is, 1/r.
You are analyzing two companies, Company M and Company P. The real rate of return required on the shares of Company M and Company P is 3 percent per year. Using the analytic framework provided, address the following:
1. Suppose both Company M and Company P can pass through 75 percent of cost increases. Cost inflation is 6 percent for Company M but only 2 percent for Company P.
a. Estimate the justified P/E for each company.
b. Interpret your answer to part A.
2. Suppose both Company M and Company P face 6 percent annual inflation. Company M can pass through 90 percent of cost increases, but Company P can pass through only 70 percent.
a. Estimate the justified P/E for each company.
b. Interpret your answer to part A.
Solutions to 1:
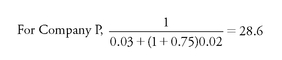
B. With less than 100 percent cost pass-through, the justified P/E is inversely related to the inflation rate.
Solutions to 2:
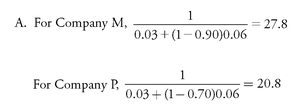
B. For equal inflation rates, the company with the higher pass-through rate has a higher justified P/E.
Example 6-16 illustrates that with less than 100 percent cost pass-through, the justified P/E is inversely related to the inflation rate (with complete cost pass-through, the justified P/E should not be affected by inflation). The higher the inflation rate, the greater the impact of incomplete cost pass-through on P/E. From Example 6-16, one can also infer that the higher the inflation rate, the more serious the effect on justified P/E of a pass-through rate that is less than 100 percent.
3.1.7. Using P/Es to Obtain Terminal Value in Multistage Dividend Discount Models
In using a DDM to value a stock, whether applying a multistage model or modeling within a spreadsheet (forecasting specific cash flows individually up to some horizon), estimation of the terminal value of the stock is important. The key condition that must be satisfied is that terminal value reflects earnings growth that the company can sustain in the long run. Analysts frequently use price multiples—in particular, P/Es and P/Bs—to estimate terminal value. We can call such multiples terminal price multiples. Choices for the terminal multiple, with a terminal P/E multiple used as the example, include the following.
• Terminal price multiple based on fundamentals. As illustrated earlier, analysts can restate the Gordon growth model as a multiple by, for example, dividing both sides of the model by EPS. For terminal P/E multiples, dividing both sides of the Gordon growth model by EPS at time n, where n is the point in time at which the final stage begins (i.e., En), gives a trailing terminal price multiple; dividing both sides by EPS at time n + 1 (i.e., En+1) gives a leading terminal price multiple. Of course, an analyst can use the Gordon growth model to estimate terminal value and need not go through the process of deriving a terminal price multiple and then multiplying by the same value of the fundamental to estimate terminal value. Because of their familiarity, however, multiples may be useful in communicating an estimate of terminal value.
• Terminal price multiple based on comparables. Analysts have used various choices for the benchmark value, including
° Median industry P/E.
° Average industry P/E.
° Average of own past P/Es.
Having selected a terminal multiple, the expression for terminal value when using a terminal P/E multiple is
or
where
The use of a comparables approach has the strength that it is entirely grounded in market data. In contrast, the Gordon growth model calls for specific estimates (the required rate of return, the dividend payout ratio, and the expected mature growth rate), and the model’s output is very sensitive to changes in those estimates. A possible disadvantage to the comparables approach is that when the benchmark value reflects mispricing (over- or undervaluation), so will the estimate of terminal value. Example 6-17 illustrates the use of P/Es and the Gordon growth model to estimate terminal value.
EXAMPLE 6-17 Using P/Es and the Gordon Growth Model to Value the Mature Growth Phase
As an energy analyst, you are valuing the stock of an oil exploration company. You have projected earnings and dividends three years out (to t = 3), and you have gathered the following data and estimates:
• Required rate of return = 0.10
• Average dividend payout rate for mature companies in the market = 0.45
• Industry average ROE = 0.13
• E3 = $3.00
• Industry average P/E = 14.3
On the basis of this information, carry out the following:
1. Calculate terminal value based on comparables, using your estimated industry average P/E as the benchmark.
2. Contrast your answer in problem 1 to an estimate of terminal value using the Gordon growth model.
Solution to 1: Vn = Benchmark value of P/E x En = 14.3 x $3.00 = $42.90.
Solution to 2: Recall that the Gordon growth model expresses intrinsic value, V, as the present value of dividends divided by the required rate of return, r, minus the growth rate, g : V0 = D0(1 + g)/(r-g). Here we are estimating terminal value, so the relevant expression is Vn = Dn(1 + g)/(r-g). You would estimate that the dividend at t = 3 will equal earnings in year 3 of $3.00 times the average payout ratio of 0.45, or Dn = $3.00 x 0.45 = $1.35. Recall also the sustainable growth rate expression—that is, g = b x ROE, where b is the retention rate and equivalent to 1 minus the dividend payout ratio. In this example, b = (1 - 0.45) = 0.55, and you can use ROE = 0.13 (the industry average). Therefore, g = b x ROE = 0.55 x 0.13 = 0.0715. Given the required rate of return of 0.10, you obtain the estimate Vn = ($1.35)(1 + 0.0715)/(0.10 - 0.0715) = $50.76. In this example, therefore, the Gordon growth model estimate of terminal value is 18.3 percent higher than the estimate based on comparables calculated in problem 1 (i.e., 0.1832 = $50.76/$42.90 - 1).
3.2. Price to Book Value
The ratio of market price per share to book value per share (P/B), like P/E, has a long history of use in valuation practice (as discussed in Graham and Dodd 1934). According to the 2007 Merrill Lynch Institutional Factor Survey of factors used by institutional investors in stock selection, from 1989 through 2005, P/B was only slightly less popular than P/E as a factor; in 2006, P/B was equally popular.
In the P/E multiple, the measure of value (EPS) in the denominator is a flow variable relating to the income statement. In contrast, the measure of value in the P/B’s denominator (book value per share) is a stock or level variable coming from the balance sheet. (Book refers to the fact that the measurement of value comes from accounting records or books, in contrast to market value.) Intuitively, therefore, we note that book value per share attempts to represent, on a per-share basis, the investment that common shareholders have made in the company. To define book value per share more precisely, we first find shareholders’ equity (total assets minus total liabilities). Because our purpose is to value common stock, we subtract from shareholders’ equity any value attributable to preferred stock to obtain common shareholders’ equity, or the book value of equity(often called simply book value).147 Dividing book value by the number of common stock shares outstanding, we obtain book value per share, the denominator in P/B.
In the balance of this section, we present the reasons analysts have offered for using P/B and possible drawbacks to its use. We then illustrate the calculation of P/B and discuss the fundamental factors that drive P/B. We end the section by showing the use of P/B based on the method of comparables.
Analysts have offered several rationales for the use of P/B; some specifically compare P/B with P/E:
• Because book value is a cumulative balance sheet amount, book value is generally positive even when EPS is zero or negative. An analyst can generally use P/B when EPS is zero or negative, whereas P/E based on a zero or negative EPS is not meaningful.
• Because book value per share is more stable than EPS, P/B may be more meaningful than P/E when EPS is abnormally high or low or is highly variable.
• As a measure of net asset value per share, book value per share has been viewed as appropriate for valuing companies composed chiefly of liquid assets, such as finance, investment, insurance, and banking institutions (Wild, Bernstein, and Subramanyam 2001, 233). For such companies, book values of assets may approximate market values. When information on individual corporate assets is available, analysts may adjust reported book values to market values where they differ.
• Book value has also been used in the valuation of companies that are not expected to continue as a going concern (Martin 1998, 22).
• Differences in P/Bs may be related to differences in long-run average returns, according to empirical research.148
Possible drawbacks of P/Bs in practice include the following:
• Assets in addition to those recognized in financial statements may be critical operating factors. For example, in many service companies, human capital—the value of skills and knowledge possessed by the workforce—is more important than physical capital as an operating factor, but it is not reflected as an asset on the balance sheet. Similarly, the good reputation that a company develops by consistently providing high-quality goods and services is not reflected as an asset on the balance sheet.
• P/B may be misleading as a valuation indicator when the levels of assets used by the companies under examination differ significantly. Such differences may reflect differences in business models.
• Accounting effects on book value may compromise how useful book value is as a measure of the shareholders’ investment in the company. In general, intangible assets that are generated internally (as opposed to being acquired) are not shown as assets on a company’s balance sheet. For example, companies account for advertising and marketing as expenses, so the value of internally generated brands, which are created and maintained by advertising and marketing activities, do not appear as assets on a company’s balance sheet under IFRS or U.S. GAAP. Similarly, when accounting standards require that research and development (R&D) expenditures be treated as expenses, the values of internally developed patents do not appear as assets. Certain R&D expenditures can be capitalized, although rules vary among accounting standards. Accounting effects such as these may impair the comparability of P/B among companies and countries unless appropriate analyst adjustments are made.
• In the accounting of many countries, including the United States, book value largely reflects the historical purchase costs of assets, net of the accumulated accounting depreciation expenses. Inflation and technological change eventually drive a wedge, however, between the book value and the market value of assets. As a result, book value per share often poorly reflects the value of shareholders’ investments. Significant differences in the average age of assets among companies being compared may weaken the comparability of P/Bs among companies.
• Share repurchases or issuances may distort historical comparisons.
As an example of the effects of share repurchases, consider Colgate-Palmolive Company (NYSE: CL). As of 31 December 2007, CL’s trailing P/E and P/B were, respectively, 22.5 and 19.0. Ten years earlier (as of 31 December 1997), CL’s trailing P/E and P/B were 32.5 and 12.1. In other words, the company’s P/E narrowed by 31 percent (= 22.5/32.5 - 1) while its P/B widened by 57 percent (= 19.0/12.1 - 1). The majority of the difference in changes in these two multiples can be attributed to the substantial amount of shares that CL repurchased over those 10 years, as reflected in the 18 percent compounded annual growth rate (CAGR) of its treasury stock. Because of those share repurchases and the dramatic growth in treasury stock, CL’s total shareholders’ equity grew at a rate of only 0.5 percent despite the 13 percent CAGR in retained earnings. In summary, when a company repurchases shares at a price higher than the current book value per share, it lowers the overall book value per share for the company. All else being equal, the effect is to make the stock appear more expensive on a P/B basis than it would appear if historical levels of P/B were used.
Example 6-18 illustrates another potential limitation to using P/B in valuation.
EXAMPLE 6-18 Differences in Business Models Reflected in Differences in P/Bs
Dell Computer Corporation competes in the personal computer industry. Exhibit 6-9 gives Dell’s P/B and P/Bs of its industry peers as of mid-2008.
EXHIBIT 6-9 P/Bs for Dell and Industry
Source: Thompson One Banker.
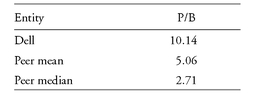
With a P/B that is 3.7 times higher than the peer median, Dell appears to be substantially overvalued (at least if we assume that profitability is comparable). However, consideration of Dell’s business model shows that this conclusion may be mistaken. Dell is an assembler rather than a manufacturer, uses a just-in-time inventory system for parts needed in assembly, and sells built-to-order computers directly to the end consumer. Just-in-time inventory systems attempt to minimize the amount of time that parts needed for building computers are held in inventory. How can these practices explain the much higher P/B of Dell compared with the P/Bs of peer-group stocks?
Because Dell assembles parts manufactured elsewhere, it requires smaller investments in fixed assets than it would if it were a manufacturer; this business strategy translates into a smaller book value per share. The just-in-time inventory system reduces Dell’s required investment in working capital. Because Dell does not need to respond to the inventory needs of large resellers, its need to invest in working capital is reduced.
The overall effect of this business model is that Dell generates its sales on a comparatively small base of assets. So Dell’s higher P/B is explained by its business model. Because Dell’s P/B is not directly comparable with those of its peer group, using an average or median P/B as the benchmark for estimating the value of Dell would be misleading.
3.2.1. Determining Book Value
In this section, we illustrate how to calculate book value and how to adjust book value to improve the comparability of P/Bs among companies. To compute book value per share, we need to refer to the business’s balance sheet, which has a shareholders’ (or stockholders’) equity section. The computation of book value is as follows:
• (Shareholders’ equity) - (Total value of equity claims that are senior to common stock) = Common shareholders’ equity
• (Common shareholders’ equity)/(Number of common stock shares outstanding) = Book value per share
Possible claims senior to the claims of common stock, which would be subtracted from shareholders’ equity, include the value of preferred stock and the dividends in arrears on preferred stock.149 Example 6-19 illustrates the calculation.
EXAMPLE 6-19 Computing Book Value per Share
The Allstate Corporation (NYSE: ALL), a U.S.-based insurance company, reported thevbalance sheet given in Exhibit 6-10 for its fiscal year ending 31 December 2007.
EXHIBIT 6-10 Allstate Corporation and Subsidiaries Consolidated Statements of Financial Position ($ in millions, except par value data)
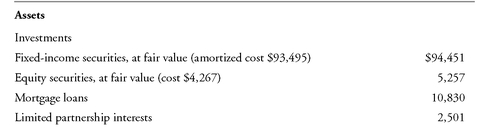
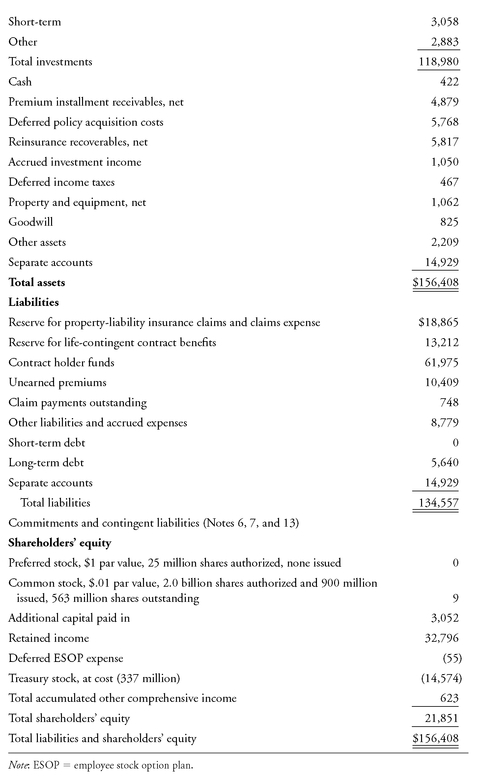
The entries in the balance sheet should be familiar. Treasury stock results from share repurchases (or buybacks) and is a reduction in total shareholders’ equity.
1. Using the data in Exhibit 6-10, calculate book value per share as of 31 December 2007.
2. Given a closing price per share for ALL of $47.00 as of 13 February 2008 and your answer to problem 1, calculate ALL’s P/B as of 13 February 2008.
Solution to 1: The divisor is the number of shares outstanding. As shown in the line labeled “Common stock . . .” in Exhibit 6-10, the number of shares outstanding (563 million) is equal to the number of shares issued (900 million) minus the number of shares held in treasury stock (337 million), which appears in the line labeled “Treasury stock . . .” Therefore, (Common shareholders’ equity)/(Number of common stock shares outstanding) = $21,851/563 = $38.81.
Solution to 2: P/B = $47.00/$38.81 = 1.21.
Example 6-19 illustrated the calculation of book value per share without any adjustments. Adjusting P/B has two purposes: (1) to make the book value per share more accurately reflect the value of shareholders’ investment and (2) to make P/B more useful for making comparisons among different stocks. Some adjustments are as follows:
• Some services and analysts report a tangible book value per share. Computing tangible book value per share involves subtracting reported intangible assets on the balance sheet from common shareholders’ equity. The analyst should be familiar with the calculation. From the viewpoint of financial theory, however, the general exclusion of all intangibles may not be warranted. In the case of individual intangible assets, such as patents, which can be separated from the entity and sold, exclusion may not be justified. Exclusion may be appropriate, however, for goodwill from acquisitions, particularly for comparative purposes. Goodwill represents the excess of the purchase price of an acquisition beyond the fair value of acquired tangible assets and specifically identifiable intangible assets. Many analysts believe that goodwill does not represent an asset because it is not separable and may reflect overpayment for an acquisition.
• Certain adjustments may be appropriate for enhancing comparability. For example, one company may use FIFO whereas a peer company uses LIFO, which in an inflationary environment will generally understate inventory values. To accurately assess the relative valuation of the two companies, the analyst should restate the book value of the company using LIFO to what it would be based on FIFO.
• For book value per share to most accurately reflect current values, the balance sheet should be adjusted for significant off-balance-sheet assets and liabilities. An example of an off-balance-sheet liability is a guarantee to pay a debt of another company in the event of that company’s default. U.S. accounting standards require companies to disclose off-balance-sheet liabilities.
Example 6-20 illustrates adjustments an analyst might make to a financial firm’s P/B to obtain an accurate firm value.
EXAMPLE 6-20 Adjusting Book Value
Edward Stavros is a junior analyst at a major U.S. pension fund. Stavros is researching Discover Financial Services (NYSE: DFS) for his fund’s Credit Services portfolio and is preparing background information prior to an upcoming meeting with the company. Stavros is particularly interested in Discover’s P/B and in assessing the impact of recently introduced fair-value accounting disclosures. He obtains the condensed balance sheet and selected footnote excerpts for Discover for the first quarter of 2008 from SEC filings; these data are shown in Exhibit 6-11.
EXHIBIT 6-11 Discover Financial Services Condensed Consolidated Balance Sheet (in thousands except per-share amounts)
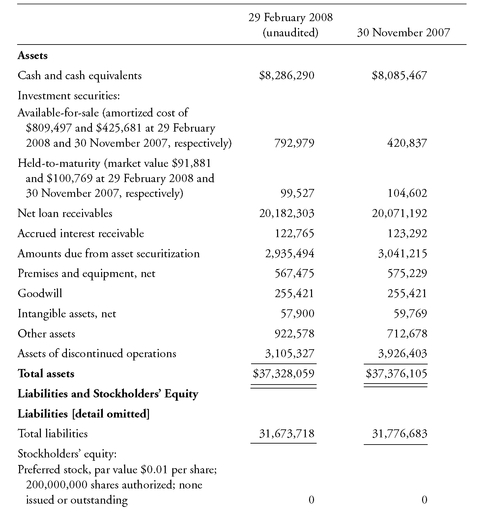
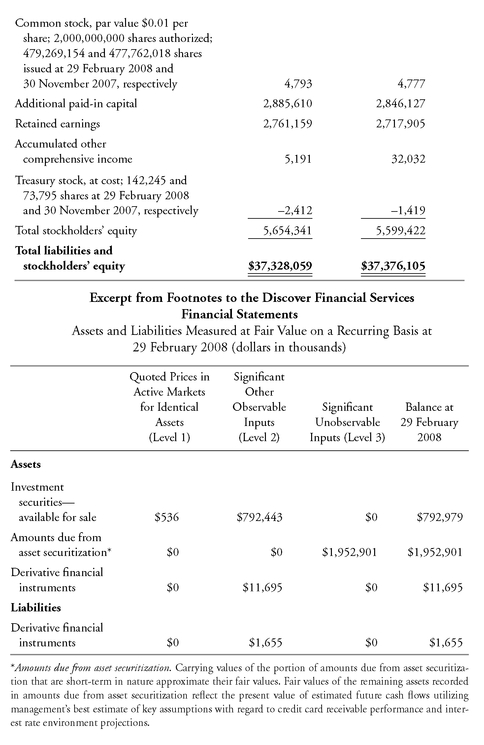
Stavros computes book value per share initially by dividing total shareholders’ equity ($5,654,341,000) by the number of shares outstanding at 29 February 2008 (479,126,909). The resulting book value per share is $11.80.
Stavros then computes tangible book value per share as $11.15 (calculated as $5,654,341,000 minus $255,421,000 of goodwill and $57,900,000 of other intangibles = $5,341,020,000 net tangible assets, which is then divided by 479,126,909 shares). Based on a price of $17.40 shortly after the end of the first quarter, Discover has a P/B of $17.40/$11.15 = 1.6.
Stavros then turns to the footnotes to examine the fair-value data. In particular, he is interested in the amount of assets that are measured by using Level 3 inputs. The level of input refers to how observable the inputs used by management to assess fair value are, and Level 3 would contain the least observable (and thus the most sensitive to management’s judgment).150 An asset valued using Level 1 inputs is based on a market quote for an identical asset in a liquid market, and an asset valued on Level 2 inputs uses significant other observable inputs. In some cases, if an analyst has concern about the estimated inputs or the valuation methodology, it may be appropriate for the analyst to apply a discount to Level 3 assets and liabilities and to adjust ratios accordingly.
For Discover, Stavros notes that the total amount of assets measured using Level 3 inputs is $1,952,901,000. This amount is 71 percent of the company’s assets measured at fair value and 5 percent of the company’s total assets. Its materiality suggests that the amount merits additional attention. From the financial statement footnotes, Stavros sees that the value of the Level 3 assets is based on management’s projections of credit card receivable performance and the interest rate environment. Stavros concludes that it will be very important for him to understand how management makes those projections, and he will thus give particular attention to the discussion of the topic at the upcoming meeting with the firm. At present, he has no reason to disagree with the fair values and will thus proceed with the tangible book value per share as calculated.
An analyst should also be aware of differences in accounting standards related to how assets and liabilities are valued in financial statements. Accounting standards currently require companies to report some assets and liabilities at fair value151 and others at historical cost (with some adjustments).
Financial assets, such as investments in marketable securities, are usually reported at fair market value. Investments classified as held to maturity and reported on a historical cost basis are an exception. Some financial liabilities also are reported at fair value.
Nonfinancial assets, such as land and equipment, are generally reported at their historical acquisition costs, and in the case of equipment, the assets are depreciated over their useful lives.
The value of these assets may have increased over time, however, or the value may have decreased more than is reflected in the accumulated depreciation. When the reported amount of an asset—that is, its carrying value—exceeds its recoverable amount, both international accounting (IFRS) and U.S. accounting standards (GAAP) require companies to reduce the reported amount of the asset and show the reduction as an impairment loss.152 U.S. GAAP, however, prohibit revaluing assets upward, whereas IFRS allow companies to report either a revalued amount or an amount based on historical cost. When assets are reported at fair value, P/Bs become more comparable among companies; for this reason, P/Bs are considered to be more comparable for companies with significant amounts of financial assets.
3.2.2. Valuation Based on Forecasted Fundamentals
We can use forecasts of a company’s fundamentals to estimate a stock’s justified P/B. For example, assuming the Gordon growth model and using the expression g = b x ROE for the sustainable growth rate, the expression for the justified P/B based on the most recent book value (B0) is153
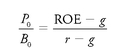
For example, if a business’s ROE is 12 percent, its required rate of return is 10 percent, and its expected growth rate is 7 percent, then its justified P/B based on fundamentals is (0.12 - 0.07)/(0.10 - 0.07) = 1.67.
Equation 6-4 states that the justified P/B is an increasing function of ROE, all else equal. Because the numerator and denominator are differences of, respectively, ROE and r from the same quantity, g, what determines the justified P/B in Equation 6-4 is ROE in relation to the required rate of return r. The larger ROE is in relation to r, the higher is the justified P/B based on fundamentals.154
A practical insight from Equation 6-4 is that we cannot conclude whether a particular value of the P/B reflects undervaluation without taking into account the business’s profitability. Equation 6-4 also suggests that if we are evaluating two stocks with the same P/B, the one with the higher ROE is relatively undervalued, all else equal. These relationships have been confirmed through cross-sectional regression analyses.155
Further insight into P/B comes from the residual income model, which was discussed in detail in Chapter 5. The expression for the justified P/B based on the residual income valuation is156
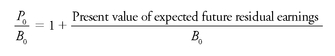
Equation 6-5, which makes no special assumptions about growth, states the following:
• If the present value of expected future residual earnings is zero—for example, if the business just earns its required return on investment in every period—the justified P/B is 1.
• If the present value of expected future residual earnings is positive (negative), the justified P/B is greater than (less than) 1.
3.2.3. Valuation Based on Comparables
To use the method of comparables for valuing stocks using a P/B, we follow the steps given in Section 3.1.5. In contrast to EPS, however, analysts’ forecasts of book value are not aggregated and widely disseminated by financial data vendors; in practice, most analysts use trailing book value in calculating P/Bs.157 Evaluation of relative P/Bs should consider differences in ROE, risk, and expected earnings growth. The use of P/Bs in the method of comparables is illustrated in Example 6-21.
EXAMPLE 6-21 P/B Comparables Approach
You are working on a project to value an independent securities brokerage firm. Although you are aware that significant changes occurred in the industry in 2008, as part of the analysis, you decide to review 2007 data on three firms that, at that time, were independent securities brokerage firms: Goldman Sachs (NYSE: GS), Merrill Lynch (formerly NYSE: MER), and Morgan Stanley (NYSE: MS). Exhibit 6-12 presents information on these firms.158
EXHIBIT 6-12 P/B Comparables
Sources: Value Line Investment Survey (25 April 2008); Yahoo! Finance for industry average; www.Reuters.com for beta.
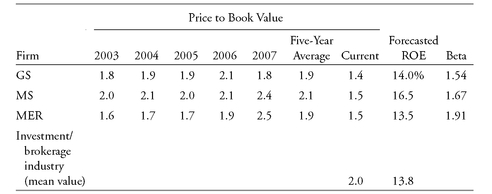
Based only on the information in Exhibit 6-12, discuss the valuation of MER relative to the industry and peer companies.
Solution: MER was selling at a P/B that was 75 percent of the industry mean P/B. At the same time, its expected ROE was roughly equivalent to the industry’s. Solely on the basis of the data given, MER appears to be slightly undervalued relative to the industry benchmark. Based on the data given, however, it appears to be overvalued with respect to MS and GS. Specifically:
• Compared with MS, MER has the same P/B but a lower expected ROE and higher risk, as judged by beta.
• Compared with GS, MER has a higher P/B but a lower expected ROE and higher risk, as judged by beta.
3.3. Price to Sales
Certain types of privately held companies, including investment management companies and many types of companies in partnership form, have long been valued by a multiple of annual revenues. In recent decades, the ratio of price to sales has become well known as a valuation indicator for the equity of publicly traded companies as well. Based on U.S. data, O’Shaughnessy (2005) characterized P/S as the best ratio for selecting undervalued stocks. According to the Merrill Lynch Institutional Factor Survey, from 1989 through 2006, almost 20 percent of respondents, on average, consistently used P/S in their investment process. Analysts have offered the following rationales for using P/S:
• Sales are generally less subject to distortion or manipulation than are other fundamentals, such as EPS or book value. For example, through discretionary accounting decisions about expenses, company managers can distort EPS as a reflection of economic performance. In contrast, the total sales figure, as the top line in the income statement, is prior to any expenses.
• Sales are positive even when EPS is negative. Therefore, analysts can use P/S when EPS is negative, whereas the P/E based on a zero or negative EPS is not meaningful.
• Because sales are generally more stable than EPS, which reflects operating and financial leverage, P/S is generally more stable than P/E. P/S may be more meaningful than P/E when EPS is abnormally high or low.
• P/S has been viewed as appropriate for valuing the stocks of mature, cyclical, and zero-income companies (Martin 1998).
• Differences in P/S multiples may be related to differences in long -run average returns, according to empirical research (Nathan et al. 2001; O’Shaughnessy 2005; Senchack and Martin 1987).
Possible drawbacks of using P/S in practice include the following:
• A business may show high growth in sales even when it is not operating profitably as judged by earnings and cash flow from operations. To have value as a going concern, a business must ultimately generate earnings and cash.
• Share price reflects the effect of debt financing on profitability and risk. In the P/S multiple, however, price is compared with sales, which is a prefinancing income measure—a logical mismatch. For this reason, some experts use a ratio of enterprise value to sales because enterprise value incorporates the value of debt.
• P/S does not reflect differences in cost structures among different companies.
• Although P/S is relatively robust with respect to manipulation, revenue recognition practices have the potential to distort P/S.
Despite the contrasts between P/S and P/E, the ratios have a relationship with which analysts should be familiar. The fact that (Sales) x (Net profit margin) = Net income means that (P/E) x (Net profit margin) = P/S. For two stocks with the same positive P/E, the stock with the higher P/S has a higher (actual or forecasted) net profit margin, calculated as the ratio of P/S to P/E.
3.3.1. Determining Sales
P/S is calculated as price per share divided by annual net sales per share (net sales is total sales
minus returns and customer discounts). Analysts usually use annual sales from the company’s most recent fiscal year in the calculation, as illustrated in Example 6-22. Because valuation is forward looking in principle, the analyst may also develop and use P/S multiples based on forecasts of next year’s sales.
EXAMPLE 6-22 Calculating P/S
Stora Enso Oyj (Helsinki Stock Exchange: STEAV) is an integrated paper, packaging, and forest products company headquartered in Finland. In 2007, Stora Enso reported net sales of €13,373.6 million and had 788,619,987 shares outstanding. Calculate the P/S for Stora Enso based on a closing price of €8.87 on 12 February 2008.
Solution: Sales per share = €13,373.6 million/788,619,987 shares = €16.96. So, P/S = €8.87/€16.96 = 0.523.
Although the determination of sales is more straightforward than the determination of earnings, the analyst should evaluate a company’s revenue recognition practices—in particular those tending to speed up the recognition of revenues—before relying on the P/S multiple. An analyst using a P/S approach who does not also assess the quality of accounting for sales may place too high a value on the company’s shares. Example 6-23 illustrates the problem.
EXAMPLE 6-23 Revenue Recognition Practices (1)
Analysts label stock markets bubbles when market prices appear to lose contact with intrinsic values. To many analysts, the run-up in the prices of Internet stocks in the U.S. market in the 1998-2000 period represented a bubble. During that period, many analysts adopted P/S as a metric for valuing the many Internet stocks that had negative earnings and cash flow. Perhaps at least partly as a result of this practice, some Internet companies engaged in questionable revenue recognition practices to justify their high valuations. To increase sales, some companies engaged in bartering web site advertising with other Internet companies. For example, InternetRevenue.com might barter $1,000,000 worth of banner advertising with RevenueIsUs.com. Each could then show $1,000,000 of revenue and $1,000,000 of expenses. Although neither had any net income or cash flow, each company’s revenue growth and market valuation was enhanced (at least temporarily). In addition the value placed on the advertising was frequently questionable.
As a result of these and other questionable activities, the U.S. Securities and Exchange Commission (SEC) issued a stern warning to companies and formalized revenue recognition practices for barter in Staff Accounting Bulletin No. 101. Similarly, international accounting standard setters issued Standing Interpretations Committee Interpretation 31 to define revenue recognition principles for barter transactions involving advertising services. The analyst should review footnote disclosures to assess whether a company may be recognizing revenue prematurely or otherwise aggressively.
Example 6-24 illustrates another classic instance in which an analyst should look behind the accounting numbers.
EXAMPLE 6-24 Revenue Recognition Practices (2)
Sales on a bill-and-hold basis involve selling products but not delivering those products until a later date.159 Sales on this basis have the effect of accelerating sales into an earlier reporting period. The following is a typical case. In its Form 10-K filed 6 March 1998, for the fiscal year ended 28 December 1997, Sunbeam Corporation provided the following footnote:
1. OPERATIONS AND SIGNIFICANT ACCOUNTING POLICIES REVENUE RECOGNITION
The Company recognizes revenues from product sales principally at the time of shipment to customers. In limited circumstances, at the customer’s request the Company may sell seasonal product on a bill and hold basis provided that the goods are completed, packaged and ready for shipment, such goods are segregated and the risks of ownership and legal title have passed to the customer. The amount of such bill and hold sales at 29 December 1997 was approximately 3 percent of consolidated revenues. Net sales are comprised of gross sales less provisions for expected customer returns, discounts, promotional allowances and cooperative advertising.
After internal and SEC investigations, the company restated its financial results and revenue recognition policy:
REVENUE RECOGNITION
The Company recognizes sales and related cost of goods sold from product sales when title passes to the customers which is generally at the time of shipment. Net sales is comprised of gross sales less provisions for estimated customer returns, discounts, promotional allowances, cooperative advertising allowances and costs incurred by the Company to ship product to customers. Reserves for estimated returns are established by the Company concurrently with the recognition of revenue. Reserves are established based on a variety of factors, including historical return rates, estimates of customer inventory levels, the market for the product and projected economic conditions. The Company monitors these reserves and makes adjustment to them when management believes that actual returns or costs to be incurred differ from amounts recorded. In some situations, the Company has shipped product with the right of return where the Company is unable to reasonably estimate the level of returns and/or the sale is contingent upon the resale of the product. In these situations, the Company does not recognize revenue upon product shipment, but rather when it is reasonably expected the product will not be returned.
The company had originally reported revenue of $1,168,182,000 for the fiscal year ended 31 December 1997. After restatement, the company reported revenue of $1,073,000,000 for the same period—a more than 8 percent reduction in revenue. The analyst reading the footnote in the original report would have noted the bill-and-hold practices and reduced revenue by 3 percent. This company engaged in other accounting practices tending to inflate revenue that did not come to light until the investigation.
Examples 6-23 and 6-24 dealt with situations that occurred some years ago. It should not be assumed, however, that all aggressive revenue recognition practices have now been eliminated. Example 6-25 briefly summarizes a more recent example.
Sometimes, as in the Sunbeam example, even when a company discloses its revenue recognition practices, the analyst cannot determine precisely by how much sales may be overstated. If a company is engaging in questionable revenue recognition practices and the amount being manipulated is unknown, the analyst might do well to suggest avoiding investment in that company’s securities. At the very least, the analyst should be skeptical and assign the company a higher risk premium than otherwise, which would result in a lower justified P/S.
EXAMPLE 6-25 Revenue Recognition Practices (3)
In February 2008, Diebold Inc., a manufacturer of security systems, automated teller machines, and voting machines announced that it had determined that “its previous, long-standing method of accounting for bill and hold transactions was in error, representing a misapplication of generally accepted accounting principles, and that it would discontinue its use of bill and hold as a method of revenue recognition in its North America and International businesses” (from Diebold’s Form 8-K filed with the SEC on 8 February 2008). The company announced it would restate its financial statements back to fiscal year 2003.
3.3.2. Valuation Based on Forecasted Fundamentals
Like other multiples, P/S can be linked to DCF models. In terms of the Gordon growth model, we can state P/S as160
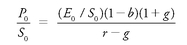 where E0/S0is the business’s profit margin. Although the profit margin is stated in terms of trailing sales and earnings, the analyst may use a long-term forecasted profit margin in Equation 6-6. Equation 6-6 states that the justified P/S is an increasing function of the profit margin and earnings growth rate, and the intuition behind Equation 6-6 generalizes to more complex DCF models.
Profit margin is a determinant of the justified P/S not only directly but also through its effect on g. We can illustrate this concept by restating the equation for the sustainable growth rate [g = (Retention rate, b) x ROE], as follows: where PM0 is profit margin and the last three terms come from the DuPont analysis of ROE. An increase (decrease) in the profit margin produces a higher (lower) sustainable growth rate as long as sales do not decrease (increase) proportionately.161 Example 6-26 illustrates the use of justified P/S and how to apply it in valuation.
EXAMPLE 6-26 Justified P/S Based on Forecasted Fundamentals
As a health care analyst, you are valuing the stocks of three medical equipment manufacturers, including the Swedish company Getinge AB (Stockholm: GETI) in July 2008. Based on an average of estimates obtained from a capital asset pricing model (CAPM) and a bond yield plus risk premium, you estimate that GETI’s required rate of return is 11 percent. Your other forecasts are as follows:
• Long-term profit margin = 8.2 percent
• Dividend payout ratio = 30 percent
• Earnings growth rate = 10 percent
Although GETI’s profit margin in the most recent year was 7.7 percent, the company’s average profit margin over the previous five years was 8.8 percent. An earnings growth rate of 10 percent is close to the median analyst forecast, according to Thomson First Call. To obtain a first estimate of GETI’s justified P/S based on forecasted fundamentals, you use Equation 6-6.
1. Based on these data, calculate GETI’s justified P/S.
2. Given a forecast of GETI’s sales per share (in Swedish krona) for 2008 of SEK64.40, estimate the intrinsic value of GETI stock.
3. Given a market price for GETI of SEK138 on 9 July 2008 and your answer to problem 2, state whether GETI stock appears to be fairly valued, overvalued, or undervalued.
Solution to 1: From Equation 6-6, GETI’s justified P/S is calculated as follows: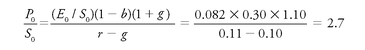
Solution to 2: An estimate of the intrinsic value of GETI stock is 2.7 x SEK64.40 = SEK173.88.
Solution to 3: GETI stock appears to be undervalued because its current market value of SEK138 is less than its estimated intrinsic value of SEK173.88.
3.3.3. Valuation Based on Comparables
Using P/S in the method of comparables to value stocks follows the steps given in Section 3.1.5. As mentioned earlier, P/S ratios are usually reported on the basis of trailing sales. Analysts may also base relative valuations on P/S multiples calculated on forecasted sales. In doing so, analysts may make their own sales forecasts or may use forecasts supplied by data vendors.162 In valuing stocks using the method of comparables, analysts should also gather information on profit margins, expected earnings growth, and risk. As always, the quality of accounting also merits investigation. Example 6-27 illustrates the use of P/S in the comparables approach.
EXAMPLE 6-27 P/S Comparables Approach
Continuing with the project to value Getinge AB, you have compiled the information on GETI and peer companies Smith & Nephew PLC (London: SN) and CR Bard Inc. (NYSE: BCR) given in Exhibit 6-13.
EXHIBIT 6-13 P/S Comparables (as of 9 July 2008)
Source: Thomas First Call.
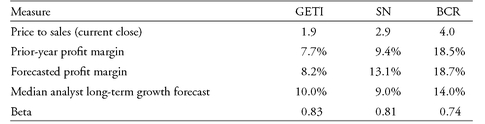
Use the data in Exhibit 6-13 to address the following:
1. Based on the P/S (calculated from the current close) but referring to no other information, assess GETI’s relative valuation.
2. State whether GETI is more closely comparable to SN or to BCR. Justify your answer.
Solution to 1: Because the P/S for GETI, 1.9, is the lowest of the three P/S multiples, if no other information is referenced, GETI appears to be relatively undervalued. Solution to 2: On the basis of the information given, GETI appears to be more closely matched to SN than BCR. The profit margin, the growth rate, and risk are key fundamentals in the P/S approach, and GETI’s profit margin and expected growth rate are closer to those of SN. Furthermore, the risk of GETI stock as measured by beta is closer to SN than to BCR.
3.4. Price to Cash Flow
Price to cash flow is a widely reported valuation indicator. According to the Merrill Lynch Institutional Factor Survey, price to cash flow, on average, was more widely used in investment practice than P/E, P/B, P/S, or dividend yield in the 1989-2005 period among the institutional investors surveyed; in 2006, the use of price to cash flow was approximately the same as P/E and P/B but was still higher than P/S or dividend yield.
In this section, we present price to cash flow based on alternative major cash flow concepts.163 Because of the wide variety of cash flow concepts in use, the analyst should be especially careful to understand (and communicate) the exact definition of cash flow that is the basis for the analysis.
Analysts have offered the following rationales for the use of price to cash flow:
• Cash flow is less subject to manipulation by management than earnings.
• Because cash flow is generally more stable than earnings, price to cash flow is generally more stable than P/E.
• Using price to cash flow rather than P/E addresses the issue of differences in accounting conservatism between companies (differences in the quality of earnings).
• Differences in price to cash flow may be related to differences in long-run average returns, according to empirical research.164
Possible drawbacks to the use of price to cash flow include the following:
• When cash flow from operations is defined as EPS plus noncash charges, items affecting actual cash flow from operations, such as noncash revenue and net changes in working capital, are ignored. So, for example, aggressive recognition of revenue (front-end loading) would not be accurately captured in the earnings-plus-noncash-charges definition because the measure would not reflect the divergence between revenues as reported and actual cash collections related to that revenue.
• Theory views free cash flow to equity (FCFE) rather than cash flow as the appropriate variable for price-based valuation multiples. We can use P/FCFE but FCFE does have the possible drawback of being more volatile than cash flow for many businesses. FCFE is also more frequently negative than cash flow.
• As analysts’ use of cash flow has increased over time, some companies have increased their use of accounting methods that enhance cash flow measures. Operating cash flow, for example, can be enhanced by securitizing accounts receivable to speed up a company’s operating cash inflow or by outsourcing the payment of accounts payable to slow down the company’s operating cash outflow (while the outsource company continues to make timely payments and provides financing to cover any timing differences). Mulford and Comiskey (2005) describe a number of opportunistic accounting choices that companies can make to increase their reported operating cash flow.
One approximation of cash flow in practical use is EPS plus depreciation, amortization, and depletion. Even this simple approximation can be used to highlight issues of interest to the analyst in valuation, as Example 6 -28 shows.
EXAMPLE 6-28 Accounting Methods and Cash Flow
Consider two hypothetical companies, Company A and Company B, that have constant cash revenues and cash expenses (as well as a constant number of shares outstanding) in 2007, 2008, and 2009. In addition, both companies incur total depreciation of $15.00 per share during the three-year period and both use the same depreciation method for tax purposes. The two companies use different depreciation methods, however, for financial reporting. Company A spreads the depreciation expense evenly over the three years (straight-line depreciation, SLD). Because its revenues, expenses, and depreciation are constant over the period, Company A’s EPS is also constant. In this example Company A’s EPS is assumed to be $10 each year, as shown in Column 1 in Exhibit 6-14.
Company B is identical to Company A except that it uses accelerated depreciation. Company B’s depreciation is 150 percent of SLD in 2007 and declines to 50 percent of SLD in 2009, as shown in Column 5.
EXHIBIT 6-14 Earnings Growth Rates and Cash Flow (all amounts per share)
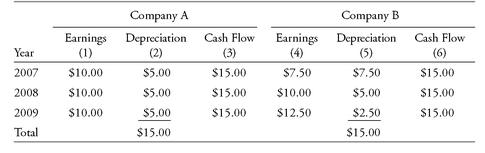
Because of the different depreciation methods used by Company A and Company B for financial reporting purposes, Company A’s EPS is flat at $10.00 (Column 1) whereas Company B’s EPS (Column 4) shows 29 percent compound growth: ($12.50/$7.50)½ -1.00 = 0.29. Thus, Company B appears to have positive earnings momentum. Analysts comparing Companies A and B might be misled by using the EPS numbers as reported instead of putting EPS on a comparable basis. For both companies, however, cash flow per share is level at $15.
Depreciation may be the simplest noncash charge to understand; write-offs and other noncash charges may offer more latitude for the management of earnings.
3.4.1. Determining Cash Flow
In practice, analysts and data vendors often use simple approximations of cash flow from operations in calculating cash flow for price to cash flow analysis. For many companies, depreciation and amortization are the major noncash charges regularly added to net income in the process of calculating cash flow from operations by the add-back method, so the approximation focuses on them. A representative approximation specifies cash flow per share as EPS plus per-share depreciation, amortization, and depletion.165 We call this estimation the “e arnings-plus-noncash-charges” definition and in this section, use the acronym CF for it. Keep in mind, however, that this definition is only one commonly used in calculating price to cash flow, not a technically accurate definition from an accounting perspective. We will also describe more technically accurate cash flow concepts: cash flow from operations, free cash flow to equity, and EBITDA (an estimate of pre-interest, pretax operating cash flow).166
Most frequently, trailing price to cash flows is reported. A trailing price to cash flow is calculated as the current market price divided by the sum of the most recent four quarters’ cash flow per share. A fiscal-year definition is also possible, as in the case of EPS.
Example 6 -29 illustrates the calculation of P/CF with cash flow defined as earnings plus noncash charges.
EXAMPLE 6-29 Calculating Price to Cash Flow with Cash Flow Defined as Earnings Plus Noncash Charges
In 2007, Koninklijke Philips Electronics N.V. (AEX: PHIA and NYSE: PHG) reported net income from continuing operations of €4,728 million, equal to EPS of €4.30. The company’s depreciation and amortization was €1,083 million, or €0.99 per share. An AEX price for PHIA as of early March 2008 was €25.90. Calculate the P/CF for PHIA.
Solution: CF (defined as EPS plus per-share depreciation, amortization, and depletion) is €4.30 + €0.99 = €5.29 per share. Thus, P/CF = €25.90/€5.29 = 4.9.
Rather than use an approximate EPS-plus-noncash charges concept of cash flow, analysts can use cash flow from operations (CFO) in a price multiple. CFO is to be found in the statement of cash flows. Similar to the adjustments to normalize earning, adjustments to CFO for components not expected to persist into future time periods may also be appropriate. In addition, adjustments to CFO may be required when comparing companies that use different accounting standards. For example, under IFRS, companies can classify interest payments either as operating cash flows or as financing cash flows, but U.S. GAAP requires companies to classify interest payments as operating cash flows.
As an alternative to CF and CFO, the analyst can relate price to FCFE, the cash flow concept with the strongest link to valuation theory. Because the amounts of capital expenditures in proportion to CFO generally differ among companies being compared, the analyst may find that rankings by price to cash flow from operations (P/CFO) and by P/CF will differ from rankings by P/FCFE. Period-by-period FCFE may be more volatile than CFO (or CF), however, so a trailing P/FCFE is not necessarily more informative in a valuation. For example, consider two similar businesses with the same CFO and capital expenditures over a two-year period. If the first company times its capital expenditures to fall toward the beginning of the period and the second times its capital expenditures to fall toward the end of the period, the P/FCFEs for the two stocks may differ sharply without representing a meaningful economic difference.167 This concern can be addressed, at least in part, by using price to average free cash flow, as in Hackel, Livnat, and Rai (1994).
Another cash flow concept used in multiples is EBITDA (earnings before interest, taxes, depreciation, and amortization).168 To forecast EBITDA, analysts usually start with their projections of EBIT and simply add depreciation and amortization to arrive at an estimate for EBITDA. In calculating EBITDA from historical numbers, one can start with earnings from continuing operations, excluding nonrecurring items. To that earnings number, interest, taxes, depreciation, and amortization are added.
In practice, both EV/EBITDA and P/EBITDA have been used by analysts as valuation metrics. EV/EBITDA has been the preferred metric, however, because its numerator includes the value of debt; therefore, it is the more appropriate method because EBITDA is pre-interest and is thus a flow to both debt and equity. EV/EBITDA is discussed in detail in a later section.
3.4.2. Valuation Based on Forecasted Fundamentals
The relationship between the justified price to cash flow and fundamentals follows from the familiar mathematics of the present value model. The justified price to cash flow, all else being equal, is inversely related to the stock’s required rate of return and positively related to the growth rate(s) of expected future cash flows (however defined). We can find a justified price to cash flow based on fundamentals by finding the value of a stock using the most suitable DCF model and dividing that number by cash flow (based on our chosen definition of cash flow). Example 6-30 illustrates the process.
EXAMPLE 6-30 Justified Price to Cash Flow Based on Forecasted Fundamentals
As a technology analyst, you are working on the valuation of Western Digital (NYSE: WDC), a manufacturer of hard disk drives. As a first estimate of value, you are applying an FCFE model under the assumption of a stable long-term growth rate in FCFE: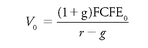 where g is the expected growth rate of FCFE. You estimate trailing FCFE at $1.34 per share and trailing CF (based on the earnings-plus-noncash-charges definition) at $5.43. Your other estimates are an 11.5 percent required rate of return and an 8.0 percent expected growth rate of FCFE.
1. What is the intrinsic value of WDC according to a constant-growth FCFE model?
2. What is the justified P/CF based on forecasted fundamentals?
3. What is the justified P/FCFE based on forecasted fundamentals?
Solution to 1: Calculate intrinsic value as (1.080 × $1.34)/(0.115 - 0.080) = $41.35. Solution to 2: Calculate a justified P/CF based on forecasted fundamentals as $41.35/$5.43 = 7.6.
Solution to 3: The justified P/FCFE is $41.35/$1.34 = 30.9.
3.4.3. Valuation Based on Comparables
The method of comparables for valuing stocks based on price to cash flow follows the steps given previously and illustrated for P/E, P/B, and P/S. Example 6-31 is a simple exercise in the comparable method based on price to cash flow measures.
EXAMPLE 6-31 Price to Cash Flow and Comparables
Exhibit 6-15 provides information on P/CF, P/FCFE, and selected fundamentals as of 16 April 2008 for two hypothetical companies. Using the information in Exhibit 6-15, compare the valuations of the two companies.
EXHIBIT 6-15 Comparison of Two Companies (all amounts are per share)
Company A is selling at a P/CF (9.8) approximately 14 percent smaller than the P/CF of Company B (11.4). Based on that comparison, we expect that, all else equal, investors would anticipate a higher growth rate for Company B. Contrary to that expectation, however, the consensus five-year earnings growth forecast for Company A is 280 basis points higher than it is for Company B. As of the date of the comparison, Company A appears to be relatively undervalued compared with Company B, as judged by P/CF and expected growth. The information in Exhibit 6-15 on FCFE supports the proposition that Company A may be relatively undervalued. The positive FCFE for Company A indicates that operating cash flows and new debt borrowing are more than sufficient to cover capital expenditures. Negative FCFE for Company B suggests the need for external funding of growth.
3.5. Price to Dividends and Dividend Yield
The total return on an equity investment has a capital appreciation component and a dividend yield component. Dividend yield data are frequently reported to provide investors with an estimate of the dividend yield component in total return. Dividend yield is also used as a valuation indicator. According to the 2007 Merrill Lynch Institutional Factor Survey, from 1989 to 2006, on average, slightly more than one-quarter of respondents reported using dividend yield as a factor in the investment process.
Analysts have offered the following rationales for using dividend yields in valuation:
• Dividend yield is a component of total return.
• Dividends are a less risky component of total return than capital appreciation.
Possible drawbacks of using dividend yields include the following:
• Dividend yield is only one component of total return; not using all information related to expected return is suboptimal.
• Investors may trade off future earnings growth to receive higher current dividends. That is, holding return on equity constant, dividends paid now displace earnings in all future periods (a concept known as the dividend displacement of earnings).169
• The argument about the relative safety of dividends presupposes that market prices reflect in a biased way differences in the relative risk of the components of return.
3.5.1. Calculation of Dividend Yield
This chapter so far has presented multiples with market price (or market capitalization) in the numerator. Price-to-dividend (P/D) ratios have sometimes appeared in valuation, particularly with respect to indexes. Many stocks, however, do not pay dividends, and the P/D ratio is undefined with zero in the denominator. For such non -dividend-paying stocks, dividend yield is defined: It is equal to zero. For practical purposes, then, dividend yield is the preferred way to present this multiple.
Trailing dividend yield is generally calculated by using the dividend rate divided by the current market price per share. The annualized amount of the most recent dividend is known as the dividend rate. For companies paying quarterly dividends, the dividend rate is calculated as four times the most recent quarterly per-share dividend. (Some data sources use the dividends in the last four quarters as the dividend rate for purposes of a trailing dividend yield.) For companies that pay semiannual dividends comprising an interim dividend that typically differs in magnitude from the final dividend, the dividend rate is usually calculated as the most recent annual per-share dividend.
The dividend rate indicates the annual amount of dividends per share under the assumption of no increase or decrease over the year. The analyst’s forecast of leading dividends could be higher or lower and is the basis of the leading dividend yield. The leading dividend yield is calculated as forecasted dividends per share over the next year divided by the current market price per share. Example 6-32 illustrates the calculation of dividend yield.
EXAMPLE 6-32 Calculating Dividend Yield
Exhibit 6-16 gives quarterly dividend data for Procter & Gamble (NYSE: PG) and semiannual dividend data for the ADRs of Unilever PLC (NYSE:UL).
EXHIBIT 6-16 Dividends Paid per Share for Procter & Gamble and for Unilever ADRs
Source: Value Line.
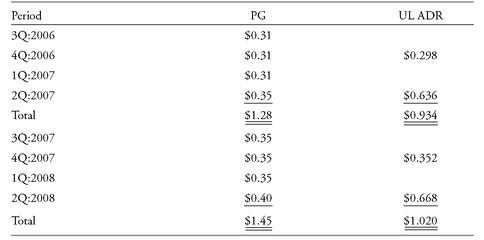
1. Given a price per share for PG of $62.86, calculate this company’s trailing dividend yield.
2. Given a price per ADR for UL of $33.62, calculate the trailing dividend yield for the ADRs.
Solution to 1: The dividend rate for PG is $0.40 x 4 = $1.60. The dividend yield is $1.60/$62.86 = 0.0255 or 2.5 percent.
Solution to 2: Because UL pays semiannual dividends that differ in magnitude between the interim and final dividends, the dividend rate for UL’s ADR is the total dividend in the most recent year, $1.020. The dividend yield is $1.020/$33.62 = 0.0303 or 3.0 percent.
3.5.2. Valuation Based on Forecasted Fundamentals
The relationship of dividend yield to fundamentals can be illustrated in the context of the Gordon growth model. From that model, we obtain the expression
Equation 6-7 shows that dividend yield is negatively related to the expected rate of growth in dividends and positively related to the stock’s required rate of return. The first point implies that the selection of stocks with relatively high dividend yields is consistent with an orientation to a value rather than growth investment style.
3.5.3. Valuation Based on Comparables
Using dividend yield with comparables is similar to the process that has been illustrated for other multiples. An analyst compares a company with its peers to determine whether it is attractively priced, considering its dividend yield and risk. The analyst should examine whether differences in expected growth explain the differences in dividend yield. Another consideration used by some investors is the security of the dividend (the probability that it will be reduced or eliminated). A useful metric in assessing the safety of the dividend is the payout ratio: A high payout relative to other companies operating in the same industry may indicate a less secure dividend because the dividend is less well covered by earnings. Balance sheet metrics are equally important in assessing the safety of the dividend, and relevant ratios to consider include the interest coverage ratio and the ratio of net debt to EBITDA. Example 6-33 illustrates use of the dividend yield in the method of comparables.
EXAMPLE 6-33 Dividend Yield Comparables
William Leiderman is a portfolio manager for a U.S. pension fund’s domestic equity portfolio. The portfolio is exempt from taxes, so any differences in the taxation of dividends and capital gains are not relevant. Leiderman’s client requires high current income. Leiderman is considering the purchase of utility stocks for the fund in July 2008. He has narrowed down his selection to four large-cap U.S. electric utilities. Exhibit 6-17 presents selected information on the stocks.
EXHIBIT 6-17 Using Dividend Yield to Compare Stocks
Source: Yahoo! Finance.
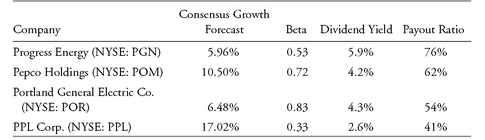
All of the securities exhibit similar low market risk; they each have a beta less than 1.00. Although PGN has the highest dividend yield, it also has the lowest expected growth rate. PGN’s dividend payout ratio of 76 percent, the highest of the group, also suggests that its dividend may be subject to greater risk. Leiderman determines that PPL provides the greatest combination of dividend yield and expected growth—nearly 20 percent.
4. ENTERPRISE VALUE MULTIPLES
Enterprise value multiples are multiples that relate the enterprise value of a company to some measure of value (typically, a pre-interest income measure). Perhaps the most frequently advanced argument for using enterprise value multiples rather than price multiples in valuation is that enterprise value multiples are relatively less sensitive to the effects of financial leverage than price multiples when one is comparing companies that use differing amounts of leverage. Enterprise value multiples, in defining the numerator as they do, take a control perspective (discussed in more detail later). Thus, even where leverage differences are not an issue, enterprise value multiples may complement the perspective of price multiples. Indeed, although some analysts strictly favor one type of multiple, other analysts report both price and enterprise value multiples.
4.1. Enterprise Value to EBITDA
Enterprise value to EBITDA is by far the most widely used enterprise value multiple.
Earlier, EBITDA was introduced as an estimate of pre-interest, pretax operating cash flow. Because EBITDA is a flow to both debt and equity, as noted, defining an EBITDA multiple by using a measure of total company value in the numerator, such as EV, is appropriate. Recall that enterprise value is total company value (the market value of debt, common equity, and preferred equity) minus the value of cash and short-term investments. Thus, EV/EBITDA is a valuation indicator for the overall company rather than solely its common stock. If, however, the analyst can assume that the business’s debt and preferred stock (if any) are efficiently priced, the analyst can use EV/EBITDA to draw an inference about the valuation of common equity. Such an inference is often reasonable.
Analysts have offered the following rationales for using EV/EBITDA:
• EV/EBITDA is usually more appropriate than P/E alone for comparing companies with different financial leverage (debt), because EBITDA is a pre-interest earnings figure, in contrast to EPS, which is postinterest.
• By adding back depreciation and amortization, EBITDA controls for differences in depreciation and amortization among businesses, in contrast to net income, which is postdepreciation and postamortization. For this reason, EV/EBITDA is frequently used in the valuation of capital-intensive businesses (for example, cable companies and steel companies). Such businesses typically have substantial depreciation and amortization expenses.
• EBITDA is frequently positive when EPS is negative.
Possible drawbacks to using EV/EBITDA include the following:170
• EBITDA will overestimate cash flow from operations if working capital is growing. EBITDA also ignores the effects of differences in revenue recognition policy on cash flow from operations.
• Free cash flow to the firm (FCFF), which directly reflects the amount of the company’s required capital expenditures, has a stronger link to valuation theory than does EBITDA. Only if depreciation expenses match capital expenditures do we expect EBITDA to reflect differences in businesses’ capital programs. This qualification to EBITDA comparisons may be particularly meaningful for the capital-intensive businesses to which EV/EBITDA is often applied.
4.1.1. Determining Enterprise Value
We illustrated the calculation of EBITDA previously. As discussed, analysts commonly define enterprise value as follows:
Cash and investments (sometimes termed nonearning assets) are subtracted because EV is designed to measure the net price an acquirer would pay for the company as a whole. The acquirer must buy out current equity and debt providers but then receives access to the cash and investments, which lower the net cost of the acquisition. (For example, cash and investments can be used to pay off debt or loans used to finance the purchase.) The same logic explains the use of market values: In repurchasing debt, an acquirer has to pay market prices. Some debt, however, may be private and it does not trade; some debt may be publicly traded but trade infrequently. When analysts do not have market values, they often use book values obtained from the balance sheet.173 Example 6-34 illustrates the calculation of EV/EBITDA.
EXAMPLE 6-34 Calculating EV/EBITDA
Western Digital Corporation (NYSE: WDC) manufactures hard disk drives. Exhibit 6-18 presents the company’s consolidated balance sheet as of 28 March 2008.
EXHIBIT 6-18 Western Digital Corporation Condensed Consolidated Balance Sheets (in millions except par values; unaudited)
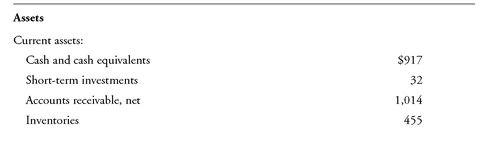
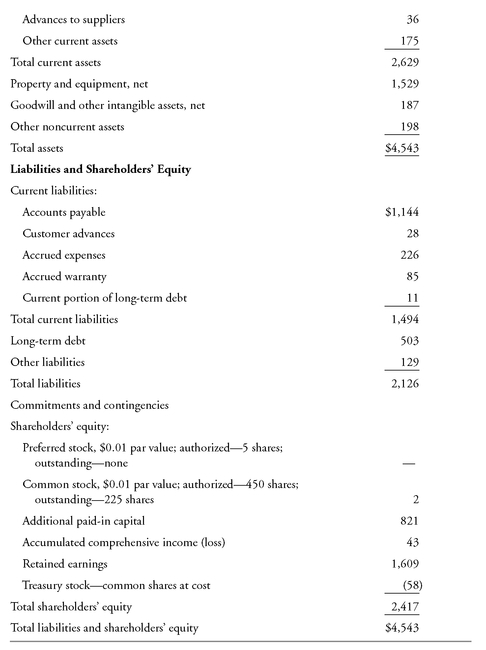
The balance sheet is labeled as unaudited because it is a quarterly balance sheet and U.S. companies are required to have audits only for their annual financial statements.
The income statement and statement of cash flows for the year ended 29 June 2007, and for the nine months ended 28 March 2008, and 30 March 2007, gave the following items (in millions):
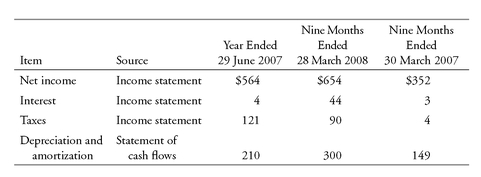
The company’s share price as of 11 July 2008 was $33.06. Based on the preceding information, calculate EV/EBITDA.
Solution:
• For EV, we first calculate the total value of WDC’s equity: 225 million shares outstanding times $33.06 price per share equals $7,439 million market capitalization. WDC has only one class of common stock, no preferred shares, and no minority interest. For companies that have multiple classes of common stock, market capitalization includes the total value of all classes of common stock. Similarly, for companies that have preferred stock and/or minority interest, the market value of preferred stock and the amount of minority interest are added to market capitalization. EV also includes the value of long-term debt. Per WDC’s balance sheet, the amount of long-term debt is $514 million ($503 million plus the current portion of $11 million). Typically, the book value of long-term debt is used in EV. If, however, the market value of the debt is readily available and materially different from the book value, the market value should be used. EV excludes cash, cash equivalents, and short-term investments. Per WDC’s balance sheet, the total of cash equivalents and short-term investments is $917 million + $32 million = $949 million. So WDC’s EV is $7,439 million + $514 million -$949 million = $7,004 million.
• For EBITDA, we first calculate the trailing 12 month (TTM) information using the first nine months of the current fiscal year plus the last three months of the prior fiscal year. For example, the TTM net income equals $654 million from the first nine months ending 28 March 2008, plus $212 million from the last three months of the previous fiscal year ($564 million minus $352 million). EBITDA is calculated as net income plus interest plus taxes plus depreciation and amortization. The TTM EBITDA totals $1,479 million. These calculations are summarized as follows:
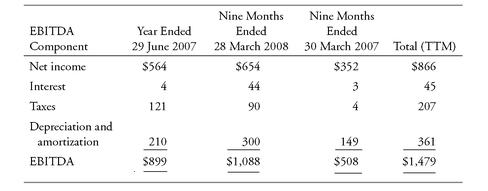
WDC does not have preferred equity. Companies that do have preferred equity typically present in their financial statements net income available to common shareholders. In those cases, the EBITDA calculation uses net income available to both preferred and common equity holders.
We conclude that EV/EBITDA = ($7,004 million)/($1,479 million) = 4.7.
4.1.2. Valuation Based on Forecasted Fundamentals
As with other multiples, intuition about the fundamental drivers of enterprise value to EBITDA can help when applying the method of comparables. All else being equal, the justified EV/EBITDA based on fundamentals should be positively related to the expected growth rate in free cash flow to the firm, positively related to expected profitability as measured by return on invested capital, and negatively related to the business’s weighted average cost of capital. Return on invested capital(ROIC) is calculated as operating profit after tax divided by total invested capital. In analyzing ratios such as EV/EBITDA, ROIC is the relevant measure of profitability because EBITDA flows to all providers of capital.
4.1.3. Valuation Based on Comparables
All else equal, a lower EV/EBITDA value relative to peers indicates that a company is relatively undervalued. An analyst’s recommendations, however, are usually not completely determined by relative EV/EBITDA; from an analyst’s perspective, EV/EBITDA is simply one piece of information to consider.
Example 6-35 presents a comparison of enterprise value multiples for four peer companies. The example includes a measure of total firm value, total invested capital(TIC), sometimes also known as the market value of invested capital, that is an alternative to enterprise value. Similar to EV, TIC includes the market value of equity and debt, but does not deduct cash and investments.
EXAMPLE 6-35 Comparable Enterprise Value Multiples
Exhibit 6-19 presents EV multiples for four companies in the data storage device industry: Western Digital Corporation (NYSE: WDC), NetApp (NASDAQ-GS: NTAP), EMC Corporation (NYSE: EMC), and Seagate Technology (NYSE: STX).
EXHIBIT 6-19 Enterprise Value Multiples for Industry Peers
Source: Companies’ annual reports; Yahoo! Finance; calculations.
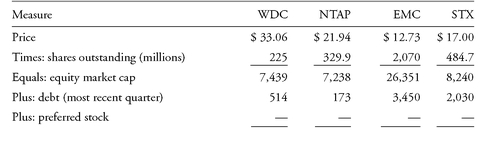
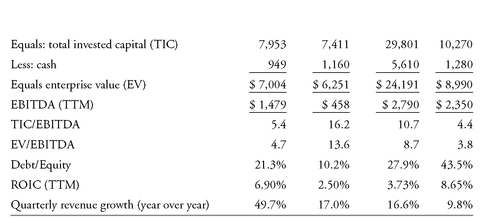
1. Exhibit 6-19 provides two alternative enterprise value multiples, TIC/EBITDA and EV/EBITDA. The ranking of the companies’ multiples is identical by both multiples. In general, what could cause the rankings to vary?
2. Each EBITDA multiple incorporates a comparison with enterprise value. How do these multiples differ from price to cash flow multiples?
3. Based solely on the information in Exhibit 6-19, how does the valuation of WDC compare with that of the other three companies?
Solution to 1: The difference between TIC and EV is that EV excludes cash, cash equivalents, and marketable securities. So a material variation among companies in cash, cash equivalents, or marketable securities relative to EBITDA could cause the rankings to vary. Solution to 2: These multiples differ from price to cash flow multiples in that the numerator is a measure of firm value rather than share price, to match the denominator which is a pre-interest measure of earnings. These multiples thus provide a more appropriate comparison than price to cash flow when companies have significantly different capital structures.
Solution to 3: Based on its lower TIC/EBITDA and EV/EBITDA multiples of 5.4 and 4.7, respectively, WDC appears undervalued relative to NTAP and EMC. In addition, WDC has a higher ROIC and higher revenue growth than NTAP and EMC, which supports the appearance of undervaluation relative to these two companies. Compared with STX, the enterprise value multiples of WDC are slightly higher despite it being somewhat less profitable than STX (ROIC of 6.90 percent versus 8.65 percent). However, WDC’s lower leverage (a debt-to-equity ratio of 21.3 percent versus 43.5 percent) and faster growth rate (49.7 percent versus 9.8 percent) suggest that WDC’s higher enterprise value multiple is justified. The comparison between WDC and STX is inconclusive.
4.2. Other Enterprise Value Multiples
Although EV/EBITDA is the most widely known and used enterprise value multiple, other enterprise value multiples are used together with or in place of EV/EBITDA—either in a broad range of applications or for valuations in a specific industry. EV/FCFF is an example of a broadly used multiple; an example of a special-purpose multiple is EV/EBITDAR (where R stands for rent expense), which is favored by airline industry analysts. This section reviews the most common such multiples (except EV/sales, which is covered in the next section). In each case, a valuation metric could be formulated in terms of TIC rather than EV.
Major alternatives to using EBITDA in the denominator of enterprise value multiples include free cash flow to the firm (FCFF); earnings before interest, taxes, and amortization (EBITA); and earnings before interest and taxes (EBIT). Exhibit 6-20 summarizes the components of each of these measurements and how they relate to net income. Note that, in practice, analysts typically forecast EBITDA by forecasting EBIT and adding depreciation and amortization.
EXHIBIT 6-20 Alternative Denominators in Enterprise Value Multiples
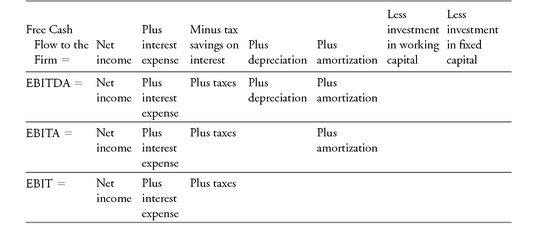
Note that the calculation of each of the measures given in Exhibit 6-20 adds interest back to net income, which reflects that these measures are flows relevant to all providers of both debt and equity capital. As one moves down the rows of Exhibit 6-20, the measures incorporate increasingly less precise information about a company’s tax position and its capital investments, although each measure has a rationale. For example, EBITA may be chosen in cases in which amortization (associated with intangibles) but not depreciation (associated with tangibles) is a major expense for companies being compared. EBIT may be chosen where neither depreciation nor amortization is a major item.
In addition to enterprise value multiples based on financial measures, in some industries or sectors, the analyst may find it appropriate to examine enterprise value multiples based on a nonfinancial measurement that is specific to that industry or sector. For example, for satellite and cable TV broadcasters, an analyst might usefully examine EV to subscribers. For a resource-based company, a multiple based on reserves of the resource may be appropriate.
Regardless of the specific denominator used in an enterprise value multiple, the concept remains the same—namely, to relate the market value of the total company to some fundamental financial or nonfinancial measure of the company’s value.
4.3. Enterprise Value to Sales
Enterprise value to sales is a major alternative to the price-to-sales ratio. The P/S multiple has the conceptual weakness that it fails to recognize that for a debt-financed company, not all sales belong to a company’s equity investors. Some of the proceeds from the company’s sales will be used to pay interest and principal to the providers of the company’s debt capital. For example, a P/S for a company with little or no debt would not be comparable to a P/S for a company that is largely financed with debt. EV/S would be the basis for a valid comparison in such a case. In summary, EV/S is an alternative sales-based ratio that is particularly useful when comparing companies with diverse capital structures. Example 6-36 illustrates the calculation of EV/S multiples.
EXAMPLE 6-36 Calculating Enterprise Value to Sales
As described in Example 6-22, Stora Enso Oyj (Helsinki Stock Exchange: STEAV) reported net sales of €13,373.6 million for 2007. Based on 788,619,987 shares outstanding and a stock price of €8.87 on 12 February 2008, the total market value of the company’s equity was €6,995.1 million. The company reported debt of €4,441.5 million, minority interest of €71.9 million, and cash of €970.7 million. Assume that the market value of the company’s debt is equal to the amount reported. Calculate the company’s EV/S.
Solution: Enterprise value = €6,995.1 million + €4,441.5 million + €71.9 million - €970.7 million = €10,537.8 million. Thus, EV/S = €10,537.8 million/€13,373.6 million = 0.79.
4.4. Price and Enterprise Value Multiples in a Comparable Analysis: Some Illustrative Data
In previous sections, we explained the major price and enterprise value multiples. Analysts using multiples and a benchmark based on closely similar companies should be aware of the range of values for multiples for peer companies and should track the fundamentals that may explain differences. For the sake of illustration Exhibit 6-21 shows, for fiscal year 2007, the median value of various multiples by GICS economic sector, the median dividend payout ratio, and median values of selected fundamentals:
• ROE and its determinants (net profit margin, asset turnover, and financial leverage).
• The compound average growth rate in operating margin for the three years ending with FY 2007 (shown in the last column under “3-Year CAGR Op Margin”)
Exhibit 6-21 is based on the Standard & Poor’s Super 1500 Composite Index for U.S. equities consisting of the S&P 500, the S&P Midcap 400 Index, and the S&P SmallCap 600 Index. GICS was previously described in Section 3.1.5.
At the level of aggregation shown in Exhibit 6-21, the data are, arguably, most relevant to relative sector valuation. For the purposes of valuing individual companies, analysts would most likely use more narrowly defined industry or sector classification.
EXHIBIT 6-21 Fundamental and Valuation Statistics by GICS Economic Sector: Median Values from S&P 1500, FY2007
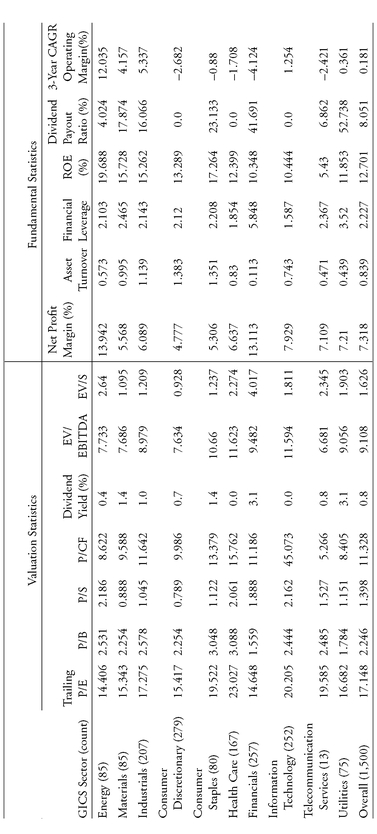
5. INTERNATIONAL CONSIDERATIONS WHEN USING MULTIPLES
Clearly, to perform a relative-value analysis, an analyst must use comparable companies and underlying financial data prepared by applying comparable methods. Therefore, using relative-valuation methods in an international setting is difficult. Comparing companies across borders frequently involves differences in accounting methods, cultural differences, economic differences, and resulting differences in risk and growth opportunities. P/Es for individual companies in the same industry but in different countries have been found to vary widely.174 Furthermore, P/Es of different national markets often vary substantially at any single point in time.
Although international accounting standards are converging, significant differences still exist across borders, sometimes making comparisons difficult. Even when harmonization of accounting principles is achieved, the need to adjust accounting data for comparability will remain. As we showed in earlier sections, even within a single country’s accounting standards, differences between companies result from accounting choices (e.g., FIFO versus LIFO). Prior to 2008, the U.S. SEC required non-U.S. companies whose securities trade in U.S. markets to provide a reconciliation between their earnings from home-country accounting principles to U.S. GAAP. This requirement not only assisted the analyst in making necessary adjustments but also provided some insight into appropriate adjustments for other companies not required to provide this data. In December 2007, however, the SEC eliminated the reconciliation requirement for non-U.S. companies that use IFRS. Research analyzing reconciliations by EU companies with U.S. listings shows that most of those companies reported net income under IFRS that was higher than they would have reported under U.S. GAAP and lower shareholders’ equity than they would have under U.S. GAAP, with a result that more of the sample companies reported higher ROE under IFRS than under U.S. GAAP (Henry, Lin, and Yang 2008).
Exhibit 6-22 presents a reconciliation from IFRS to U.S. GAAP for Nokia Corporation (NYSE: NOK).
EXHIBIT 6-22 Principal Differences between IFRS and U.S. GAAP for Nokia Corporation (years ended 31 December; Euro in millions)
Source: Nokia Corporation Annual Report in SEC Form 20-F, 2006.
In a study of companies filing such reconciliations to U.S. GAAP, Harris and Muller (1999) classified common differences into seven categories, as shown in Exhibit 6-23.
EXHIBIT 6-23 Reconciliation of IFRS to U.S. GAAP: Average Adjustment
The list in Exhibit 6-23 provides the analyst with some insight into areas where differences commonly arise. Although the average adjustments are presented here, however, adjustments for individual companies may vary considerably.
International accounting differences affect the comparability of all price multiples. Of the price multiples examined in this chapter, P/CFO and P/FCFE will generally be least affected by accounting differences. P/B, P/E, and multiples based on such concepts as EBITDA, which start from accounting earnings, will generally be the most affected.
6. MOMENTUM VALUATION INDICATORS
The valuation indicators we call momentum indicators relate either price or a fundamental, such as earnings, to the time series of their own past values or, in some cases, to the fundamental’s expected value. One style of growth investing uses positive momentum in various senses as a selection criterion, and practitioners sometimes refer to such strategies as growth/momentum investment strategies. Momentum indicators based on price, such as the relative-strength indicator we discuss here, have also been referred to as technical indicators. According to the Merrill Lynch Institutional Factor Survey, momentum indicators were among the most popular valuation indicators in use between 1989 and 2006.175 In this section, we review three representative momentum indicators: earnings surprise, standardized unexpected earnings, and relative strength.
To define standardized unexpected earnings, we define unexpected earnings(also called earnings surprise) as the difference between reported earnings and expected earnings:
where
UEt = unexpected earnings for quarter t
EPSt = reported EPS for quarter t
E(EPSt) = expected EPS for the quarter
For example, a stock with reported quarterly earnings of $1.05 and expected earnings of $1.00 would have a positive earnings surprise of $0.05. Often, the percent earnings surprise (i.e., earnings surprise divided by expected EPS) is reported by data providers; in this example, the percent earning surprise would be $0.05/$1.00 = 0.05 or 5 percent. When used directly as a valuation indicator, earnings surprise is generally scaled by a measure reflecting the variability or range in analysts’ EPS estimates. The principle is that the less disagreement among analysts’ forecasts, the more meaningful the EPS forecast error of a given size in relation to the mean. A way to accomplish such scaling is to divide unexpected earnings by the standard deviation of analysts’ earnings forecasts, which we refer to as the scaled earnings surprise. Example 6-37 illustrates the calculation of such a scaled earnings surprise.
EXAMPLE 6-37 Calculating Scaled Earnings Surprise by Using Analysts’ Forecasts
As of July 2008, the mean consensus earnings forecast for Koninklijke Philips Electronics (AEX: PHIA; NYSE: PHG) for the fiscal year ending December 2008 was €1.53. Of the 35 estimates, the low forecast was €1.02, the high forecast was €2.40, and the standard deviation was €0.28.
If actual reported earnings for 2008 come in equal to the high forecast, what would be the measure of the earnings surprise for Koninklijke Philips scaled to reflect the dispersion in analysts’ forecasts?
Solution: In this case, scaled earnings surprise would be (€2.40 - €1.53)/€0.28 = 3.11.
The rationale behind using earnings surprise is the thesis that positive surprises may be associated with persistent positive abnormal returns, or alpha. The same rationale lies behind a momentum indicator that is closely related to earnings surprise but more highly researched, namely, standardized unexpected earnings(SUE). The SUE measure is defined as
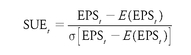
where
EPSt = actual EPS for time t E(EPSt) = expected EPS for time t σ[EPSt-E(EPSt)] = standard deviation of [EPS t - E(EPSt)] over some historical time period
In words, the numerator is the unexpected earnings at time t and the denominator is the standard deviation of past unexpected earnings over some period prior to time t—for example, the 20 quarters prior to t as in Latané and Jones (1979), the article that introduced the SUE concept.176 In SUE, the magnitude of unexpected earnings is scaled by a measure of the size of historical forecast errors or surprises. The principle is that the smaller (larger) the historical size of forecast errors, the more (less) meaningful a given size of EPS forecast error.
Suppose that for a stock with a $0.05 earnings surprise, the standard deviation of past surprises is $0.20. The $0.05 surprise is relatively small compared with past forecast errors, which would be reflected in a SUE score of $0.05/$0.20 = 0.25. If the standard error of past surprises were smaller—say, $0.07—the SUE score would be $0.05/$0.07 = 0.71. Example 6-38 applies analysis of SUE to two electronics companies.
EXAMPLE 6-38 Unexpected Earnings
Exhibits 6-24 and 6-25 provide information about the earnings surprise history for two companies: Sony Corporation (Tokyo: 6758; NYSE: SNE) and Koninklijke Philips Electronics (AEX: PHIA; NYSE: PHG).
EXHIBIT 6-24 Earnings Surprise History for Sony (in Japanese yen)
EXHIBIT 6-25 Earnings Surprise History for Koninklijke Philips
Source: Thomson Surprise Report.
1. Explain how Sony’s SUE score of 4.225 for the quarter ending March 2008 is calculated.
2. Based on these exhibits, for which company were the consensus forecasts less accurate over the past four quarters?
3. Interpret the amount of Sony’s “% Surprise” for the quarter ending March 2008 and explain why the sign of “% Surprise” differs from the sign of “SUE Score.”
Solution to 1: The amount of Sony’s unexpected earnings (i.e., its earnings surprise) for the quarter ending March 2008 was ¥28.950 - (-¥6.300) = ¥35.250. Dividing by the standard deviation of ¥8.344 gives a SUE score of 4.225.
Solution to 2: Over the past four quarters, the consensus forecasts were much less accurate for Sony than for Koninklijke Philips. The largest earnings surprise for Koninklijke Philips was for the quarter ending March 2008, in which the company’s actual EPS was 30.3 percent lower than the consensus forecast and the SUE score was -1.079. For Sony, the company’s actual earnings for the quarter ending June 2007 were almost twice as high as the consensus forecast (percent surprise of 93.8 percent) and the SUE score was 4.282. For the quarter ending March 2008, Sony’s SUE score was 4.225. Solution to 3: For the quarter ending March 2008, Sony reported earnings whereas the consensus forecast had been for a loss. Thus, the earnings surprise was positive; the company had much better results than anticipated, earning ¥35.250 more than the consensus forecast. The percent surprise is a negative number, however, because it shows the surprise as a percentage of the forecast (i.e., ¥35.250 divided by -¥6.300).
Another set of indicators, relative-strength indicators, compares a stock’s performance during a particular period either with its own past performance or with the performance of some group of stocks. The simplest relative-strength indicator that compares a stock’s performance during a period with its past performance is the stock’s compound rate of return over some specified time horizon, such as six months or one year. This indicator has also been referred to as a price momentum indicator in the academic literature. Despite its simplicity, this measure has been used in numerous studies (Chan et al. 1999; Lee and Swaminathan 2000). The rationale behind its use is the thesis that patterns of persistence or reversal exist in stock returns that may be shown empirically to depend on the investor’s time horizon (Lee and Swaminathan 2000).
Other definitions of relative strength relate a stock’s return over a recent period to its return over a longer period that includes the more recent period. For example, a classic study of technical momentum indicators (Brock, Lakonishok, and LeBaron 1992) examined trading strategies based on two technical rules—namely, a moving-average oscillator and a trading-range break (i.e., resistance and support levels)—in which buy and sell signals are determined by the relationship between a short period’s moving average and a longer period’s moving average (and bands around those averages). The reader should keep in mind that research on patterns of historical stock returns is notoriously vulnerable to data snooping and hindsight biases. Furthermore, investing strategies based purely on technical momentum indicators are viewed as inherently self-destructing, in that “once a useful technical rule (or price pattern) is discovered, it ought to be invalidated when the mass of traders attempts to exploit it” (Bodie, Kane, and Marcus 2008, 377). Yet the possibility of discovering a profitable trading rule and exploiting it prior to mass use continues to motivate research.
A simple relative-strength indicator of the second type (i.e., the stock’s performance relative to the performance of some group of stocks) is the stock’s performance divided by the performance of an equity index. If the value of this ratio increases, the stock price increases relative to the index and displays positive relative strength. Often, the relative-strength indicator is scaled to 1.0 at the beginning of the study period. If the stock goes up at a higher (lower) rate than the index, then relative strength will be above (below) 1.0. Relative strength in this sense is often calculated for industries and individual stocks. Example 6-39 explores this indicator.
EXAMPLE 6-39 Relative Strength in Relation to an Equity Index
Exhibit 6-26 shows the values of the S&P 500 and three exchange-traded funds (ETFs) for the end of each of 18 months from February 2007 through July 2008. The ETFs are for gold, the U.S. financial services sector, and U.S. utilities. SPDR stands for Standard & Poor’s Depositary Receipt, which is the ETF representing the S&P 500 Index.
EXHIBIT 6-26 NYSE Indexes
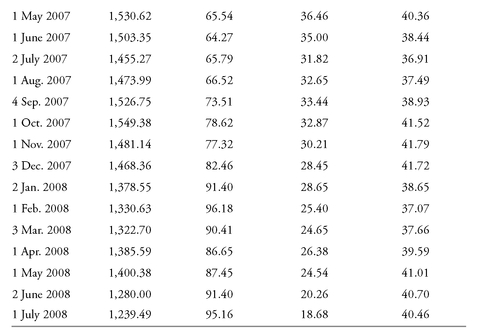
To produce the information for Exhibit 6-27, we divided each ETF value by the S&P 500 value for the same month and then scaled those results so that the value of the relative-strength indicator (RSTR) for February 2007 would equal 1.0. To illustrate, on 1 February 2007, the value of GLD divided by the S&P 500 was 66.48/1,406.82 = 0.0473. The RSTR for GLD on that date, by design, is then 0.0473/0.0473 = 1.0. In March, the value of GLD divided by the S&P 500 was 65.74/1,420.86 = 0.0463, which we scaled by the February number. The RSTR for 1 March 2007 for GLD is 0.0463/0.0473 = 0.9789, shown in Exhibit 6-27 as 0.979.
EXHIBIT 6-27 Relative-Strength Indicators

On the basis of Exhibits 6-26 and 6-27, address the following:
1. State the relative strength of gold, financial services, and utilities over the entire time period February 2007 through July 2008. Interpret the relative strength for each sector over that period.
2. Discuss the relative performance of the financial services ETF and the utilities ETF in the month of December 2007.
Solution to 1: The relative-strength indicator for gold is 1.625. This number represents 1.625-1.000 = 0.625, or 62.5 percent overperformance relative to the S&P 500 over the time period. The relative-strength indicator for the financial services ETF is 0.615. This number represents 1.000-0.615 = 0.385, or 38.5 percent underperformance relative to the S&P 500 over the time period. The relative-strength indicator for the utilities ETF is 1.242, indicating that the utilities ETF outperformed the S&P 500 by 24.2 percent over the time frame.
Solution to 2: The January 2008 RSTR for the financials ETF, at 0.848, is higher than in the prior month, whereas the utilities’ RSTR, at 1.067, is lower than in the prior month. In December 2007, the financials ETF outperformed the utilities ETF. The relative performance for that one month differs from the relative performance over the entire period, during which the utilities ETF significantly outperformed the financial services ETF.
Overall, momentum indicators have a substantial following among professional investors. Some view momentum indicators as signals that should prompt an analyst to consider whether a stock price is moving successively farther from or successively closer to the fundamental valuations derived from models and multiples. In other words, an analyst might be correct about the intrinsic value of a firm and the momentum indicators might provide a clue about when the market price will converge with that intrinsic value. The use of such indicators continues to be a subject of active research in industry and in business schools.
7. VALUATION INDICATORS: ISSUES IN PRACTICE
All the valuation indicators discussed in this chapter are quantitative aids but not necessarily solutions to the problem of security selection. In this section, we discuss some issues that arise in practice when averages are used to establish benchmark multiples and then illustrate the use of multiple valuation indicators.
7.1. Averaging Multiples: The Harmonic Mean
The harmonic mean and the weighted harmonic mean are often applied to average a group of price multiples.
Consider a hypothetical portfolio that contains two stocks. For simplicity, assume the portfolio owns 100 percent of the shares of each stock. One stock has a market capitalization of €715 million and earnings of €71.5 million, giving it a P/E of 10. The other stock has a market capitalization of €585 million and earnings of €29.25 million, for a P/E of 20. Note that the P/E for the portfolio is calculated directly by aggregating the companies’ market capitalizations and earnings: (€715 + €585)/(€71.50 + €29.25) = €1,300/€100.75 = 12.90. The question that will be addressed is: What calculation of portfolio P/E, based on the individual stock P/Es, best reflects the value of 12.90?
If the ratio of an individual holding is represented by Xi, the expression for the simple harmonic mean of the ratio is
(6-8)
which is the reciprocal of the arithmetic mean of the reciprocals. The expression for the weighted harmonic mean is
(6-9)
where the wi are portfolio value weights (summing to 1) and Xi > 0 for i= 1, 2, ..., n.
Exhibit 6-28 displays the calculation of the hypothetical portfolio’s simple arithmetic mean P/E, weighted mean P/E, (simple) harmonic mean P/E, and weighted harmonic mean P/E.
EXHIBIT 6-28 Alternative Mean P/Es
The weighted harmonic mean P/E precisely corresponds to the portfolio P/E value of 12.90. This example explains why index fund vendors frequently use the weighted harmonic mean to calculate the average P/E or average value of other price multiples for indexes. In some applications, an analyst might not want or be able to incorporate the market value weight information needed to calculate the weighted harmonic mean. In such cases, the simple harmonic mean can still be calculated.
Note that the simple harmonic mean P/E is smaller than the arithmetic mean and closer to the directly calculated value of 12.90 in this example. The harmonic mean inherently gives less weight to higher P/Es and more weight to lower P/Es. In general, unless all the observations in a data set have the same value, the harmonic mean is less than the arithmetic mean.
As explained and illustrated earlier in this chapter, using the median rather than the arithmetic mean to derive an average multiple mitigates the effect of outliers. The harmonic mean is sometimes also used to reduce the impact of large outliers—which are typically the major concern in using the arithmetic mean multiple—but not the impact of small outliers (i.e., those close to zero). The harmonic mean tends to mitigate the impact of large outliers. The harmonic mean may aggravate the impact of small outliers, but such outliers are bounded by zero on the downside.
We can use the group of telecommunications companies examined earlier in the chapter (see Exhibit 6-5) to illustrate differences between the arithmetic mean and harmonic mean. This group includes a large outlier for P/E, Equinix at a P/E of 702.61. Qwest’s P/E of 2.73 appears to be a small outlier. Exhibit 6-29 shows mean values including and excluding the outliers.
EXHIBIT 6-29 Arithmetic versus Harmonic Mean
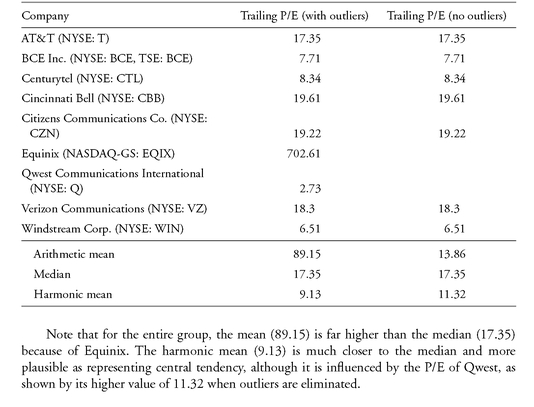
This example illustrates the importance for the analyst of understanding how an average has been calculated, particularly when the analyst is reviewing information prepared by another analyst, and the usefulness of examining several summary statistics.
7.2. Using Multiple Valuation Indicators
Because each carefully selected and calculated price multiple, momentum indicator, or fundamental may supply some piece of the puzzle of stock valuation, many investors and analysts use more than one valuation indicator (in addition to other criteria) in stock valuation and selection. Example 6-40 illustrates the use of multiple indicators.
EXAMPLE 6-40 Multiple Indicators in Stock Valuation
The following excerpts from equity analyst reports illustrate the use of multiple ratios in communicating views about a stock’s value. In the first excerpt, from a report on Colorpak Ltd. (Australia: CKL), the analyst has used a discounted cash flow valuation as the preferred methodology but notes that the stock is also attractive when a price-to-earnings ratio (PER in the report) is used. In the second excerpt, from a report on Jurong Technologies (Singapore: JTL), the analysts evaluate the stock price by using two multiples, price to book value (P/BV) and EV/EBITDA, and then summarize the company’s operational issues that contributed to their negative view.
Colorpak Ltd. (Australia: CKL)
Our DCF for CKL is A$0.82ps, which represents a 44% prem. to the current price. Whilst the DCF valuation is our preferred methodology, we recognise that CKL also looks attractive on different metrics. Applying a mid-cycle PER multiple of 10.5x (30% disc to mkt) to FY08 EPS of 7.6cps, we derive a valuation of A$0.80. Importantly, were the stock to reach our target of A$0.75ps in 12mths, CKL would be trading on a fwd PER of 9.1x, which we do not view as demanding. At current levels, the stock is also offering an attractive dividend yield of 5.7% (fully franked). [Note: “fully franked” is a concept specific to the Australian market and refers to tax treatment of the dividend.]
Mario Maia, CFA Merrill Lynch (Australia)
Jurong Technologies (Singapore: JTL)
Our target price of S$0.35 (S$0.37 previously) implies a P/BV of 0.7x and an EV/EBITDA of 5.0x on our fresh earnings forecast for FY08. Despite valuations being at an all-time low, macro difficulties and woes at key customer Motorola suggest a lack of upside catalysts. We believe Jurong Tech needs to diversify away from Motorola, de-gear or lengthen the duration of its debt profile, and boost productivity metrics for a sustained re-rating.
Patrick Yau, CFA, and Valerie Law, CFA Macquarie Research Equities
In selecting stocks, institutional investors surveyed in the Merrill Lynch Institutional Factor Surveys from 1989 to 2006 used an average of 8.5 factors in selecting stocks (depending on the year, 23 to 25 factors were included in the survey). The survey factors included not only price multiples, momentum indicators, and the DDM but also the fundamentals ROE, debt to equity, projected five-year EPS growth, EPS variability, EPS estimate dispersion, size, beta, foreign exposure, low price, and neglect. Exhibit 6-30 lists the factors classified by percentage of investors indicating that they use that factor in making investment decisions.
EXHIBIT 6-30 Frequency of Investor Usage of Factors in Making Investment Decisions High (•) >30%; Med ( ) >10%<30%; Low (
 ) <10%*
An issue concerning the use of ratios in an investing strategy is look-ahead bias. Look-ahead bias is the use of information that was not contemporaneously available in computing a quantity. Investment analysts often use historical data to back-test an investment strategy that involves stock selection based on price multiples or other factors. When back-testing, an analyst should be aware that time lags in the reporting of financial results create the potential for look-ahead bias in such research. For example, as of early January 2008, most companies had not reported EPS for the last quarter of 2007, so at that time, a company’s trailing P/E would be based on EPS for the first, second, and third quarters of 2007 and the last quarter of 2006. Any investment strategy based on a trailing P/E that used actual EPS for the last quarter of 2007 could be implemented only after the data became available. Thus, if an analysis assumed that an investment was made in early January 2008 based on full-year 2007 data, the analysis would involve look-ahead bias. To avoid this bias an analyst would calculate the trailing P/E based on the most recent four quarters of EPS then being reported. The same principle applies to other multiples calculated on a trailing basis.
The application of a set of criteria to reduce an investment universe to a smaller set of investments is called screening. Stock screens often include not only criteria based on the valuation measures discussed in this chapter but also fundamental criteria that may explain differences in such measures. Computerized stock screening is an efficient way to narrow a search for investments and is a part of many stock selection disciplines. The limitations of many commercial databases and screening tools usually include lack of control by the user of the calculation of important inputs (such as EPS); the absence of qualitative factors in most databases is another important limitation. Example 6-41 illustrates the use of a screen in stock selection.
EXAMPLE 6-41 Using Screens to Find Stocks for a Portfolio
Janet Larsen manages an institutional portfolio and is currently looking for new stocks to add to the portfolio. Larsen has a commercial database with information on U.S. stocks. She has designed several screens to select stocks with low P/Es and low EV/ CFO multiples. Because Larsen is aware that screening for low P/E and low EV/CFO multiples may identify stocks with low expected growth, she also wants stocks that have a PEG less than 1.0. She decides to screen for stocks with a dividend yield of at least 2.5 percent and a total market capitalization between $1 billion and $5 billion. Exhibit 6-31 shows the number of stocks that successively met each of the five criteria as of July 2008 (so the number of stocks that met all five criteria is 24).
EXHIBIT 6-31 Stock Screen
Other information:
• The screening database indicates that the P/E of the S&P 500 was 20.5 as of the date of the screen.
• S&P’s U.S. Style Indices177 indicates that the style indexes measure growth and value by the following seven factors, which S&P standardizes and uses to compute growth and value scores for each company:
Three Growth Factors
Five-year EPS growth rate
Five-year sales per share growth rate
Five-year internal growth rate (Internal growth rate = ROE X Earnings retention rate)
Four Value Factors
P/BV
P/CF
P/S
Dividend yield
• S&P uses the following guidelines for size indexes (in U.S. dollars): Unadjusted market capitalization of $4 billion or more for the S&P 500, $1 billion to $4.5 billion for the S&P MidCap 400, and $250 million to $1.5 billion for the S&P SmallCap 600.178
Using the information supplied, answer the following questions:
1. What type of valuation indicators does Larsen not include in her stock screen?
2. Characterize the overall orientation of Larsen as to investment style.
3. State two limitations of Larsen’s stock screen.
Solution to 1: Larsen has not included momentum indicators in the screen.
Solution to 2: Larsen can be characterized as a mid-cap value investor, based on the specified market capitalization. Although her screen does include a PEG, it excludes explicit growth rate criteria, such as those used by S&P, and it excludes momentum indicators usually associated with a growth orientation, such as positive earnings surprise. Larsen also uses a cutoff for P/E that is less than the average P/E for the S&P 500. Note that her criteria for multiples are all “less than” criteria.
Solution to 3: Larsen does not include any profitability criteria or risk measurements. These omissions are a limitation because a stock’s expected low profitability or high risk may explain its low P/E. Another limitation of her screen is that the computations of the value indicators in a commercial database may not reflect the appropriate adjustments to inputs. The absence of qualitative criteria is also a possible limitation.
Investors also apply all the metrics that we have illustrated in terms of individual stocks to industries and economic sectors. For example, average price multiples and momentum indicators can be used in sector rotation strategies to determine relatively under- or overvalued sectors.179 (A sector rotation strategy is an investment strategy that overweights economic sectors that are anticipated to outperform or lead the overall market.)
8. SUMMARY
In this chapter, we have defined and explained the most important valuation indicators in professional use and illustrated their application to a variety of valuation problems.
• Price multiples are ratios of a stock’s price to some measure of value per share.
• Price multiples are most frequently applied to valuation in the method of comparables. This method involves using a price multiple to evaluate whether an asset is relatively undervalued, fairly valued, or overvalued in relation to a benchmark value of the multiple.
• The benchmark value of the multiple may be the multiple of a similar company or the median or average value of the multiple for a peer group of companies, an industry, an economic sector, an equity index, or the company’s own median or average past values of the multiple.
• The economic rationale for the method of comparables is the law of one price.
• Price multiples may also be applied to valuation in the method based on forecasted fundamentals. Discounted cash flow (DCF) models provide the basis and rationale for this method. Fundamentals also interest analysts who use the method of comparables because differences between a price multiple and its benchmark value may be explained by differences in fundamentals.
• The key idea behind the use of price-to-earnings ratios (P/Es) is that earning power is a chief driver of investment value and earnings per share (EPS) is probably the primary focus of security analysts’ attention. The EPS figure, however, is frequently subject to distortion, often volatile, and sometimes negative.
• The two alternative definitions of P/E are trailing P/E, based on the most recent four quarters of EPS, and forward P/E, based on next year’s expected earnings.
• Analysts address the problem of cyclicality by normalizing EPS—that is, calculating the level of EPS that the business could achieve currently under midcyclical conditions (normalized EPS).
• Two methods to normalize EPS are the method of historical average EPS (calculated over the most recent full cycle) and the method of average return on equity (ROE = average ROE multiplied by current book value per share).
• Earnings yield (E/P) is the reciprocal of the P/E. When stocks have zero or negative EPS, a ranking by earnings yield is meaningful whereas a ranking by P/E is not.
• Historical trailing P/Es should be calculated with EPS lagged a sufficient amount of time to avoid look-ahead bias. The same principle applies to other multiples calculated on a trailing basis.
• The fundamental drivers of P/E are the expected earnings growth rate and the required rate of return. The justified P/E based on fundamentals bears a positive relationship to the first factor and an inverse relationship to the second factor.
• PEG (P/E to growth) is a tool to incorporate the impact of earnings growth on P/E. PEG is calculated as the ratio of the P/E to the consensus growth forecast. Stocks with low PEGs are, all else equal, more attractive than stocks with high PEGs.
• We can estimate terminal value in multistage DCF models by using price multiples based on comparables. The expression for terminal value, Vn, is (using P/E as the example)
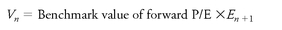
or
• Book value per share is intended to represent, on a per-share basis, the investment that common shareholders have in the company. Inflation, technological change, and accounting distortions, however, may impair the use of book value for this purpose.
• Book value is calculated as common shareholders’ equity divided by the number of shares outstanding. Analysts adjust book value to accurately reflect the value of the shareholders’ investment and to make P/B (the price-to-book ratio) more useful for comparing different stocks.
• The fundamental drivers of P/B are ROE and the required rate of return. The justified P/B based on fundamentals bears a positive relationship to the first factor and an inverse relationship to the second factor.
• An important rationale for using the price-to-sales ratio (P/S) is that sales, as the top line in an income statement, are generally less subject to distortion or manipulation than other fundamentals, such as EPS or book value. Sales are also more stable than earnings and are never negative.
• P/S fails to take into account differences in cost structure between businesses, may not properly reflect the situation of companies losing money, and may be subject to manipulation through revenue recognition practices.
• The fundamental drivers of P/S are profit margin, growth rate, and the required rate of return. The justified P/S based on fundamentals bears a positive relationship to the first two factors and an inverse relationship to the third factor.
• Enterprise value (EV) is total company value (the market value of debt, common equity, and preferred equity) minus the value of cash and investments.
• The ratio of EV to total sales is conceptually preferable to P/S because EV/S facilitates comparisons among companies with varying capital structures.
• A key idea behind the use of price to cash flow is that cash flow is less subject to manipulation than are earnings. Price to cash flow multiples are often more stable than P/E. Some common approximations to cash flow from operations have limitations, however, because they ignore items that may be subject to manipulation.
• The major cash flow (and related) concepts used in multiples are earnings plus noncash charges (CF), cash flow from operations (CFO), free cash flow to equity (FCFE), and earnings before interest, taxes, depreciation, and amortization (EBITDA).
• In calculating price to cash flow, the earnings-plus-noncash-charges concept is traditionally used, although FCFE has the strongest link to financial theory.
• CF and EBITDA are not strictly cash flow numbers because they do not account for noncash revenue and net changes in working capital.
• The fundamental drivers of price to cash flow, however defined, are the expected growth rate of future cash flow and the required rate of return. The justified price to cash flow based on fundamentals bears a positive relationship to the first factor and an inverse relationship to the second.
• EV/EBITDA is preferred to P/EBITDA because EBITDA, as a pre-interest number, is a flow to all providers of capital.
• EV/EBITDA may be more appropriate than P/E for comparing companies with different amounts of financial leverage (debt).
• EV/EBITDA is frequently used in the valuation of capital-intensive businesses.
• The fundamental drivers of EV/EBITDA are the expected growth rate in free cash flow to the firm, profitability, and the weighted average cost of capital. The justified EV/EBITDA based on fundamentals bears a positive relationship to the first two factors and an inverse relationship to the third.
• Dividend yield has been used as a valuation indicator because it is a component of total return and is less risky than capital appreciation.
• Trailing dividend yield is calculated as four times the most recent quarterly per-share dividend divided by the current market price.
• The fundamental drivers of dividend yield are the expected growth rate in dividends and the required rate of return.
• Comparing companies across borders frequently involves dealing with differences in accounting methods, cultural differences, economic differences, and resulting differences in risk and growth opportunities.
• Momentum indicators relate either price or a fundamental to the time series of the price or fundamental’s own past values (in some cases, to their expected values).
• Momentum valuation indicators include earnings surprise, standardized unexpected earnings (SUE), and relative strength.
• Unexpected earnings (or earnings surprise) equals the difference between reported earnings and expected earnings.
• SUE is unexpected earnings divided by the standard deviation in past unexpected earnings.
• Relative-strength indicators allow comparison of a stock’s performance during a period either with its own past performance (first type) or with the performance of some group of stocks (second type). The rationale for using relative strength is the thesis that patterns of persistence or reversal in returns exist.
• Screening is the application of a set of criteria to reduce an investment universe to a smaller set of investments and is a part of many stock selection disciplines. In general, limitations of such screens include the lack of control in vendor-provided data of the calculation of important inputs and the absence of qualitative factors.
PROBLEMS
1. As of February 2008, you are researching Jonash International, a hypothetical company subject to cyclical demand for its services. Jonash shares closed at $57.98 on 2 February 2007. You believe the 2003-2006 period reasonably captures average profitability: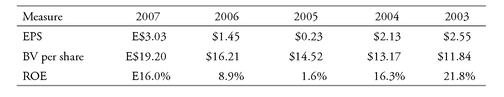
a. Define normalized EPS.
b. Calculate a normalized EPS for Jonash based on the method of historical average EPS and then calculate the P/E based on normalized EPS.
c. Calculate a normalized EPS for Jonash based on the method of average ROE and the P/E based on normalized EPS.
2. An analyst plans to use P/E and the method of comparables as a basis for recommending purchasing shares of one of two peer-group companies in the business of manufacturing personal digital assistants. Neither company has been profitable to date, and neither is expected to have positive EPS over the next year. Data on the companies’ prices, trailing EPS, and expected growth rates in sales (five-year compounded rates) are given in the following table:
Unfortunately, because the earnings for both companies have been negative, their P/Es are not meaningful. On the basis of this information, address the following:
a. Discuss how the analyst might make a relative valuation in this case.
b. State which stock the analyst should recommend.
3. May Stewart, CFA, a retail analyst, is performing a P/E-based comparison of two hypothetical jewelry stores as of early 2009. She has the following data for Hallwhite Stores (HS) and Ruffany (RUF).
• HS is priced at $44. RUF is priced at $22.50.
• HS has a simple capital structure, earned $2.00 per share (basic and diluted) in 2008, and is expected to earn $2.20 (basic and diluted) in 2009.
• RUF has a complex capital structure as a result of its outstanding stock options. Moreover, it had several unusual items that reduced its basic EPS in 2008 to $0.50 (versus the $0.75 that it earned in 2007).
• For 2009, Stewart expects RUF to achieve net income of $30 million. RUF has 30 million shares outstanding and options outstanding for an additional 3,333,333 shares.
a. Which P/E (trailing or forward) should Stewart use to compare the two companies’ valuation?
b. Which of the two stocks is relatively more attractive when valued on the basis of P/Es (assuming that all other factors are approximately the same for both stocks)?
4. You are researching the valuation of the stock of a company in the food-processing industry. Suppose you intend to use the mean value of the forward P/Es for the food-processing industry stocks as the benchmark value of the multiple. This mean P/E is 18.0. The forward or expected EPS for the next year for the stock you are studying is $2.00. You calculate 18.0 x $2.00 = $36, which you take to be the intrinsic value of the stock based only on the information given here. Comparing $36 with the stock’s current market price of $30, you conclude the stock is undervalued.
a. Give two reasons why your conclusion that the stock is undervalued may be in error.
b. What additional information about the stock and the peer group would support your original conclusion?
5. Suppose an analyst uses an equity index as a comparison asset in valuing a stock. In making a decision to recommend purchase of an individual stock, which price multiple(s) would cause concern about the impact of potential overvaluation of the equity index?
6. Christie Johnson, CFA, has been assigned to analyze Sundanci. Johnson assumes that Sundanci’s earnings and dividends will grow at a constant rate of 13 percent. Exhibits 6-32 and 6-33 provide financial statements for the most recent two years (2007 and 2008) and other information for Sundanci.
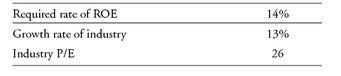
EXHIBIT 6-32 Sundanci Actual 2007 and 2008 Financial Statements for Fiscal Years Ending 31 May (in millions, except per-share data)
a. Based on information in Exhibits 6-32 and 6-33 and on Johnson’s assumptions for Sundanci, calculate justified trailing and forward P/Es for this company.
b. Identify, within the context of the constant dividend growth model, how each of the following fundamental factors would affect the P/E:
i. The risk (beta) of Sundanci increases substantially.
ii. The estimated growth rate of Sundanci’s earnings and dividends increases.
iii. The equity risk premium increases. Note: A change in a fundamental factor is assumed to happen in isolation; interactive effects between factors are ignored. That is, every other item of the company is unchanged.
EXHIBIT 6-33 Selected Financial Information
7. Tom Smithfield is valuing the stock of a food-processing business. He feels confident explicitly projecting earnings and dividends to three years (to t = 3). Other information and estimates are as follows:
• Required rate of return = 0.09
• Average dividend payout rate for mature companies in the market = 0.45
• Industry average ROE = 0.10
• E3 = $3.00
• Industry average P/E = 12
On the basis of this information, answer the following questions:
a. Compute terminal value (V3) based on comparables.
b. Contrast your answer in Part A to an estimate of terminal value based on the Gordon growth model.
8. Discuss three types of stocks or investment situations for which an analyst could appropriately use P/B in valuation.
9. Aratatech is a multinational distributor of semiconductor chips and related products to businesses. Its leading competitor around the world is Trymye Electronics. Aratatech has a current market price of $10.00, 20 million shares outstanding, annual sales of $1 billion, and a 5 percent profit margin. Trymye has a market price of $20.00, 30 million shares outstanding, annual sales of $1.6 billion, and a profit margin of 4.9 percent. Based on the information given, answer the following questions:
a. Which of the two companies has a more attractive valuation based on P/S?
b. Identify and explain one advantage of P/S over P/E as a valuation tool.
10. Wilhelm Müller, CFA, has organized the following selected data on four food companies (TTM stands for trailing 12 months):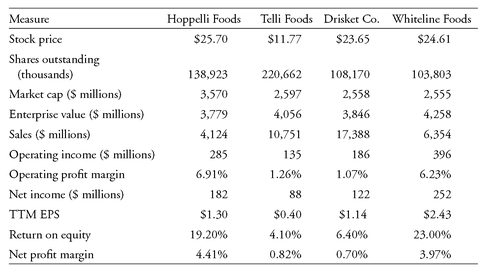
On the basis of the data given, answer the following questions:
a. Calculate the trailing P/E and EV/Sales for each company.
b. Explain, on the basis of fundamentals, why these stocks have different EV/S multiples.
11. John Jones, CFA, is head of the research department at Peninsular Research. Peninsular has a client who has inquired about the valuation method best suited for comparing companies in an industry with the following characteristics:
• Principal competitors within the industry are located in the United States, France, Japan, and Brazil.
• The industry is currently operating at a cyclical low, with many companies reporting losses. Jones recommends that the client consider the following valuation ratios:
1. P/E
2. P/B
3. EV/S
Determine which one of the three valuation ratios is most appropriate for comparing companies in this industry. Support your answer with one reason that makes that ratio superior to either of the other two ratios in this case.
12. Giantin Growing AG (GG) is currently selling for €38.50, with TTM EPS and dividends per share of €1.36 and €0.91, respectively. The company’s P/E is 28.3, P/B is 7.1, and P/S is 2.9. The ROE is 27.0 percent, and the profit margin on sales is 10.24 percent. The Treasury bond rate is 4.9 percent, the equity risk premium is 5.5 percent, and GG’s beta is 1.2.
a. What is GG’s required rate of return, based on the capital asset pricing model (CAPM)?
b. Assume that the dividend and earnings growth rates are 9 percent. What trailing P/E, P/B, and P/S multiples would be justified in light of the required rate of return in part A and current values of the dividend payout ratio, ROE, and profit margin?
c. Given that the assumptions and constant growth model are appropriate, state and justify whether GG, based on fundamentals, appears to be fairly valued, overvalued, or undervalued.
13. Jorge Zaldys, CFA, is researching the relative valuation of two companies in the aerospace /defense industry, NCI Heavy Industries (NCI) and Relay Group International (RGI). He has gathered relevant information on the companies in the following table.
EBITDA Comparisons (in € millions except per-share and share-count data)
| Company | RGI | NCI |
|---|---|---|
| Price per share | 150 | 100 |
| Shares outstanding | 5 million | 2 million |
| Market value of debt | 50 | 100 |
| Book value of debt | 52 | 112 |
| Cash and investments | 5 5 | 2 2 |
| Net income | 49.5 | 12 |
| Net income from continuing operations | 49.5 | 8 |
| Interest expense | 3 | 5 |
| Depreciation and amortization | 8 | 4 |
| Taxes | 2 | 3 |
Using the information in the table, answer the following questions:
a. Calculate P/EBITDA for NCI and RGI.
b. Calculate EV/EBITDA for NCI and RGI. C. Which company should Zaldys recommend as relatively undervalued? Justify the selection.
14. Define the major alternative cash flow concepts, and state one limitation of each.
15. Data for two hypothetical companies in the pharmaceutical industry, DriveMed and MAT Technology, are given in the following table. For both companies, expenditures on fixed capital and working capital during the previous year reflect anticipated average expenditures over the foreseeable horizon.
| Measure | DriveMed | MAT Technology |
|---|---|---|
| Current price | $46.00 | $78.00 |
| Trailing CF per share | $3.60 | $6.00 |
| P/CF | 12.8 | 13.0 |
| Trailing FCFE per share | $1.00 | $5.00 |
| P/FCFE | 46.0 | 15.6 |
| Consensus five-year growth forecast | 15% | 20% |
| Beta | 1.25 | 1.25 |
On the basis of the information supplied, discuss the valuation of MAT Technology relative to DriveMed. Justify your conclusion.
16. Your value-oriented investment management firm recently hired a new analyst, Bob Westard, because of his expertise in the life sciences and biotechnology areas. At the firm’s weekly meeting, during which each analyst proposes a stock idea for inclusion in the firm’s approved list, Westard recommends Hitech Clothing International (HCI). He bases his recommendation on two considerations. First, HCI has pending patent applications but a P/E that he judges to be low in light of the potential earnings from the patented products. Second, HCI has had high relative strength versus the S&P 500 over the past month.
a. Explain the difference between Westard’s two approaches—that is, the use of price multiples and the relative-strength approach.
b. State which, if any, of the bases for Westard’s recommendation is consistent with the investment orientation of your firm.
17. Kirstin Kruse, a portfolio manager, has an important client who wants to alter the composition of her equity portfolio, which is currently a diversified portfolio of 60 global common stocks. Because of concerns about the economy and based on the thesis that the consumer staples sector will be less hurt than others in a recession, the client wants to add a group of stocks from the consumer staples sector. In addition, the client wants the stocks to meet the following criteria:
• Stocks must be considered large cap (i.e., have a large market capitalization).
• Stocks must have a dividend yield of at least 4.0 percent.
• Stocks must have a forward P/E no greater than 15.
The following table shows how many stocks satisfied each screen, which was run in July 2008.
| Screen | Number Satisfying |
|---|---|
| Consumer staples sector | 277 |
| Large cap ( >$9.7 billion in this database) | 446 |
| Dividend yield of at least 4.0% | 1,609 |
| P/E less than 15 | 2,994 |
| All four screens | 6 |
The stocks meeting all four screens were Altria Group, Inc.; British American Tobacco (the company’s ADR); Reynolds American, Inc.; Tesco PLC (the ADR); Unilever N.V. (the ADR); and Unilever PLC (the ADR).
a. Critique the construction of the screen.
b. Do these criteria identify appropriate additions to this client’s portfolio?
..................Content has been hidden....................
You can't read the all page of ebook, please click here login for view all page.