Chapter 2. Understand core Azure services
In Chapter 1, “Understand cloud concepts,” you learned about the cloud and how you can benefit from using cloud services. Microsoft Azure was mentioned, but not in a lot of detail.
In this chapter, we dive into the many services and solutions that Azure offers. You’ll gain an understanding of the key concepts in Azure’s architecture, which apply to all Azure services. We cover Azure datacenters and ways that Microsoft implements fault tolerance and disaster recovery by spreading Azure infrastructure across the globe. You’ll also learn about availability zones, which are Microsoft’s solution for ensuring your services aren’t impacted when a particular Azure datacenter experiences a problem.
You’ll also discover how to manage and track your Azure resources, and how you can work with resources as a group using Azure resource groups. You’ll learn how to use resource groups to not only plan and manage Azure resources, but also how resource groups can help you categorize your operational expenses in Azure.
In order to really understand resource groups and how Azure works under the hood, it’s important to understand Azure Resource Manager (ARM), the underlying system that Azure uses to manage your resources. You’ll learn about the benefits that ARM provides, and you’ll see how ARM opens up some powerful possibilities for quickly and easily deploying real-world solutions to Azure.
Once you have the foundational understanding of Azure, you’ll dig into some of the core products that Microsoft provides, such as Azure Compute, networking, storage, and database offerings, which are covered from an Azure perspective. You’ll learn about some of the products available in each of these areas, and you’ll get a feel for how Azure products work together. Along the way, you’ll learn about the Azure Marketplace and how it enables the creation and deployment of complex solutions with minimal work on your part, and because of the “under the hood” knowledge you’ll have from earlier in the chapter, the Azure Marketplace won’t seem like black magic.
You’ll even learn about some of the hottest technology areas today and what Azure has to offer in those areas. This includes the Internet of Things (IoT) and how you use Azure to connect and manage devices of all kinds. Azure can help you analyze huge amounts of data using big data and analytics products, and you’ll learn how these offerings can help you control costs.
One of the hot technologies right now is artificial intelligence, or AI. Azure offers a comprehensive AI platform that includes some powerful machine learning components, and we’ll talk about what Azure offers in this area and how you can use AI and machine learning to create powerful and insightful solutions. We’ll wrap up with coverage of serverless computing in Azure and how you can create powerful and flexible services in Azure without spending a lot of money, and often without spending anything at all!
In addition, you’ll learn about the tools that Microsoft offers for creating and managing your Azure services, including the Azure portal, which is a web browser-based management tool that offers great tools for digging into your Azure resources and easily managing them. We also cover how to use command-line tools with PowerShell and the Azure command-line interface. And, we’ll wrap everything up with a look at Azure Advisor, Microsoft’s service that gives you best-practices advice for your Azure services.
If you think that’s a lot to cover, you’re right! It’s important for you to have an understanding of all of these topics in order to pass the AZ-900 exam. With the foundational knowledge of the cloud from Chapter 1, you’ll find that understanding Azure-specific concepts will be easier than you think.
Skills covered in this chapter:
Understand the core Azure architectural components
Describe some of the core products available in Azure
Describe some of the solutions available on Azure
Understand Azure management tools
Skill 2.1: Understand the core Azure architectural components
If you were to ask any CEO to list the five most important assets of their company, it is likely that the company’s data would be near the top of the list. The world we live in revolves around data. Just look at companies like Facebook and Google. These companies offer services to us that we like. Everyone likes looking at pictures from friends and family on Facebook (mixed in with things that we don’t like so much), and who doesn’t use Google to look for things on the Internet? Facebook and Google don’t offer those services because they want to be nice to us. They offer those services because it’s a way for them to collect a large amount of data on their customers, and that data is their most valuable asset.
Facebook and Google aren’t alone. Most companies have vast amounts of data that is key to their business, and keeping that data safe is at the cornerstone of business decisions. That’s why many companies are hesitant to move to the cloud. They’re afraid of losing control of their data. Not only are they afraid that someone else might gain access to sensitive data, but they’re also concerned about losing data that would be difficult (or even impossible) to recreate.
Microsoft is keenly aware of those fears, and Azure has been designed from the ground up to instill confidence in this area. Let’s look at some core architectural components that help Microsoft deliver on the cloud promise.
Azure regions
The term “cloud” has a tendency to make people think of Azure as a nebulous entity that you can’t clearly see, but that would be a mistake. While there certainly are logical constructs to Azure, there are also physical components to it. After all, at the end of the day, we’re talking about computers!
In order to provide Azure services to people around the world, Microsoft has created boundaries called geographies. A geography boundary is oftentimes the border of a country, and there’s good reason for that. There are often regulations for data handling that apply to an entire country, and having a geography defined for a country allows Microsoft to ensure that data-handling regulations are in place. Many companies (especially ones that deal with sensitive data) are also much more comfortable if their data is contained within the confines of the country in which they operate.
There are numerous geographies in Azure. For example, there’s a United States geography, a Canada geography, a UK geography, and so on. Each geography is broken out into two or more regions, each of which is typically hundreds of miles apart. As an example, within the United States geography, there are many regions, including the Central US region in Iowa, the East US region in Virginia, the West US region in California, and the South Central US region in Texas. Microsoft also operates isolated regions that are completely dedicated to government data due to the additional regulations that governmental data requires.
![]() Exam Tip
Exam Tip
The fact that each geography contains at least two regions separated by a large physical distance is important. That’s how Azure maintains disaster recovery, and it’s likely this concept will be included on the exam. We’ll cover more about this later in this chapter.
At each region, Microsoft has built datacenters (physical buildings) that contain the physical hardware that Azure uses. These datacenters contain climate-controlled buildings that house the server racks containing physical computer hardware. They also have complex and reliable network infrastructure to provide the networking power.
More Info Customers Only See Regions
When a customer is creating Azure resources, only the region is visible. The concept of geographies is an internal implementation of Azure that customers don’t really have visibility of when using Azure.
Each datacenter has an isolated power supply and power generators in case of a power outage. All of the network traffic entering and exiting the datacenter goes over Microsoft’s own fiber-optic network, on fiber owned or leased by Microsoft. Even data that flows between regions across oceans travels over Microsoft’s fiber-optic cables that traverse the oceans.
More Info Datacenter Power
As of 2018, all of Microsoft’s datacenters were using at least 50% natural power consisting of solar power, wind power, etc. By 2020, the goal is 60%, and the long-term goal is to use 100% sustainable power.
In order to remove reliance on third-party power providers, Microsoft is also investing in the development of natural gas-powered, fully-integrated fuel cells for power. Not only do fuel cells provide clean power, but they also remove the power fluctuations and other disadvantage of relying on the power grid.
To ensure that data in Azure is safe from disasters and failures due to possible problems in a particular region, customers are encouraged to replicate data in multiple regions. If, for example, the South Central US region is hit by a devastating tornado (not out of the question in Texas), data that is also replicated to the North Central US region in Illinois is still safe and available. In order to ensure that applications are still performing as quickly as possible, Microsoft guarantees round-trip network performance of 2-milliseconds or less between regions.
Availability zones
The fact that regions are physically separated by hundreds of miles protects Azure users from data-loss and application outages due to disasters at a particular region. However, it’s also important that data and applications maintain availability when a problem occurs at a particular datacenter within a region. For that reason, Microsoft developed availability zones.
Note Availability Zone Availability
Availability zones aren’t available in all Azure regions. For the most up-to-date list of availability zone-enabled regions, see: https://docs.microsoft.com/azure/availability-zones/az-overview.
There are at least three availability zones within each enabled region, and because each availability zone exists within its own datacenter in that region, each has a water supply, cooling system, network, and power supply that is isolated from other zones. By deploying an Azure service in two or more availability zones, you can achieve high-availability in a situation where there is a problem in one zone.
![]() Exam Tip
Exam Tip
Availability zones provide high-availability and fault tolerance, but they may not help you with disaster recovery. If there is a localized disaster, such as a fire in a datacenter housing one zone, you will benefit from availability zones. Because availability zones are located in the same Azure region, if there is a large-scale natural disaster such as a tornado, you may not be protected. In other words, availability zones are just one facet to an overall disaster recovery and fault tolerant design.
Because Availability zones are designed to offer enhanced availability for infrastructure, not all services support availability zones. For example, Azure has a service called App Service Certificate that allows you to purchase and manage an SSL certificate through Azure. It wouldn’t make any sense to host an App Service Certificate within an availability zone because it’s not an infrastructure component.
As of right now, availability zones are supported with the following Azure services.
Windows Virtual Machines
Linux Virtual Machine
Virtual Machine Scale Sets
Managed Disks
Load Balancer
Public IP address
Zone-redundant storage
SQL Database
Event Hubs
Service Bus (Premium tier only)
VPN Gateway
ExpressRoute
Application Gateway (currently in preview)
App Service Environments (currently in preview in limited regions)
Note Keep Up With Changes in Azure
You can keep up with all the news related to Azure updates by watching the Azure blog at https://azure.com/blog.
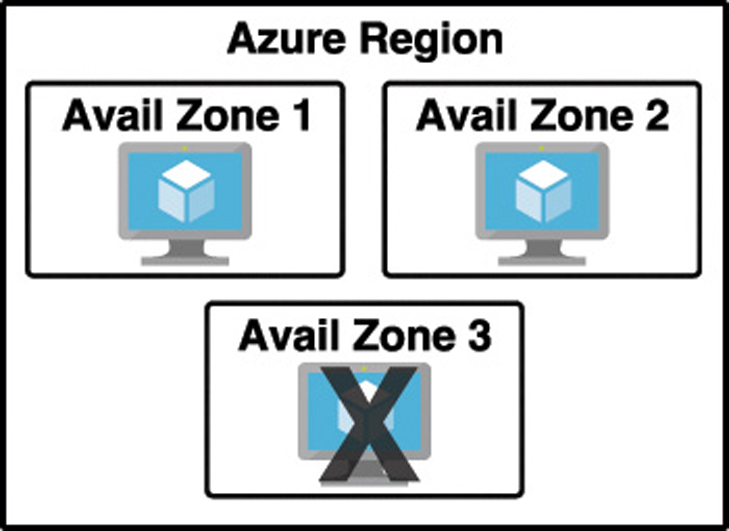
By deploying your service to two or more availability zones, you ensure the maximum availability for that resource. In fact, Microsoft guarantees a service level agreement (SLA) of 99.99% uptime for Azure Virtual Machines only if two or more VMs are deployed into two or more zones. Figure 2-1 illustrates the benefit of running in multiple zones. As you can see, even though availability zone 3 has gone offline for some reason, zones 1 and 2 are still operational.
![]() Exam Tip
Exam Tip
Don’t confuse availability zones with availability sets. Availability sets allow you to create two or more virtual machines in different physical server racks in an Azure datacenter. Microsoft guarantees a 99.95% SLA with an availability set.
An availability zone allows you to deploy two or more Azure services into two distinct datacenters within a region. Microsoft guarantees a 99.99% SLA with availability zones.
There are two categories of services that support availability zones: zonal services and zone-redundant services. Zonal services are services such as virtual machines, managed disks used in a virtual machine, and public IP addresses used in virtual machines. In order to achieve high-availability, you must explicitly deploy zonal services into two or more zones.
Note Managed Disks and Public Ip Addresses
When you create a virtual machine in Azure and you deploy it to an availability zone, Azure will automatically deploy the managed disk(s) and public IP address (if one is configured) to the same availability zone automatically.
Zone-redundant services are services such as zone-redundant storage and SQL Databases. To use availability zones with these services, you specify the option to make them zone-redundant when you create them. (For storage, the feature is called ZRS or zone-redundant storage. For SQL Database, there is an option to make the database zone-redundant.) Azure takes care of the rest for you by replicating data to automatically multiple availability zones.
Azure Resource Manager (ARM)
Almost all systems that are moved to the cloud consist of more than one Azure service. For example, you might have an Azure virtual machine for one part of your app, your data might be in an Azure SQL Database, you might have some sensitive data stored in Azure Key Vault, and you might have a web-based portion of your app hosted in Azure App Service.
If you have to manage all of these different Azure services separately, it can be quite a headache, and if you have multiple applications in the cloud, it can be even worse. Not only would it be confusing to keep track of which services are related to which applications, but when you add in the complexity of deploying updates to your application, things can really become disorganized.
In order to make it easier to deploy and manage Azure services, Microsoft developed Azure Resource Manager, or ARM. ARM is a service that runs in Azure, and it’s responsible for all interaction with Azure services. When you create a new Azure service, ARM authenticates you to make sure you have the right access to create that resource, and then it talks to a resource provider for the service you’re creating. For example, if you’re creating a new web app in Azure App Service, ARM will pass your request on to the Microsoft.Web resource provider, because it knows all about web apps and how to create them.
![]() Exam Tip
Exam Tip
There are resource providers for every Azure service, but the names might not always make sense. For example, the Microsoft. Compute resource provider is responsible for creating virtual machine resources.
You don’t have to know details on resource providers for the AZ-100 exam, but you should understand the general concept, because you are expected to know about Azure Resource Manager.
Later in this chapter, you’ll learn about using the Azure portal to create and manage Azure services. You’ll also learn about how you can use command-line tools to do the same thing. Both the portal and the command-line tools work by using ARM, and they interact with ARM using the ARM application programming interface, or API. The ARM API is the same whether you’re using the portal or command-line tools, and that means you get a consistent result. It also means that you can create an Azure resource with the portal and then make changes to it using command-line tools, allowing you the flexibility that cloud consumers need.
More Info Visual Studio and ARM
Visual Studio, Microsoft’s development environment for writing applications, also has the ability to create Azure resource and deploy code to them. It does this using the same ARM API that tools we’ve mentioned use. In fact, you can think of the ARM API as your interface into the world of Azure. You really can’t create or manage any Azure services without going through the ARM API.
The flow of a typical ARM request to create or manage a resource is straightforward. A tool such as the Azure portal, command-line tools, or Visual Studio makes a request to the ARM API. The API passes that request to ARM where the user is authenticated and authorized to perform the action. ARM then passes the request to a resource provider, and the resource provider creates the new resource or modifies an existing resource. Figure 2-2 illustrates this flow and features a small sampling of the many Azure services that are available.

The request that is made to ARM isn’t a complicated, code-based request. Instead, ARM uses declarative syntax. That means that, as a consumer of Azure, you tell ARM what you want to do and ARM does it for you. You don’t have to tell ARM how to do what you want. You simply have to tell it what you want. To do that, ARM uses files that are encoded in JavaScript Object Notation (or JSON) called ARM templates.
Note ARM Templates
You don’t need to know how to use ARM templates for the AZ-900 exam, but in order to grasp how ARM works, you really need to at least know a little about them.
In the most basic sense, an ARM template contains a list of resources that you want to either create or modify. Each resource is accompanied by properties such as the name of the resource and properties that are specific to that resource. For example, if you were using an ARM template to deploy a Web App in App Service, your ARM template would specify the region you want your app to be created in, the name of the app, the pricing plan for your app, any domain names you want your app to use, and so forth. You don’t have to know how to set all those properties. You simply tell ARM to do it (you declare your intent to ARM), and ARM takes care of it for you.
More Info More On Arm Templates
ARM templates are incredibly powerful, but they’re also pretty simple. If you want to read more about how to use ARM templates, check out the documentation at: https://docs.microsoft.com/azure/azure-resource-manager/resource-group-authoring-templates.
There’s one more important aspect to ARM template deployment. When you’re deploying multiple resources (which, as pointed out, is a typical real-world scenario), you often have service dependencies. In other words, you are deploying one or more services that rely on another services already being created.
Think, for example, of a situation where you’re deploying a certificate to be used with a web app. One of the properties you need to set on the web app is the certificate that you want to use, but if that certificate hasn’t been deployed yet, your deployment will fail. ARM allows you to specify dependencies so you can avoid issues like this. You simply tell ARM that the web app depends on the certificate and ARM will ensure the certificate’s deployment is completed before it deploys the web app.
As you can see, ARM has many benefits, and you should be aware of these for your exam:
ARM allows you to easily deploy multiple Azure resources at once.
ARM makes it possible to reproduce any deployment with consistent results at any point in the future.
ARM allows you to create declarative templates for deployment instead of requiring you to write and maintain complex deployment scripts.
ARM makes it possible to set up dependencies so that your resources are deployed in the right order every time.
Now let’s talk about another aspect of ARM that helps you to manage Azure resources, and that’s resource groups.
Resource groups
You should now be realizing that moving to the cloud may not be as simple as it first seemed. Creating a single resource in Azure is pretty simple, but when you’re dealing with enterprise-level applications, you’re usually dealing with a complex array of services. Not only that, but you might be dealing with multiple applications that use multiple services, and they might be spread across multiple Azure regions. Things can certainly get chaotic quickly.
Fortunately, Azure provides a feature in ARM that helps you deal with this kind of problem :the resource group. A resource group is a logical container for Azure services. By creating all Azure services associated with a particular application in a single resource group, you can then deploy and manage all of those services as a single entity.
Organizing Azure resources in a resource group has many advantages. First of all, you can easily set up deployments using an ARM template. ARM template deployments are typically for a single resource group. You can deploy to multiple resource groups, but doing so requires you to set up a complicated chain of ARM templates.
Another advantage to resource groups is that you can name a resource group with an easily-recognizable name so that you can see all Azure resources used in a particular application at a glance. This might not seem so important until you actually start deploying Azure resources and realize that you have many more resources than you first thought. For example, when you create an Azure Virtual Machine, Azure creates not only a virtual machine, but also a disk resource, a network interface, a public IP resource, and a network security group. If you’re looking at all your Azure resources, it can be hard to differentiate which resources go with which app. Resource groups solve that problem.
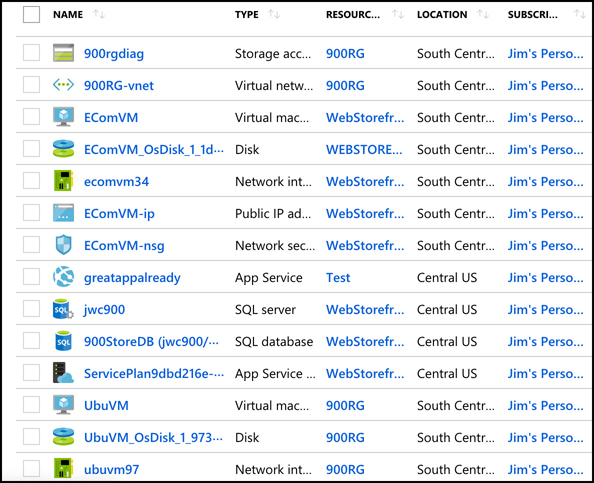
In Figure 2-3, you can see a lot of Azure services. Some of these were automatically created by Azure in order to support other services, and in many cases, Azure gives the resource an unrecognizable name.
In Figure 2-4, you can see resources that are in the WebStorefront resource group. These are the Azure resources used in the e-commerce storefront.
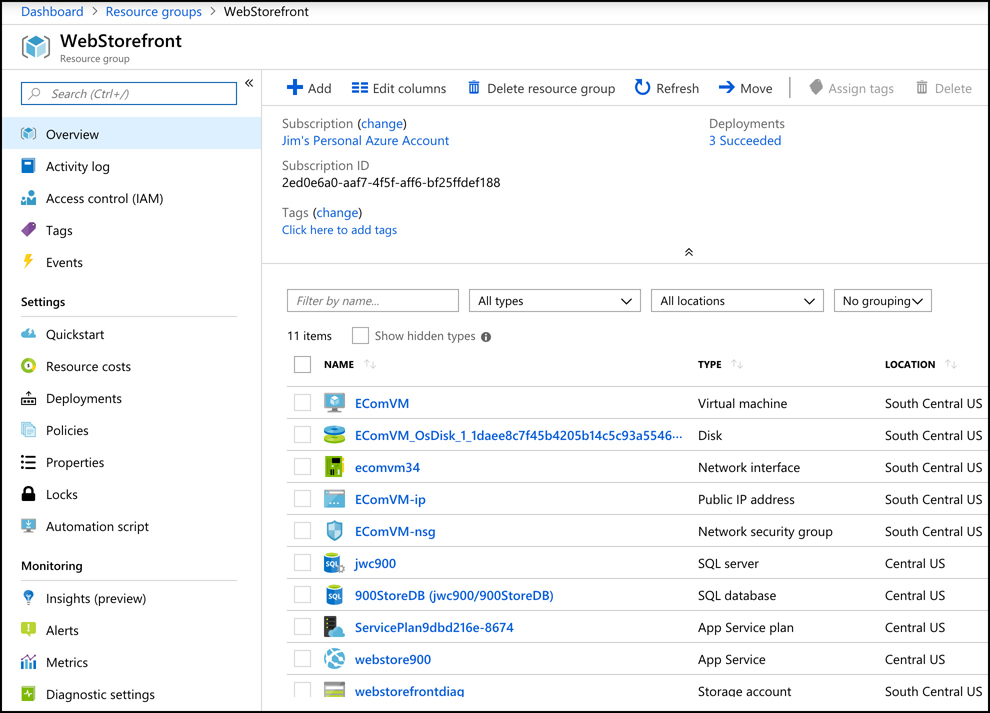
It’s convenient to see all of the resources associated with a particular app, but you aren’t locked into that paradigm. This is a useful example, because it’s a common use of resource groups, but you can organize your resource groups any way you choose. Notice in Figure 2-4 that you see resources in several different Azure regions (Regions are in the Location column). If you have access to multiple Azure subscriptions, “you can also” have resources from multiple subscriptions in a single resource group.
If you look at the left side of Figure 2-4, you’ll see a menu of operations that you can perform on your resource group. We won’t go into all of these because it’s out of scope for the AZ-900 exam, but there are a few that are helpful in understanding the benefit of resource groups.
If you click on Resource Costs, you can see the cost of all of the resources in this resource group. Having that information at your fingertips is especially helpful in situations where you want to make sure certain departments in your company are charged correctly for the used resources. In fact, some companies will create resource groups for each department rather than creating them scoped to applications. Having a Sales and Marketing resource group or an IT Support resource group, for instance, can help you immensely in reporting and controlling costs.
![]() Exam Tip
Exam Tip
An Azure resource can only exist in one resource group. In other words, you can’t have a virtual machine in a resource group called WebStorefront and also in a resource group called SalesMarketing, because it must be in one group or the other. You can move Azure resources from one resource group to another.
You can also click on Automation Script and Azure will generate an ARM template that you can use to deploy all of these Azure resources. This is useful in a situation where you want to deploy these resources at a later time, or when you want to deploy them to another Azure subscription.
If you click on Tags, you can apply one or more tags that you choose to your resource group. A tag consists of a name and a value. For example, suppose a company is participating in two trade events: one in Texas and one in New York. You have also created a lot of Azure resources to support those events. You want to view all of the Azure resources for a specific event, but they’re spread out across multiple resource groups. By adding a tag to each resource group that identifies the event it’s associated with, you can solve this problem.
In Figure 2-5, you can see the tags associated with a WebStorefront resource group. This resource group has been assigned a tag named EventName, and the value of that tag is ContosoTexas. By clicking on the cube icon to the right of the tag, you can view all resources that have that tag.
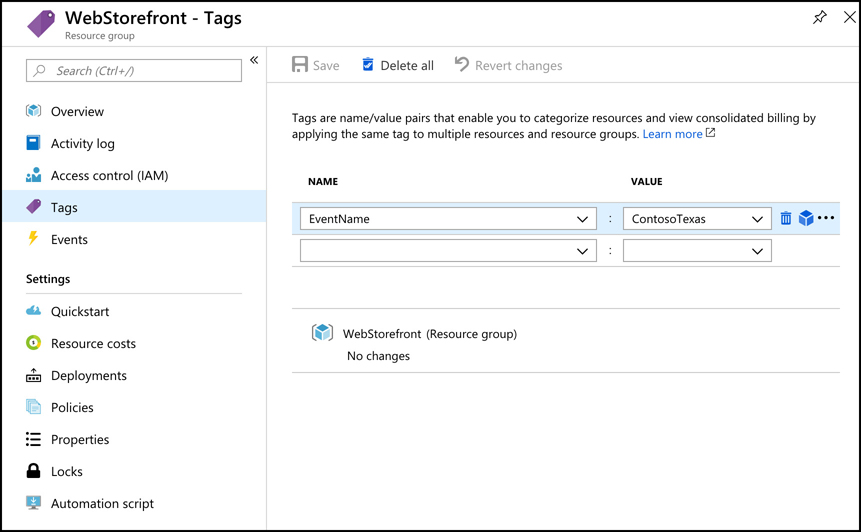
To view all of your tags, choose All Services from the main menu in the portal, and then click on Tags as shown in Figure 2-6.

You can apply a tag to most Azure resources, not just resource groups. It’s also important to understand that by adding a tag to a resource group, you are not adding that tag to the resources within the resource group. If you have a web app in the WebStorefront resource group, that web app does not inherit the tag that is applied to the resource group. Because of that, tags add an additional layer of flexibility and powerful when viewing your Azure resources.
![]() Exam Tip
Exam Tip
Tags can also help you organize your Azure billing expenses. When you download your Azure invoice, resource tags will appear in one of the columns, and because Azure invoices can be downloaded as comma-separated values, you can use tools like Microsoft Excel to filter based on tags.
When you delete a resource group, all of the resources in that resource group are automatically deleted. This makes it easy to delete multiple Azure Resources in one easy step. Suppose you are testing a scenario and you need to create a couple of virtual machines, a database, a Web App, and more. By placing all these resources in one resource group, you can easily delete that resource group after your testing and Azure will automatically delete all of the resources in it for you. This is a great way to avoid unexpected costs associated with resources you are no longer using.
Throughout this skill section, you’ve learned about some of the benefits of using Azure. Because Azure regions are spread out across the world in different geographies, you can be assured that your data and apps are hosted where you need them to be and that any regulations or data requirements are complied with. You learned that there are multiple datacenters in each region, and by deploying your applications in availability zones, you can avoid impact from a failure in a particular datacenter.
You also learned about Azure Resource Manager (ARM) and how it can help you achieve consistent deployments to Azure and to manage your Azure resources easily. Finally, you learned about using resource groups to organize your Azure resources and how to categorize billing using tags. In the next skill section, you’ll learn details about some of the specific products that are core to Azure.
Skill 2.2: Describe some of the core products available in Azure
As we went over the core Azure architectural components, you noticed some references to some of the products available in Azure. There were also some details about the Azure portal, but we’ll cover that in detail in Skill 2.4. In this skill section, we’ll talk about some of the core Azure products in four different categories:
Azure compute This refers to the resources that provide computing power to run your applications. Azure offers both IaaS and PaaS compute products.
Azure networking These products provide connectivity between Azure resources, and to and from the Internet or your on-premises resources.
Azure storage These products give you secure and reliable cloud storage for your data.
Azure database These products provide highly-scalable solutions for hosting databases of many varieties.
Note Using Azure
In this skill section, you’ll create a couple of Azure resources, so you’ll need an Azure subscription. If you don’t have one, you can get a free trial by going to: https://azure.microsoft.com/free/.
Azure compute products
Azure compute products allow you to easily and dynamically allocate resources that are needed for any computing task. You can create compute resources quickly when you need them, and when your needs grow, you can scale those resources to handle additional requirements. By using Azure compute resources for your computing needs, you can more easily control costs because you don’t pay for resources unless you need them. You can also allocate infrastructure much more quickly than you can in the on-premises world, and you can benefit from the economies of scale that Azure affords and use extremely powerful computers that you might not otherwise be able to afford.
Some examples of compute products in Azure are Azure Virtual Machines, Azure App Service, container offerings in Azure, and serverless computing. (Serverless computing is covered in Skill 2.3).
Azure virtual machines
A virtual machine (VM) is a software-based computer that runs on a physical computer. The physical computer is considered the host, and it provides the underlying physical components such as disk space, memory, CPU power, and so on. The host computer runs software called a hypervisor that can create and manage one or more VMs, and those VMs are commonly referred to as guests.
The operating system on a guest doesn’t have to be the same operating system that the host is running. If your host is running Windows 10, you can run a guest that uses Windows Server 2016, Linux, or many other operating systems. This flexibility makes VMs extremely popular. However, because the VMs running on a host use the physical systems on that host, if you have a need for a powerful VM, you’ll need a powerful physical computer to host it.
By using Azure Virtual Machines, you can take advantage of powerful host computers that Microsoft makes available when you need computing power, and when you no longer need that power, you no longer have to pay for it.
To create an Azure Virtual Machine, log into the Azure portal using your Azure account and then follow these steps as shown in Figures 2-7 through 2-9.
Click Create A Resource.
Click Compute.
Click Ubuntu Server.
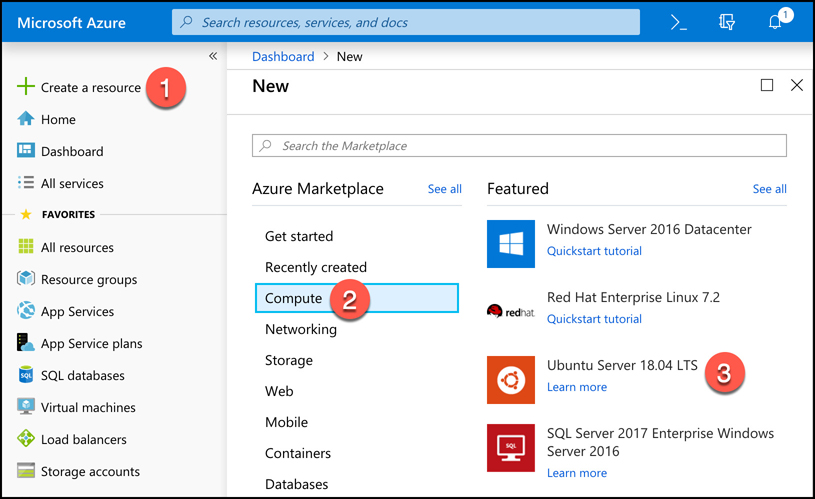
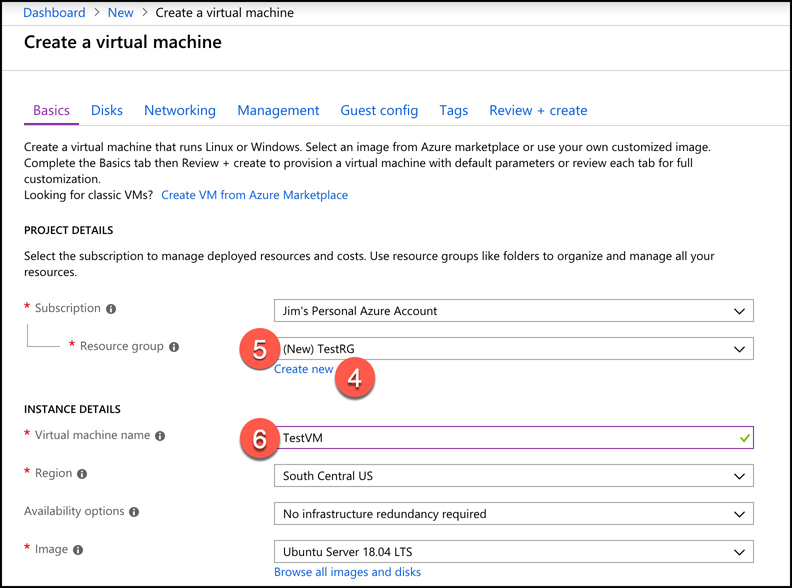
Figure 2-7 Creating a virtual machine Next to Resource Group, click Create New to create a new resource group.
Enter TestRG as the resource group name and click OK.
Enter TestVM as your VM name.
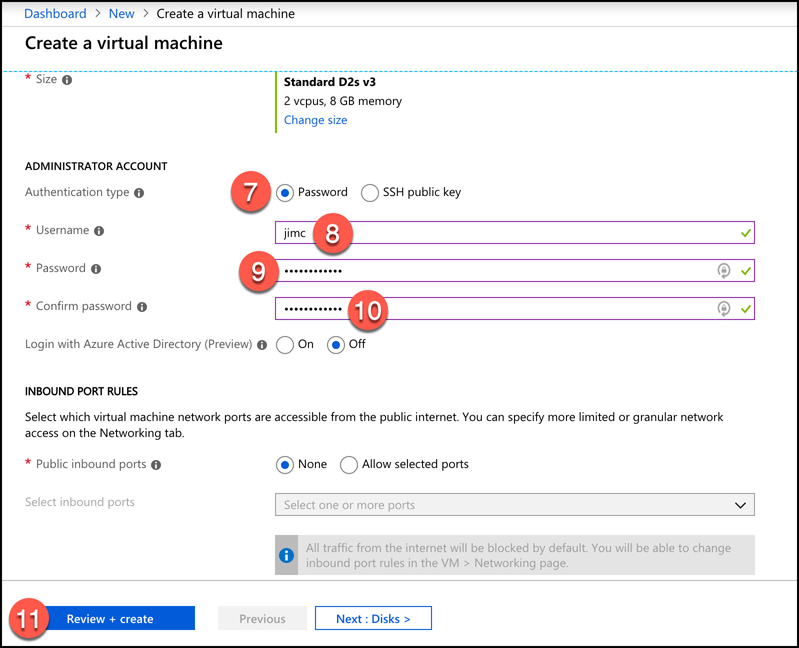
Scroll down and select Password for the authentication type.
Enter a username for your administrator account.
Enter a password you’d like to use for your administrator account.
Confirm the password.
Leave all the other settings as they are and click Review + Create to validate your settings.
More Info Virtual Machine Settings and Options
There are many more options you can choose for your VM. We could have clicked Next : Disks, as shown in Figure 2-9, to move to additional pages that contain many more options. You can also click one of the tabs (Disks, Networking, Management, and so on as shown in Figure 2-8) to change specific settings. However, if you choose, you can use the default settings like we’ve done by clicking Review + Create as soon as you’ve entered the information Azure requires for a VM.
After you click Review + Create, Azure will validate your settings to make sure you haven’t left anything out. Once your validation has passed, you will see a Create button. Click the Create button to start the deployment of your new VM.
More Info How Azure Deploys your VM
When you click Create to create your VM, the Azure portal is actually using an ARM template to deploy your VM. That ARM template contains parameters that are replaced with the information you entered for your VM. Every VM that is created in Azure is created using an ARM template. This ensures that the deployments are consistent.
As your VM is being deployed, you’ll see the status displayed in the Azure portal as shown in Figure 10-10. You can see the Azure resources that are created to support your VM. You can see the resource name, the resource type (which starts with the resource provider), and the status of each resource.

Once all the resources required for your VM are created, your VM will be considered fully deployed. You’ll then be able to click the Go To Resource button to see the management interface for your VM in the Azure portal as shown in Figure 2-11.

Our new VM is a guest on a physical computer with an Azure datacenter. In that datacenter is a physical rack of computer servers, and our VM is hosted on one of those servers. The host computer is managed by Microsoft, but the VM is managed by you, because this is an IaaS offering in Azure.
Note VMs and Billing
You are charged for Azure VMs as long as they are running. To stop billing for this VM, click the Stop button at the top of the screen shown in Figure 2-11. Azure will save the current state of the VM and billing will stop. You won’t be able to use the VM while it’s in a stopped state, but you will also avoid the billing of that VM. Keep in mind that unless you have configured a static IP address for your VM, your IP address will likely change the next time you start it.
You can also stop a VM from within the guest operating system on the VM, but when you do that, you will still be charged for the resources the VM uses because it’s still allocated to you. That means you’ll still incur charges for managed disks and other resources.
As of right now, this VM is susceptible to downtime due to three types of events: planned maintenance, unplanned maintenance, and unexpected downtime.
Planned maintenance refers to planned updates that Microsoft makes to the host computer. This includes things like operating system updates, driver updates, and so on. In many cases, updates won’t impact your VM, but if Microsoft installs an update that requires a reboot of the host computer, your VM will be down during that reboot.
Azure has underlying systems that constantly monitor the health of computer components. If one of these underlying systems detects that a component within the host computer might fail soon, Azure will flag the computer for unplanned maintenance. In an unplanned maintenance event, Azure will attempt to move your VM to a healthy host computer. When it does this, it preserves the state of the VM, including what’s in memory and any files that are open. It only takes Azure a short time to move the VM, during which time it’s in a paused state. In a case where the move operation fails, the VM will experience unexpected downtime.
In order to ensure reliability when a failure occurs in a rack within the Azure datacenter, you can (and you should) take advantage of a feature called availability sets. Availability sets protect you from maintenance events and downtime caused by hardware failures. To do that, Azure creates some underlying entities in an availability set called update domains and fault domains. (In order to protect yourself in the event of maintenance events or downtime, you must deploy at least two VMs into your availability set transpose).
Fault domains are a logical representation of the physical rack in which a host computer is installed. By default, Azure assigns two fault domains to an availability set. If a problem occurs in one fault domain (one computer rack), the VMs in that fault domain will be impacted, but VMs in the second fault domain will not be. This protects you from unplanned maintenance events and unexpected downtime.
Update domains are designed to protect you from a situation where the host computer is being rebooted. When you create an availability set, Azure creates five update domains by default. These update domains are spread across the fault domains in the availability set. If a reboot is required on computers in the availability set (whether host computers or VMs within the availability set), Azure will only reboot computers in one update domain at a time and it will wait 30 minutes for computers to recover from the reboot before it moves on to the next update domain. Update domains protect you from planned maintenance events.
Figure 2-12 shows the diagram that Microsoft uses to represent an availability set. In this diagram, the fault domains FD0, FD1, and FD2 encompass three physical racks of computers. UD0, UD1, and UD2 are update domains within the fault domains. You will see this same representation of an availability set within other Azure training as well, but it’s a bit misleading because update domains are not tied to a particular fault domain.

Figure 2-13 shows a better representation of an availability set, with five VMs in the availability set. There are two fault domains and three update domains. When VMs were created in this availability set, they were assigned as follows:
The first VM is assigned Fault Domain 0 and Update Domain 0.
The second VM is assigned Fault Domain 1 and Update Domain 1.
The third VM is assigned Fault Domain 0 and Update Domain 2.
The fourth VM is assigned Fault Domain 1 and Update Domain 0.
The fifth VM is assigned Fault Domain 0 and Update Domain 1.
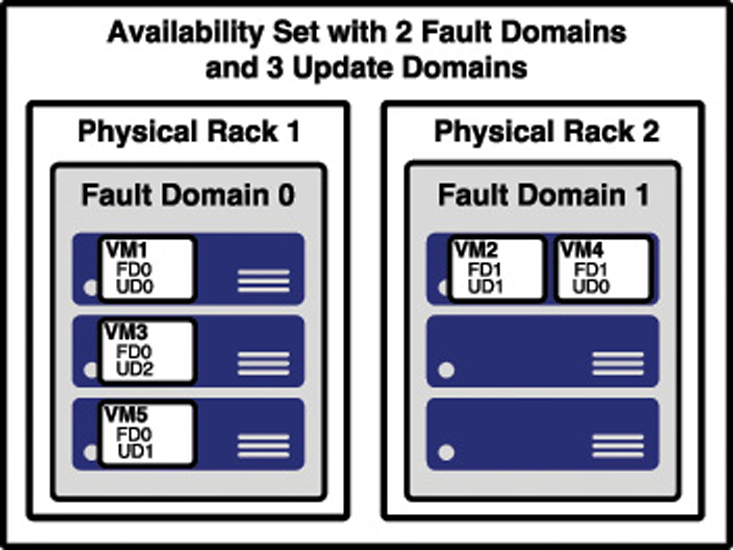
You can verify the placement of fault domains and update domains by creating five VMs in an availability set with two fault domains and three update domains. If you then look at the availability set created in the Azure portal as shown in Figure 2-14, you can see the same configuration depicted in Figure 2-13.
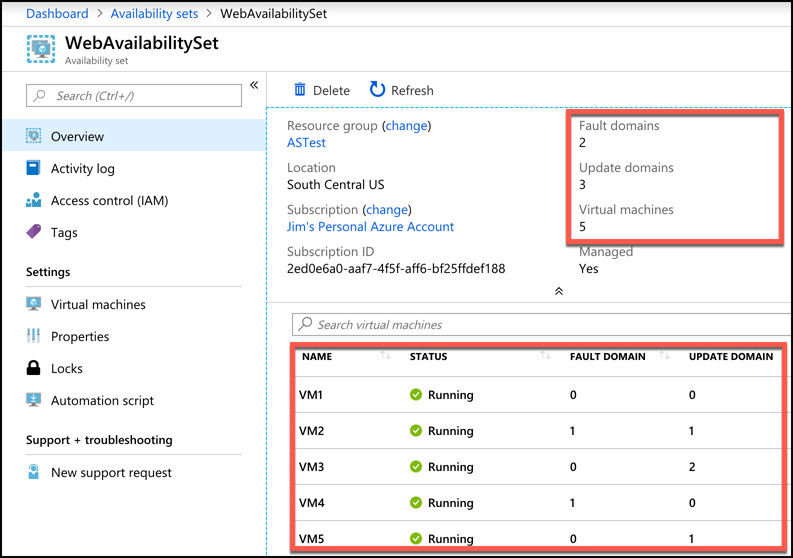
Notice in Figure 2-14 that the availability set is named WebAvailabilitySet. In this availability set, we run five VMs that are all running a web server and host the website for an application. Suppose you need a database for this application, and you want to host that database on VMs as well. In that situation, you would want to separate the database VMs into their own availability set. As a best-practice, you should always separate your workloads into separate availability sets.
Availability sets certainly provide a benefit in protecting from downtime in certain situations, but they also have some disadvantages. First of all, every machine in an availability set has to be explicitly created. While you can use an ARM template to deploy multiple virtual machines in one deployment, you still have to configure those machines with the software and configuration necessary to support your application.
An availability set also requires that you configure something in front of your VMs that will handle the distribution of traffic to those VMs. For example, if your availability set is servicing a website hosted on the VMs, you’ll need to configure a load balancer that will handle the job of routing users of your website to the VMs that are running it.
Another disadvantage to availability sets relates to cost. In a situation where your VM needs changed often based on things like load on the application, you might find yourself paying for many more VMs than you need.
Azure offers another feature for VMs called scale sets that solves these problems nicely. When you create a scale set, you tell Azure what operating system you want to run and then you tell Azure how many VMs you want in your scale set. You have many other options such as creating a load balancer or gateway and so forth. Azure will create as many VMs as you specified (up to 1,000) in one easy step.
More Info Using a Custom Image
The default set of templates for VMs are basic and include only the operating system. However, you can create a VM, install all of the necessary components you need (including your own applications), and then create an image that can be used when creating scale sets.
For more information on using custom images, see: https://docs.microsoft.com/azure/virtual-machine-scale-sets/virtual-machine-scale-sets-deploy-app#build-a-custom-vm-image.
Scale sets are deployed in availability sets automatically, so you automatically benefit from multiple fault domains and update domains. Unlike VMs in an availability set, however, VMs in a scale set are also compatible with availability zones, so you are protected from problems in an Azure datacenter.
As you might imagine, you can also scale a scale set in a situation where you need more or fewer VMs. You might start with only one VM in a scale set, but as load on that VM increases, you might want to automatically add additional VMs. Scale sets provide that functionality by using Azure’s auto-scale feature. You define scaling rules that use metrics like CPU, disk usage, network usage, and so forth. You can configure when Azure should add additional instances and when it should scale back and deallocate instances. This is a great way to ensure availability while reducing costs by taking advantage of the elasticity that auto-scale provides.
More Info Scaling and Availability Sets
Before the introduction of scale sets, you had the ability to configure auto-scale rules for an availability set. You’ll probably still see third-party documentation and training that talks about scaling availability sets, but that functionality has been replaced with scale sets.
Microsoft guarantees an SLA of 99.95% when you use a multi-VM deployment scenario, and for most production scenarios, a multi-VM deployment is preferred. However, if you use a single-instance VM, and you use premium storage, Microsoft guarantees a 99.9% SLA. Premium storage uses solid-state drives (SSDs) that are located on the same physical server that is hosting the VM for enhanced performance and uptime.
Containers in Azure
It’s becoming pretty commonplace for companies to move applications between “environments,” and this type of thing is even more prevalent when it comes to the cloud. In fact, one of the most complex aspects of moving to the cloud is dealing with the complexities of moving to a new environment. To help with this problem and to make it easier to shift applications into new environments, the concept of containers was invented.
A container is created using a zipped version of an application called an image, and it includes everything the application needs to run. That might include a database engine, a web server, and so on. The image can be deployed to any environment that supports the use of containers. Once there, the image is used to start a container the application runs in.
In order to run an application in a container, a computer needs to have a container runtime installed on it. The most popular container runtime is Docker, a runtime developed and maintained by a company called Docker Inc. Docker not only knows how to run applications in containers, but it also enforces certain conditions to ensure a secure environment.
More Info Docker Images
You aren’t limited to your own images. In fact, Docker runs a repository of images that you are free to use in your own applications. You can find it at: https://hub.docker.com.
Each container operates within an isolated environment. It has its own network, its own storage, and so on. Other containers running on the same machine cannot access the data and systems used by another container. This makes containerized applications an ideal solution when security is a concern.
Azure offers numerous technologies for hosting containers. Azure Container Instances (ACI) is a PaaS service that makes it easy to start a container with minimal configuration. You simply tell ACI where to find the image (using either a Docker tag or a URL to the image) and some basic configuration for the VM you want the container to run on.
Azure creates server resources as needed to run your container, but you’re not paying for an underlying VM. Instead, you pay for the memory and CPU that your container uses. That translates into extremely low costs in most cases. For example, if your ACI app is running on a machine with 1 CPU and 1 GB of memory and you use the app for 5 minutes a day, at the end of the month, your cost would be less than 5 cents!
Note Containers Use their Own Operating System
The operating system for a container is actually part of the image. The VM that you are configuring when you create an ACI app is the VM that runs the container runtime. Even so, it’s important that you choose an operating system that’s compatible with your container. A Docker image that was built for Linux will not run on a Windows host and vice versa.
ACI is designed to work with simple applications. You can define a container group and run multiple containers within an ACI instance, but if you have an application that is used heavily by many people and that might need to take advantage of scaling, ACI isn’t a good choice for you. Instead, Azure’s Kubernetes Service (AKS) would be a better choice.
Kubernetes is a container orchestration service. This means that it’s responsible for monitoring containers and ensuring that they’re always running. It can also scale to add additional containers when the needs require it to, and it can then scale back when the needs are reduced.
Kubernetes creates containers in a pod. A pod is a group of related containers, and containers within a pod are able to share resources. This is one of the advantages to using Kubernetes, because it releases you from the resource-sharing restriction typically imposed in a multi-container environment. However, a container in one pod is not able to share resources with a container in another pod.
The computer that Kubernetes pods are running on is called a node or a worker. This computer must have a container runtime such as Docker running on it. In addition to pods, the node also runs several services that are required for Kubernetes to manage the pods, and so on. There will typically be multiple nodes within a Kubernetes instance, and they are all controlled by a master node called the Kubernetes master. The entire environment of the master and all of its nodes is called a Kubernetes cluster.
A Kubernetes master contains all of the configuration and services necessary to manage the orchestration of pods and other Kubernetes entities. Configuring a master can be complex, and it is by far the most laborious task of using Kubernetes. For that reason, services such as Azure Kubernetes Service (AKS) are becoming more popular.
AKS offloads the burden of dealing with the Kubernetes master to Microsoft. When you create a Kubernetes cluster in AKS, Azure creates the master and the nodes for you. All you have to do is deploy your containers, and you’re up and running with a managed Kubernetes cluster.
AKS simplifies the creation of a Kubernetes cluster, but it also makes it extremely easy to manage a cluster (see Figure 2-15). Operations, such as upgrading a cluster or scaling a cluster, are simple using the Azure portal menu options. You can also get detailed information on your cluster, including each node that’s running in the cluster.

While AKS makes adopting and managing Kubernetes easier, it doesn’t completely obfuscate Kubernetes. In order to deploy your applications, you still need to understand how to use Kubernetes, and in some cases you’ll need to use the Kubernetes command line. Azure, however, makes it far easier than doing all of the legwork and maintenance yourself. Even better, AKS in Azure is free. You only pay for the Azure computer for resources that you use within your cluster.
For a true PaaS experience in container hosting, Microsoft offers Web App for Containers, a feature of Azure App Service. When you create a Web App for Containers app, you specify the OS you want (either Windows or Linux) and you specify the location of the Docker image (see Figure 2-16). The image can be in Docker Hub, a private registry, or in Azure Container Services.
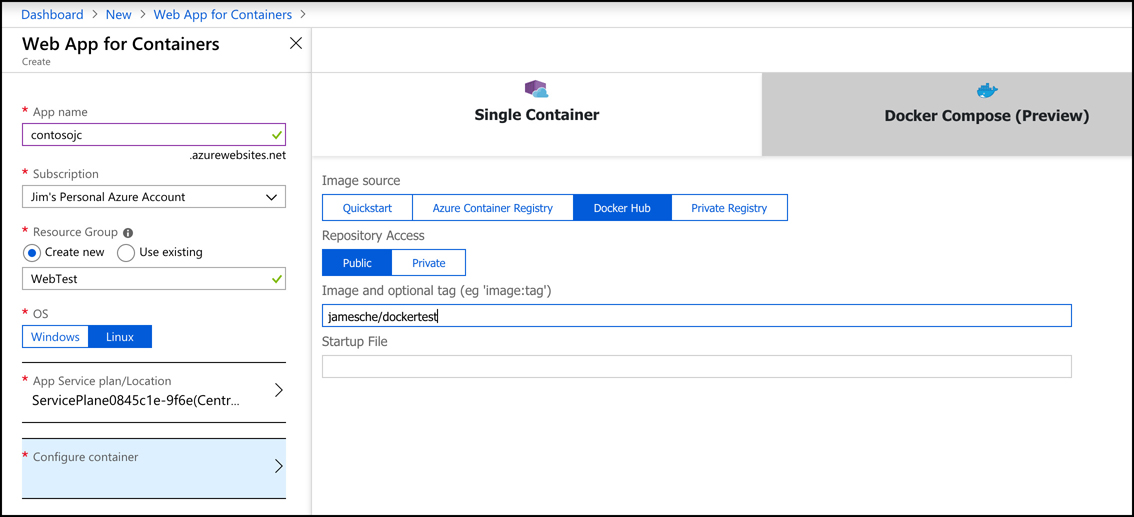
Containers that are running in Web App for Containers enjoy the benefits of all of the PaaS features of Azure App Service. Microsoft manages the infrastructure that’s involved, so you only have to worry about the application contained in the image.
Unlike ACI, you pay for Azure App Service whether you’re using the application or not, because your application is running on a dedicated VM in App Service. That VM is associated with an App Service plan, and each App Service plan is associated with a specific pricing tier. You can change the pricing tier of your App Service Plan at any time. For example, if you decide that your application needs more memory than you first thought, you can scale up to a higher tier and get more memory. App Service takes care of moving your app to the new VM.
App Service also makes it easy to scale out by using Azure auto-scale. Just like scaling a VM scale set, you can specify metrics that are used to determine when to scale your app. Keep in mind, however, that you pay for each VM that you use, so if you scale out to a large number of VMs, you’re going to see an equally large bill at the end of the month.
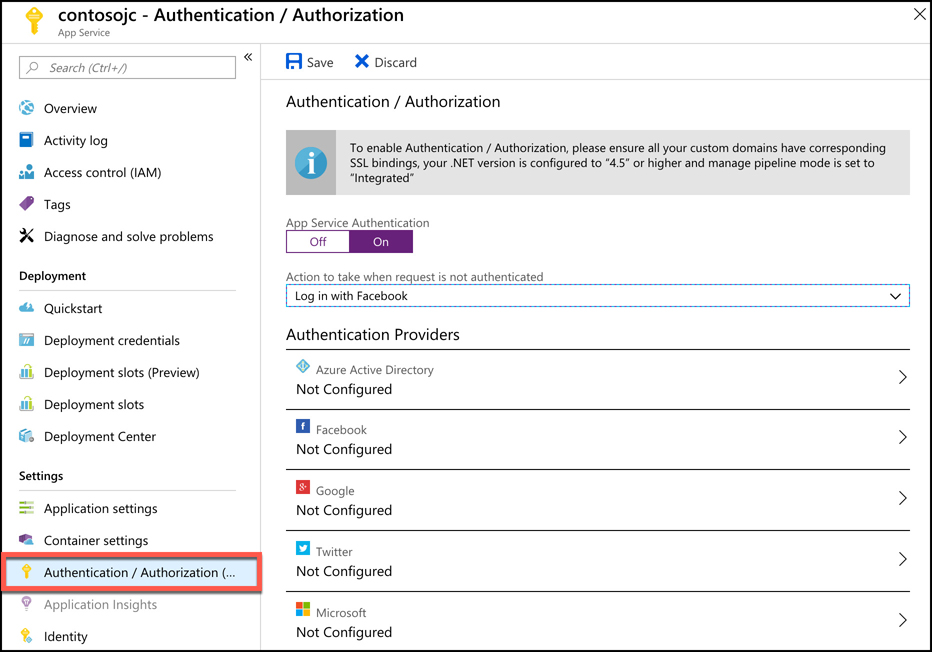
Another benefit of using Web App for Containers is that, because it’s a true PaaS service, it offers many turnkey features that you can use in your application without having to deal with complicated development or configuration issues. For example, if you want to enforce authentication in your application, and you want users to be able to use their Microsoft Account, Facebook, Twitter, or Google login credentials, you can configure that easily with App Service Authentication as shown in Figure 2-17.
Azure networking products
Applications in Azure are almost always composed of multiple Azure services working together. Even though these multiple services rely on each other for the application to function, they should not be tightly integrated. Instead, applications should be designed using a loosely-coupled architecture.
In a loosely-coupled architecture, each component of an application can be replaced or updated without breaking the application. In order to design applications in this way, you have to separate out the various components, and they need to operate in their own tier of the application. It’s this separation of components that allows you to be more flexible in the implementation details of your application, and it’s a critical component to an application designed for the cloud. Applications designed in this way are referred to as N-tier applications.
![]() Exam Tip
Exam Tip
The AZ-900 exam isn’t an exam for developers, so we won’t go into any level of detail about application design. It is important for you to understand the concept of multi-tier applications, however, so that you understand why Azure’s networking features work the way that they do.
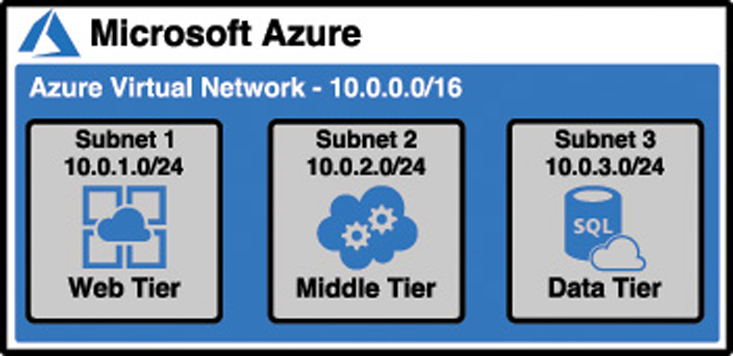
Suppose you have an application that records sales data for your company. Users enter their sales records, and the application performs some analysis on them, and then stores the information in a database. The application uses three tiers: a web tier, a middle tier, and a data tier.
The web tier is a website running in Azure App Service. It’s there only to give the user a way to interact with the application. It doesn’t handle any logic. It simply takes what the user inputs and passes it on to the middle tier where the work actually happens.
The middle tier (or application tier) is where all of the application logic exists. This is where the application analyzes the sales data for trends, and applies business rules to it as it’s running in an Azure Virtual Machine. The data tier is where you store sales data, but the middle tier can also retrieve sales data from it when you need to display reports. The data tier consists of an Azure SQL Database. Figure 2-18 shows a diagram of the application.

Here are a few requirements for this application.
Only the web tier can talk to and from the Internet.
The web tier can talk to the middle tier, but it cannot talk to the data tier.
The middle tier can talk to and from the web tier and the data tier.
The data tier can talk to and from the middle tier, but it cannot talk to the web tier.
These requirements are typical for an N-tier design, and they help to keep data secure and prevent security issues with the application. Since each of these tiers is running in a separate Azure service, they can’t talk to each other by default. In order to communicate between the tiers of your application, you need a computer network, and that’s where Azure’s networking products come into play.
Azure virtual network
An Azure virtual network (often called a VNET) allows Azure services to communicate with each other and with the Internet. You can even use a VNET to communicate between your on-premises resources and your Azure resources. When you created the virtual machine earlier in this chapter, Azure created a VNET for you. Without that VNET, you wouldn’t be able to remote into the VM, or use the VM for any of your applications. You can also create your own VNET and configure it any way you choose.
An Azure VNET is just like any other computer network. It’s comprised of a network interface card (a NIC), IP addresses, and so on. You can break up your VNET into multiple subnets and set up a portion of your network’s IP address space for those subnets. You can then configure rules that control the connectivity between those subnets.
Figure 2-19 illustrates an Azure VNET that we might use for the sales application. The VNET uses IP addresses in the 10.0.0.0 address range and each subnet has its own range of addresses. IP address ranges in VNETs are specified using classless inter-domain routing (CIDR) notation, and a discussion of that is far outside of the scope of this exam. However, with the configuration shown in Figure 2-19, we have 65,536 IP addresses available in our VNET, and each subnet has 256 IP addresses allocated to it. (The first four IP addresses and the last IP address in the range are reserved for Azure’s use, so you really only have 251 addresses to use in each subnet.) This is a typical design because you still have a large number of addresses available in your network for later expansion into additional subnets.
In most cases, you create VNETs before you create the resources that use them. If you go back and look at Figure 2-10, you’ll see that Azure has automatically created a VNET for the VM. It does that because you can’t use a VM unless there’s a network associated with it. While you can connect a VNET to an existing VM, you can’t move a VM into another network. For that reason, you create your VNET before you create your VM.
Our web tier, on the other hand, is running in Azure App Service, a PaaS offering. This is running on a VM that Microsoft manages, so Microsoft has created and manages the VM and its network. In order to use that tier with the VNET, App Service offers a feature called VNET Integration that allows you to integrate a web app in App Service with an existing VNET.
The IP addresses within the VNET at this point are all private IP addresses. They allow resources within the VNET to talk to each other, but you can’t use a private IP address on the Internet. You need a public IP address in order to give the Internet access to your web tier.
More Info Outbound Internet Connectivity
A public IP address doesn’t have to be assigned to a resource in order for that resource to connect outbound to the Internet. Azure maintains a pool of public IP addresses that can be dynamically assigned to a resource if it needs to connect outbound. That IP address is not exclusively assigned to the resource, so it cannot be used for inbound communication from the Internet to the Azure resource.
Since the web tier is running on Azure App Service (a PaaS service), Microsoft manages the public-facing network for us. You get Internet access on that tier without having to do anything. If you want to run the web tier on an IaaS VM instead, configure the public IP address for the web tier. In those situations, Azure allows you to create a Public IP Address resource and assign it to a virtual network.
More Info Network Security Groups
Azure offers a feature called Network Security Groups that allow you to enforce rules about what kind of traffic is allowed on the VNET. We’ll cover Network Security Groups in Chapter 3, “Understand security, privacy, compliance, and trust.”
Azure load balancer
It is easy to scale out the web tier in our sales application when needed. App Service takes care of ensuring that load is distributed across all of the VMs we’re using. App Service uses a load balancer to do this, and one of the advantages of choosing a PaaS offering for the web tier is that you don’t have to worry about Managing it. If you use an IaaS VM running a web server for the web tier, you may want to have more than one VM in order to handle additional load if needed. Figure 2-20 represents what the web tier might look like using an IaaS model.
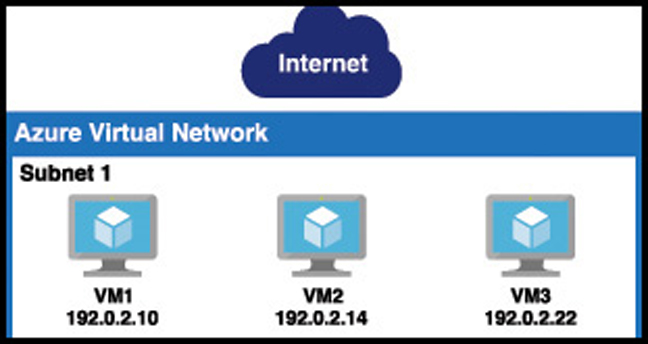
This kind of configuration is typical in order to maintain high-availability in your application, but it does add an additional layer of complexity. Since each of these VMs has its own public IP address, a user is going to use only one VM. Ideally you have a system in place that ensures if one of these VMs experiences a problem, any traffic is sent to the other VMs. In addition to that, when there’s high load, you want to spread the load across all three of these VMs. The solution to this problem is to use Azure LoadBalancer.
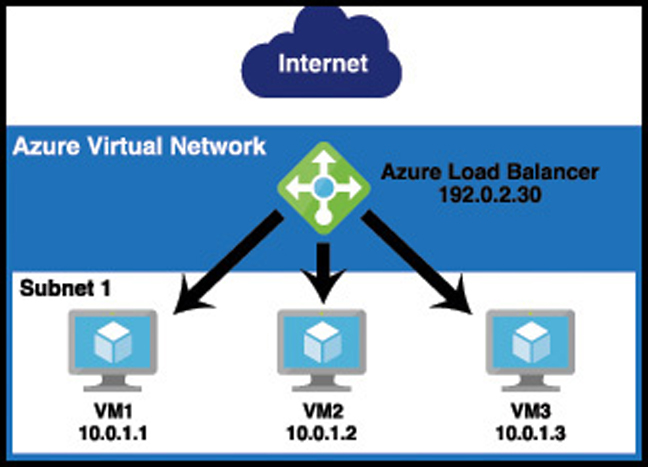
Azure Load Balancer is inside of the VNET, but it sits between the user and the subnet. When a user connects to the web tier, she connects to the load balancer’s IP address, not the IP address of one of my VMs. The load balancer routes requests into the web tier to the VMs, and it can use rules to ensure that traffic is equally distributed between them. If one of the VMs goes down and doesn’t respond, the load balancer can send that traffic to another VM without the user even realizing there’s a problem.
Figure 2-21 shows the web tier from Figure 2-20 with Azure Load Balancer added to the mix. Notice that the public IP is now on the load balancer, and the VMs are using the private IP addresses from the subnet.
Azure Load Balancer isn’t just for distributing traffic from the Internet. In order for our application to maintain high-availability, we should ensure the same scalability of other tiers, and Azure Load Balancer can sit within other tiers as well to ensure that load is distributed, and to ensure the application maintains the high-availability necessary for the business.
Azure Application Gateway
Using Azure Load Balancer for the web tier is a perfectly suitable solution, but since the web tier only uses HTTP traffic for the web site, we can gain additional features specific to HTTP traffic by using Azure Application Gateway.
Azure Application Gateway is a load balancer that’s specifically designed to deal with HTTP traffic. Because Application Gateway understands HTTP traffic, it can make decisions based on that HTTP traffic. For example, Application Gateway can:
Route traffic to a specific VM or pool of VMs based on the URL.
Use a cookie to ensure that a user is always routed to the same VM in a situation where that VM contains state information on that user that must be maintained.
Display a customized error page, complete with your company branding, when a page isn’t found or when an error occurs.
Handle the SSL traffic for your site so that your application tiers don’t have the overhead of dealing with decrypting traffic.
You can also add Web Application Firewall (WAF) to Application Gateway. WAF is designed to stop known vulnerabilities from making it into your VNET, allowing you to operate in a more secure environment. If a request attempts to enter your network and it’s determined to be a threat, it’s rejected at the gateway and never makes it to your application.
VPN Gateway
In some cases, you may need your application hosted in Azure to talk to an on-premises resource. We talked about these types of scenarios in Chapter 1 when we covered hybrid cloud scenarios. To implement such a system, you can use Azure’s VPN Gateway.
VPN Gateway connects your on-premises resources to your Azure VNET using a virtual private network, or VPN. Traffic that flows over this VPN is encrypted. There are multiple configurations for VPN Gateway connections as shown in Table 2-1.
Table 2-1 Type of VPN Gateway Connections
Connection Type |
Description |
|---|---|
Site-to-Site VPN (S2S) |
Connects your VNET to a single on-premises location. Requires a VPN with public-facing IP address on-premises. A multi-site variant allows you to connect to multiple on-premises locations. |
Point-to-Site VPN (P2S) |
Connects one specific on-premises client PC to your VNET. Multiple clients can connect, but each one connects over its own VPN client. |
VNET-to-VNET |
Connects two Azure VNETs to each other. Useful in situations where you have two VNETs in different Azure regions and you want to securely connect them. |
More Info VNET PEERING
As an alternative to using VNET-to-VNET connections, you can use VNET peering to establish communication between two Azure VNETs in the same region, and you can use global VNET peering to connect VNETs in different Azure regions. Peering is typically used in a scenario where you don’t require a gateway for connectivity to on-premises resources.
For more information on VNET peering, see https://docs.microsoft.com/azure/virtual-network/virtual-network-peering-overview.
Azure Content Delivery Network
Azure Content Delivery Network (CDN) is an effective way of delivering large files or streaming content over the Internet. It makes the downloading of large files much faster by caching the files in multiple geographical locations so that users can get the files from a server as close to them as possible. CDNs are typically used with images, videos, and other similarly large files.
A CDN works by storing a cached version of files on a point-of-presence (POP) server that is located on the outside edge of a network. These servers (called edge servers) are able to serve content without having to go through the entire network, a process which adds time to a request.
Microsoft has CDN edge servers located across the globe, so when a user requests large files from any geographical location, it can serve a cached copy that is as close to the user’s location as possible. The content on an edge server has a time-to-live (TTL) property associated with it that tells the edge server how long it should keep the cached copy. If a TTL isn’t specified, the default TTL time is seven days. Once a cached copy is removed, the next time that resource is requested, the edge server will make a request to the server where the original copy of the resource is located. It will then cache it again for future users until the TTL expires.
Azure Traffic Manager
Azure Traffic Manager is a domain name system (DNS) -based system that’s designed to enhance the speed and reliability of your application. To use Traffic Manager, you configure endpoints within Traffic Manager. An endpoint is simply a resource that you want users to connect to. Traffic Manager supports public IP addresses connected to Azure VMs, web apps running in App Service, and cloud services hosted in Azure. An endpoint can also be a resource located on-premises or even at another hosting provider.
Once you’ve configured your endpoints, you specify routing rules that you want Traffic Manager to apply to them. There are many routing rules available in Traffic Manager.
Priority All traffic is sent to a primary endpoint, but backup endpoints are available in case the primary endpoint experiences an outage.
Weighted Traffic is distributed across endpoints. By default, all traffic is distributed evenly, but you can specify a weight for each endpoint and traffic will be distributed as you specify.
Performance Traffic Manager determines the endpoint with the lowest network latency from the user’s location and uses that endpoint.
Geographic Traffic is routed based on the geographic location of the DNS server that queries Traffic Manager.
Multivalue Returns all valid endpoints that use the specified Internet protocol version, either IPv4 or IPv6.
Subnet Traffic is routed based on the end-user IP address range.
One important thing to remember is that Traffic Manager is DNS-based. That means that a user never directly talks to Traffic Manager. Traffic Manager is only used for the DNS lookup. Once an IP address is known for the desired endpoint, all subsequent requests bypass Traffic Manager entirely. Also, because Traffic Manager is DNS-based, the actual traffic between the user and the resource is never sent through Traffic Manager.
Azure storage products
Azure offers many options for storing data. Whether you need to store data temporarily on a disk mounted to a VM, or you need to be able to store data long-term, Azure has an option to fit your needs.
Azure Blob Storage
Azure Blob Storage is designed for storing unstructured data, which has no defined structure. That includes text files, images, videos, documents, and much more. An entity stored in Blob Storage is referred to as a blob. There are three types of blobs in Azure Storage.
Block blobs Used to store files used by an application.
Append blobs They are like block blobs, but append blobs are specialized for append operations. For that reason, they are often used to store constantly updated data like diagnostic logs.
Page blobs They are used to store virtual hard drive (.vhd) files that are used in Azure virtual machines. We’ll cover these in Azure Disk Storage later in this chapter.
Blobs are stored in storage containers. A container is used as a means of organizing blobs, so you might have a container for video files, another container for image files, and so on. The choice, however, is entirely up to you.
Microsoft offers numerous storage tiers that are priced according to how often the data is accessed, how long you intend to store the data, and so on. The Hot storage tier is for data you need to access often. It has the highest cost of storage, but the cost for accessing the data is low. The Cool storage tier is for data that you intend to store for a longer period and not access quite as often. It has a lower storage cost than the Hot tier, but access costs are higher. You’re also required to keep data in storage for at least 30 days.
Microsoft also offers an Archive storage tier for long-term data storage. Data stored in the Archive tier enjoys the lowest storage costs available, but the access costs are the highest. You must keep data in storage for a minimum of 180 days in the Archive tier. Because data in the Archive tier isn’t designed for quick and frequent access, it can take a very long time to retrieve it. In fact, while the Hot and Cold access tiers guarantee access to the first byte of data within milliseconds, the Archive tier only guarantees access to the first byte within 15 hours.
If you’re planning on moving data from on-premises into Azure Storage, there are many options available to you. You can use Azure Storage Explorer, a free tool available from Microsoft, to upload data. You can also use command line tools that Microsoft provides for uploading to Azure Storage.
If you want to move a large amount of data, Microsoft offers a service called Data Box. Data Box has an online service called Data Box Edge that makes copying data to Azure Storage as easy as copying it to a hard drive on your system. For even larger amounts of data, Microsoft offers a Data Box offline service where they will ship you hard drives. You simply copy your data to the hard drives, encrypt the drives with BitLocker, and then ship them back to Microsoft. They even offer Data Box Heavy, a service where they’ll ship you a rugged device on wheels that can hold up to 1 petabyte of data!
Azure Queue Storage
A message queue is a component in an application that can store messages that an application uses to know what tasks to take. For example, you may have an application that performs image manipulation on pictures, and some of those manipulations might take much longer than others. If you have thousands of people using the application, a message queue can help to ensure a responsive and reliable application by allowing one component to put messages in the queue and your image manipulation component can then retrieve those messages, perform the manipulation, and put a message back on the queue.
Azure Queue Storage provides a cloud-based message queue that can be accessed securely from application components located anywhere. They can be located in the cloud or on-premises. Queue Storage can asynchronously process millions of messages up to 64KB in size. The sender of the message expects the receiver to take action on it only when it’s ready. You can think of this in the same way that email works. You send an email to a receiver and the receiver deals with it when they have time. You don’t expect an immediate response.
More Info Authorization To Queue Storage
Access to Queue Storage is protected and authorized using either Azure Active Directory or a shared key.
To access Queue Storage, your application uses the APIs available for the language the application was written in. Microsoft provides APIs for use with .NET, Java, Node.js, C++, PHP, Python, and Ruby.
Azure Disk Storage
Disk storage in Azure refers to disks that are used in virtual machines. Azure creates a disk for you when you create a VM, which is automatically designated for temporary storage. This means that data on that disk will be lost if there’s a maintenance event on the VM. If you need to store data for a longer period of time that will persist between VM deployments and maintenance events, you can create a disk using an image stored in Azure Storage.
Azure disks are available as both traditional hard disks (HDD) and solid-state drives (SSD). Azure Standard HDD Disk are cheaper and designed for non-critical data. SSD disks are available in a Standard tier for light use and as Azure Premium Disk for heavy use.
Azure disks are available as either Managed Disks or unmanaged disks. All Azure disks are backed by page blobs in Azure Storage. When you use unmanaged disks, they use an Azure Storage account in your Azure subscription, and you have to manage that account. This is particularly troublesome because there are limitations in Azure Storage, and if you have heavy disk usage, you may end up experiencing downtime due to throttling.
When you move to Managed Disks, Microsoft handles the storage account, and all storage limitations are removed. All you have to worry about is your disk. You can leave the Storage account in Microsoft’s hands.
More Info Managed Disks
Microsoft recommends Managed Disks for all new VMs. They also recommend that all VMs currently using unmanaged disks move to Managed Disks.
Perhaps an even more important reason to use Managed Disks is that by doing so, you avoid a possible single point of failure in your VM. When you use unmanaged disks, there is a possibility that the Azure Storage accounts backing up your disks might exist within the same storage scale unit. If a failure occurs in that scale unit, you will lose all of your disks. By ensuring that each Managed Disk is in a separate scale unit, you avoid the situation of a single point of failure.
Azure Files
Azure disks are a good option for adding a disk to a virtual machine, but if you just need disk space in the cloud, it doesn’t make sense to take on the burden of managing a virtual machine and its operating system. In those situations, Azure Files is the perfect solution.
Note Azure Files And Azure Storage
Azure Files shares are backed by Azure Storage, you so will need a storage account to create an Azure Files share.
Azure Files is a completely managed file share that you can mount just like any SMB file share. That means existing applications that use network attached storage (NAS) devices or SMB file shares can use Azure Files without any special tooling, and if you have multiple applications that need to access the same share, that will work with Azure Files, too.
![]() Exam Tip
Exam Tip
You can mount Azure Files shares on Azure VMs and on-premises on Windows, Linux, and MacOS. You can’t, however, use Windows 7 or Windows Server 2008 to mount an Azure Files share on-premises because those operating systems only support SMB 2.1.
Also, because Azure Files shares use SMB, you’ll need to make sure that TCP port 445 is open on your network. On Windows, you can use the Test-NetConnection PowerShell cmdlet to test connectivity over port 445. For more information, see: https://docs.microsoft.com/azure/storage/files/storage-how-to-use-files-windows.
One possible problem with using Azure Files is the remote location of files. If your users or applications are using a file share mapped to Azure Files, they might experience longer than usual file transfer times because the files are in Azure. To solve that problem, Microsoft introduced Azure File Sync.
Install Azure File Sync on one or more servers in your local network and it will keep your files in Azure Files synchronized with your on-premises server. When users or applications need to access those files, they can access the local copy quickly. Any changes you make to the centralized Azure Files share are synchronized to any servers running Azure File Sync.
Azure database products
Most applications use some kind of database to store data that can be retrieved through queries and used in the application. Azure provides numerous database solutions, and if you’re going to move to the cloud, it’s important for you to understand the differences between them.
Azure SQL Database
Azure SQL Database is a PaaS offering for SQL Server database hosting. Microsoft manages the platform, so all you have to worry about is your database and the data in it.
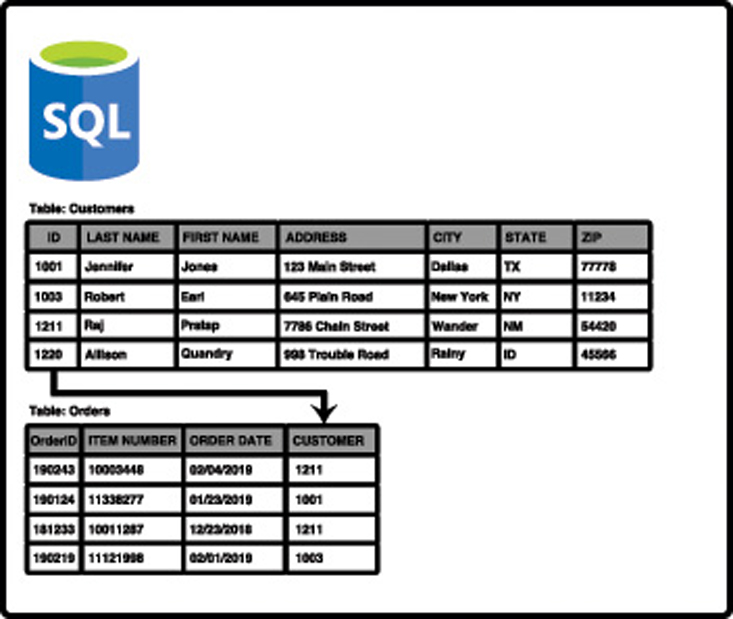
SQL Server databases are relational databases made up of tables of data, and each table has a schema that defines what the data should look like. For example, the schema may define that your data contains an ID number, a first name, a last name, and a date. Any data that you add to the table must follow the schema, so it must have all of the fields defined in the schema.
A database will contain many tables of data that are related to each other, and by using specialized queries, developers can return data that is a result of joining related data from multiple tables. For example, you might have a Customers table and an Orders table, each with a “CustomerID” field that identifies a customer. By querying and joining the data from both of these tables, you can provide a user with an invoice showing all of their orders. This relationship between the tables is how relational databases got their name, as shown in Figure 2-22.
Note Relational Databases
SQL Server isn’t the only relational database system. There are many relational database systems, including Oracle, PostgreSQL, and MySQL.
Azure offers three different deployment options for Azure SQL Database: single database, elastic pool, and managed instance.
A single database is simply a database running in a hosted SQL Server instance running in Azure. Microsoft manages the database server, so all you have to worry about is the database itself. Microsoft provides two different purchase models for single databases. Table 2-2 shows these models and how they differ.
Table 2-2 Single database purchase models
Database Transaction Unit (DTU) Model |
VCore Model |
|---|---|
Good choice for users who don’t need a high degree of flexibility with configuration and who want fixed pricing. |
Good choice if you need a high level of visibility and control of individual resources (such as memory, storage, and CPU power) your database uses. |
Pre-configured limits for transactions against the database, and pre-configured storage, CPU, and memory configurations. |
Flexibility in CPU power, memory, and storage with storage charged on a usage basis. |
Basic and Standard offerings, along with a Premium tier for production databases with a large number of transactions. |
General Purpose and Business Critical offerings to provide lower costs when desired and high-performance and availability when required. |
Ability to scale to a higher tier when needed. |
Ability and flexibility to scale CPU, memory, and storage as needed. |
Backup storage and long-term retention of data provided for an additional charge. |
Backup storage and long-term retention of data provided for an additional charge. |
An elastic pool consists of more than one database (and often many databases) all managed by the same SQL Database server. This solution is geared towards SaaS offerings where you may want to have multiple users (or maybe even each user) to be assigned their own database. You can easily move databases into and out of an elastic pool, making it ideal for SaaS.
In some cases, being able to scale a single database to add additional power is sufficient. If your application has wide variations in usage and you find it hard to predict usage (such as with a SaaS service), however, being able to add more databases to a pool is much more desirable. In an elastic pool, you are charged for the resource usage of the pool versus individual databases, and you have full control over how individual databases use those resources. This makes it possible to not only control costs, but also to ensure that each database has the resources it needs while still being able to maintain predictability in expenses. What’s more, you can easily transition a single database into an elastic pool by simply moving the database into a pool.
Note Pricing Models Of Elastic Pools
The pricing model information in Table 2-2 also applies to elastic pools. Your resources aren’t applied to an individual database, however, they are applied to the pool.
![]() Exam Tip
Exam Tip
While you can scale up and down easily with Azure SQL Database by moving to a higher tier or adding compute, memory, and storage resources, relational databases don’t scale horizontally. There are some options available for scaling out a read-only copy of your database, but in general, relational databases don’t offer the capability of scaling out to provide additional copies of your data in multiple regions.
A managed instance is explicitly designed for customers who want an easy migration path from on-premises or another non-Azure environment to Azure. Managed instances are fully compatible with SQL Server on-premises, and because your database server is integrated with an isolated VNET and has a private IP address, your database server can sit within your private Azure VNET. The features are designed for users who want to lift and shift an on-premises database to Azure without a lot of configuration changes or hassle. Both the General Purpose and Business Critical service tiers are available.
Microsoft developed the Azure Database Migration Service (DMS) to make it easier for customers to easily move on-premises databases or databases hosted elsewhere in the cloud to a managed instance. The DMS works by walking you through a wizard experience to tell Azure which database(s) and table(s) you want to migrate from your source database to Azure SQL Database. It will then use the Azure VNET that comes with the managed instance to migrate the data. Once the data has been migrated, DMS sets up synchronization between the source database and Azure SQL Database. This means that as long as the source database remains online, any changes made to it will be synchronized with the managed instance in Azure SQL Database.
More Info Dms And On-Premises Databases
In order to migrate an on-premises database, you must have connectivity between Azure and your on-premises network over VPN or using a service such as ExpressRoute.
For more information on ExpressRoute, see: https://docs.microsoft.com/azure/expressroute/expressroute-introduction.
Azure Cosmos DB
As you’ve seen in our discussion about SQL Server databases, relational databases lock you into a specific structure for your data. While there’s certainly a place for relational databases, as companies began to collect more and more data, they began to seek out a more flexible way to store that data. This eventually led to what are called NoSQL database systems.
In a NoSQL database system, you’re not locked into a schema for your data. If you’re storing information like that shown in the Customers table in Figure 2-22, and you want to start storing customer birthdays as well, you simply add the birthday to your data and add it to the database. The database doesn’t care what kind of data there is and what fields there are.
There are four types of NoSQL database systems: key-value, column, document, and graph. Table 2-3 lists each of these types and some information about them.
Table 2-3 NoSQL database systems
System |
Description |
Common Use |
|---|---|---|
Key-value |
Stores data that is tied to a unique key. Pass in the key and the database returns the data. |
Since the value can be just about anything, key-value databases have many uses. |
Column |
NoSQL databases are called keyspaces, and a keyspace contains column families. A column contains rows and columns like a relational table, but each row can have its own set of columns. You aren’t locked into a schema. |
Storing user-profile data for a website. Also, because column databases scale well and are extremely fast, they are well-suited to storing large amounts of data. |
Document |
Data is stored as a structured string of text called a document. This can be HTML, JSON, and so forth. Ths is similar to a key-value database except that the document is a structured value. |
Same as key-value, but document databases have advantages. They scale well horizontally, and they allow you to query against the value and return portions of the value. A key-value database query returns the entire value associated with the key. |
Graph |
Stores data and the relationships between each piece of data. Data is stored in nodes, and relationships are drawn between nodes. |
Many systems use graph databases because they are extremely fast. A social network might use a graph database because it would be easy to store relationships between people and also things those people like, and so forth. |
There are many different NoSQL database systems, and most of them are geared toward a particular database model. Microsoft offers a hosted NoSQL database system in Azure called Cosmos DB, and Cosmos DB supports all of the NoSQL database types. Microsoft has built some custom code around Cosmos DB so that developers can use their existing skills with other database systems with a Cosmos DB database. This makes it easy for existing applications to begin taking advantage of Cosmos DB without engineers having to write new code.
When you create a Cosmos DB database, you choose the API you want to use, and this determines the database type for your database. The database API types are:
Core (SQL) Creates a document database that you can query using SQL syntax that you might be familiar with from using relational databases.
Azure Cosmos DB for MongoDB API Used for migrating a MongoDB database to Cosmos DB. MongoDB databases are document databases.
Cassandra Used for migrating a Cassandra database to Cosmos DB. Cassandra databases are column databases.
Azure Table Used for migrating data stored in Azure Table Storage to Cosmos DB. This creates a key-value database.
Gremlin Used for migrating Gremlin databases to Cosmos DB. Gremlin databases are graph databases.
The reason Microsoft calls these APIs is because they are just that. They are application programming interfaces that allow developers who are already using an existing NoSQL database technology to migrate to Cosmos DB without having to change their code.
Another huge advantage to Cosmos DB is a feature Microsoft calls turnkey global distribution. This feature takes advantage of the horizontal scalability of NoSQL databases and allows you to replicate your data globally with a few clicks. In the Azure portal, you can simply click on the region(s) where you want data replicated, as shown in Figure 2-23. Once you click Save, Cosmos DB will begin to replicate data, which will be available in the selected regions. This makes it easy to ensure that users have the fastest experience possible with an application.

The Azure Marketplace and its usage scenarios
You’ve learned about many of the products and services available in Azure, but there are many available products outside of what we’ve discussed. Not only does Microsoft offer many additional services, but third-party vendors also provide a wide array of resources you can use in Azure. All of these resources are available in a single repository called the Azure Marketplace.
To access the Azure Marketplace, click on Create A Resource in the Azure portal as shown in Figure 2-24. This will display a list of categories you can choose from. It will also show a list of popular offerings from all categories. You can click on a category to see all templates in that category, and you can click a template in the list of popular templates, enter a search term, or even click See All to see all templates that are available.
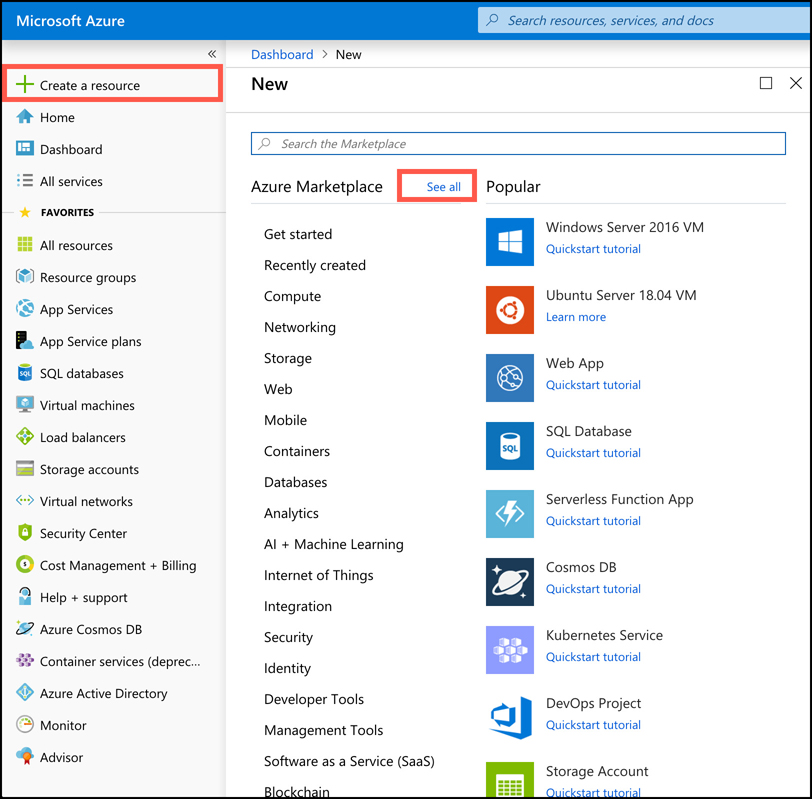
If you click See All, you’ll be taken to the full Marketplace experience where you can filter based on pricing, operating systems, and publisher as shown in Figure 2-25.

![]() Exam Tip
Exam Tip
All of the templates in the Azure Marketplace are ARM templates that deploy one or more Azure services. Remember from our earlier discussion of Azure Resource Manager that all ARM deployments are deployed using ARM templates. The Marketplace is no different.
Some of the templates in the Marketplace deploy a single resource. For example, if you click on the Web App template, it will create a Web App running in Azure App Service. Other templates create many resources that combine to make an entire solution. For example, you can create a DataStax Enterprise database cluster and the template will create between 1 and 40 DataStax Enterprise nodes.
You are billed for each Marketplace offering on your Azure invoice, so if you create a DataStax Enterprise cluster with 40 nodes, you won’t see separate billing for 40 VMs, VNETs, and so on. Instead, you’ll see a bill for a DataStax Enterprise cluster. This makes billing much easier to understand.
As shown in Figure 2-26, many Marketplace templates provide links to documentation and other information to help you get the most out of the template. If you decide that you don’t want to immediately create the resources, you can click Save For Later and the template will be added to your saved list that you can access by clicking My Saved List as shown in the upper-left corner in Figure 2-25.
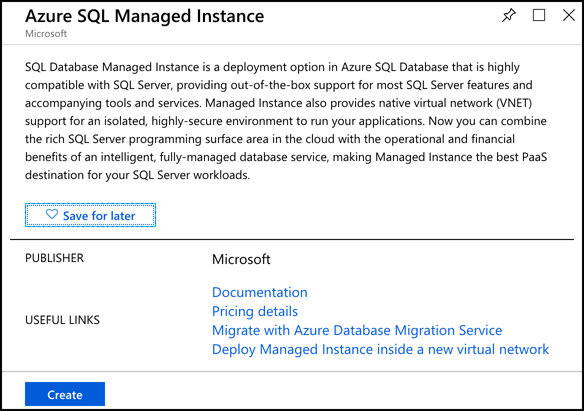
Skill 2.3: Describe some of the solutions available on Azure
In the Skill 2.2 section, you learned about some of the core products in Azure. In this section, you will learn about some of the most cutting-edge technologies that are available in Azure today. This includes the Internet of Things (IoT), Big Data and analytics, artificial intelligence (AI), and serverless computing in Azure.
Internet of Things (IoT)
Many of us don’t live in high-tech smart homes, so we might not realize just how big IoT is becoming. To put it into context, the popular statistics portal Statista reports that there are over 25 billion IoT connected devices today, and that number is expected to grow to a staggering 75 billion by the year 2025. There are approximately 3.2 billion people on the Internet today, and the entire world’s population is only around 8 billion. These IoT devices eclipse the human race in number, and the amount of information they collect and share is mind-boggling.
To help companies manage devices and handle the data they are collecting, Azure has several services that are targeted at IoT, including IoT Hub and IoT Central.
Azure IoT Hub
In order to make more sense out of Azure’s IoT services, let’s consider a theoretical company named ContosoPharm, which in this example is a pharmaceutical company with a large, multi-story building where they store drugs under development, along with sensitive components used in research. These items must be under strict climate control. If the temperature or humidity moves outside of a very tight range, it results in the loss of priceless materials.
In order to protect their investment, ContosoPharm uses IoT connected climate-control systems, along with IoT connected generators and lighting systems. These systems constantly monitor the environment and send alerts if something goes wrong. There are approximately 5,000 IoT devices in the building, and ContosoPharm must meet the following requirements for all those devices.
They must update firmware on the IoT devices easily, and in a staged way, so that all of them aren’t updated at the same time.
They must alter the settings on the devices, such as changing alert levels, but these settings are specific to the physical location of the devices in the building.
They must ensure that any connectivity to the devices is completely secure.
IoT Hub can easily solve all of these problems. IoT devices are added to IoT Hub, and you can then manage them, monitor them, and send messages to them, either individually or to groups that you create. You can add up to 1,000,000 IoT devices to a single IoT Hub.
Figure 2-27 shows an IoT device added to the IoT Hub for ContosoPharm.

From IoT Hub, you can send messages to devices (called cloud-to-device, or C2D messaging) or from your device to IoT Hub (called device-to-cloud, or D2C messaging). You can also intelligently route messages to Event Hub, Azure Storage, and Service Bus based on the content in the message.
When you add a new IoT device, IoT Hub creates a connection string that uses a shared access key for authentication. This key prevents unauthorized access to your IoT Hub. Once connected, messages between your device and IoT Hub are encrypted for additional security.
In addition to messages, you can also use IoT Hub to send files to your devices. This allows you to easily update the firmware on your devices in a secure way. To update the firmware on an IoT device, you simply copy the firmware to the device. The device will detect the firmware and will reboot and flash the new firmware to the device.
One important concept in IoT Hub is the concept of what’s called a device twin. Every IoT device in IoT Hub has a logical equivalent that’s stored in IoT Hub in JSON format. This JSON representation of the device is called a device twin, and it provides important capabilities.
Each device twin can contain metadata that adds additional categorization for the device. This metadata is stored as tags in the JSON for the device twin, and it’s not known to the actual device. Only IoT Hub can see this metadata. One of ContosoPharm’s requirements was to update firmware in a staged way instead of updating all devices at the same time. They can achieve that by adding tags for the device twins from their devices that might look like the following:
"tags": {

     "deploymentLocation": {

            "department": "researchInjectibles",

            "floor": "14"

      }

}
They can then choose to send firmware files only to devices on the 14th floor, for instance, or say to devices in the researchInjectibles department. Figure 2-28 shows the device twin configuration in IoT Hub with tags set for the location of the device. Notice the “building” tag with a value of null. This is a tag that was previously set on the device twin, and by setting it to null, the tag will be removed.

The device twin also contains the properties for the IoT device. There are two copies of every property. One is the “reported” property, and the other is the “desired” property. You can change a device property in IoT Hub by changing the “desired” property to a new value. The next time the device connects to IoT Hub, that property will be set on the device. Until that happens, the “reported” property will contain the last value the device reported to IoT Hub. Once the property is updated, the “reported” and “desired” property will be equal.
The reason IoT Hub uses this method for setting properties is that it may not always have a connection to every device. For example, if a device puts itself to sleep to save power, IoT Hub can’t write property changes to that device. By keeping a “desired” and “reported” version of every property, IoT Hub always knows if a property needs to be written to a device the next time the device connects to IoT Hub.
To help with users who want to add a large number of IoT devices to IoT Hub, Microsoft offers the IoT Hub Device Provisioning Service, or DPS. The DPS uses enrollment groups to add devices to your IoT Hub. The concept is that once the device wakes up (oftentimes for the first time if it’s a new device), it needs to know that it should connect to your IoT Hub. In order to do that, the DPS needs to uniquely identify the device, and it does that with either a certificate or via a trusted platform module chip.
Once DPS confirms the identity of the device, it can use the enrollment group details to determine which IoT Hub it should be added to. It will then provide the device with the connection information to connect to that IoT Hub. In addition to that, the enrollment group can also provide the initial configuration for the device twin. This allows you to specify properties such as a firmware version that the device needs to have in when it starts.
As your devices send messages to IoT Hub, you can route those messages to Azure Storage, Event Hub, and various other endpoints. You can choose the type of messages you want to route, and you can also write a query to filter which messages are routed. In Figure 2-29, we have configured a route that sends messages to Azure Blob Storage. You can see in the query that we are only going to route those messages that come from a device with a device twin containing the tag for our researchInjectibles department.
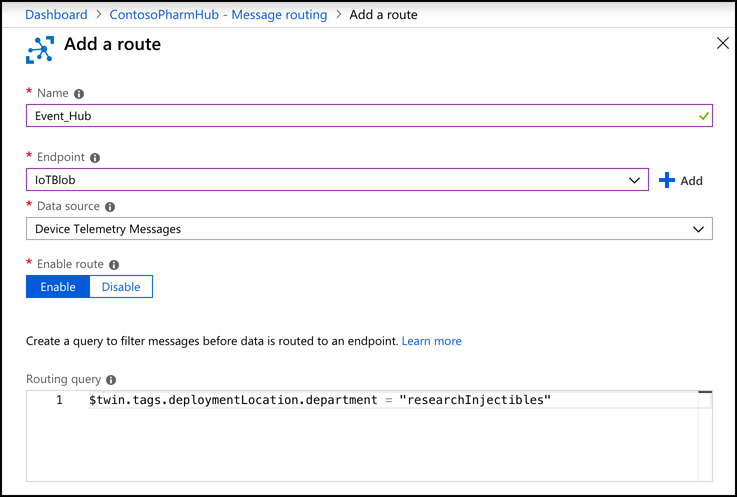
There are two pricing tiers for IoT Hub: Basic and Standard. Each tier offers multiple editions that offer pricing based on the number of messages per day for each IoT Hub unit. When you scale an IoT Hub, you add additional units. This adds the ability to handle more messages at an increased price. Table 2-4 shows the editions and pricing for the Basic tier. Table 2-5 shows editions and pricing for the Standard tier.
Table 2-4 IoT Hub Basic tier pricing
Edition |
Monthly Price per IoT Hub Unit |
Messages per day per IoT Hub Unit |
|---|---|---|
B1 |
$10 |
400,000 |
B2 |
$50 |
6,000,000 |
B3 |
$500 |
300,000,000 |
Table 2-5 IoT Hub Standard tier pricing
Edition |
Monthly Price per IoT Hub Unit |
Messages per day per IoT Hub Unit |
|---|---|---|
Free |
Free |
8,000 |
S1 |
$25 |
400,000 |
S2 |
$250 |
6,000,000 |
S3 |
$2,500 |
300,000,000 |
![]() Exam Tip
Exam Tip
Pricing for scale in IoT Hub is pretty clear. Most enterprises will choose the Standard tier because of the additional functionality available in that tier. They will then choose an edition that meets their minimal needs for messages. When they need additional messages during spikes, they’ll scale to more IoT Hub units.
For example, assume that ContosoPharm message needs are approximately 5,000,000 per day. They would choose the S2 pricing tier and pay $250 per month if they are running 1 IoT Hub unit. If the number of messages increase to 8,000,000 (either due to configuration changes or the addition of additional IoT devices), they would likely choose to scale to 2 IoT Hub units. Doing so would give them 12,000,000 messages per day at a cost of $500 per month.
Note Changing Pricing Tier
You cannot change to a lower pricing tier after you create your IoT Hub. If you create your IoT Hub in the Standard tier, you cannot change it to the Basic tier. If you create an IoT Hub in the Standard tier using the S1, S2, or S3 edition, you cannot change it to the Free edition.
It’s also important to note that the following features are only available in the Standard tier.
Device Streams for streaming messages in near real-time
Cloud-to-device messaging
Device management, device twin, and module twin
IoT Edge for handling IoT Devices at the edge of the network where they reside
If you use the Device Provisioning Service, there’s a charge of $0.10 for every 1,000 operations.
Azure IoT Central
IoT Hub is a great way to manage and provision devices, and it provides a robust means of dealing with messages. You can even use Azure Stream Analytics to route messages to Power BI for a near real-time dashboard of device messages, but doing that requires a bit of complex configuration. If you’re looking for a first-class experience in monitoring IoT devices without having to do complex configuration, IoT Central is a good choice.
IoT Central is a SaaS offering for IoT devices. Unlike IoT Hub, you don’t have to create any Azure resources to use IoT Central. Instead, you browse to https://apps.azureiotcentral.com and create your app within the web browser interface as shown in Figure 2-30.
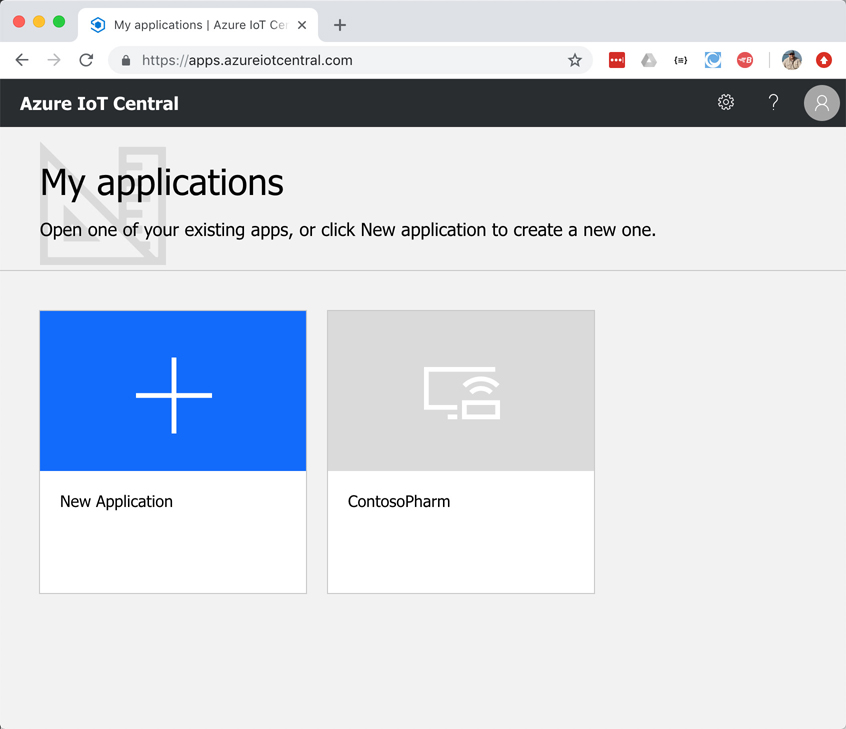
To create an IoT app, click on New Application. This opens the Create Application screen shown in Figure 2-31, where you can choose either the Trial plan (which does not require an Azure subscription) or Pay-As-You-Go using an Azure subscription. If you choose a Trial plan, you have 7 days to test IoT Central with any number of devices at no charge, and you can upgrade the app to Pay-As-You-Go at any time within those 7 days. If you choose Pay-As-You-Go, you pay based on the number of devices you have, but the first five devices are always free.
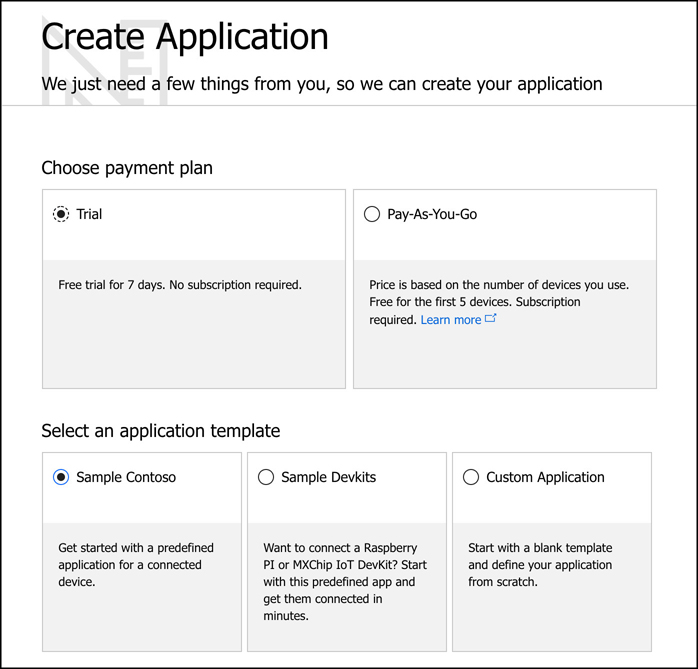
You also have the choice of choosing a template, or creating a blank template. The Sample Contoso template creates a sample app with a simulated refrigerated vending machine device. If you have a Raspberry PI or an MXChip IoT DevKit from the Azure IoT Starter Kit, you can use the Sample Devkits template. It has device templates so that you can add these devices to your IoT Central app. Finally, the Custom Application template allows you to start from scratch and add any IoT devices you may have.
After you select your template, scroll down to specify the name for your app and the URL. You can use the default names or specify your own, but it’s recommended to use your own so you can easily identify your app. Also, once your app has been created, you access it directly by using the URL you specify, so you may want that to be descriptive as well.
If you’re using Pay-As-You-Go, you’ll need to specify an Azure Active Directory associated with your subscription, your Azure subscription, and the region where you want to create your app. (It’s best to choose a region that’s geographically close to your IoT devices if possible.) Click Create to finish the creation of your app as shown in Figure 2-32.
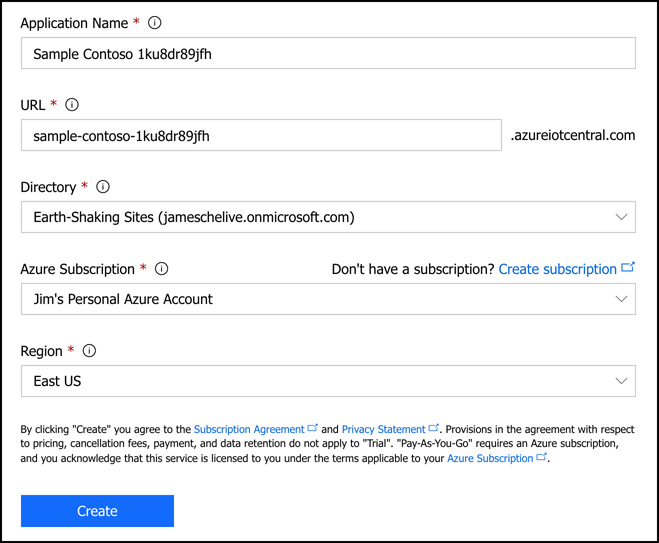
In Figure 2-30, you can see that we’ve already created an app called ContosoPharm. When you click on that app, you see a menu on the left side of the page, and if you click on Device Explorer, you can see any devices added as shown in Figure 2-33.
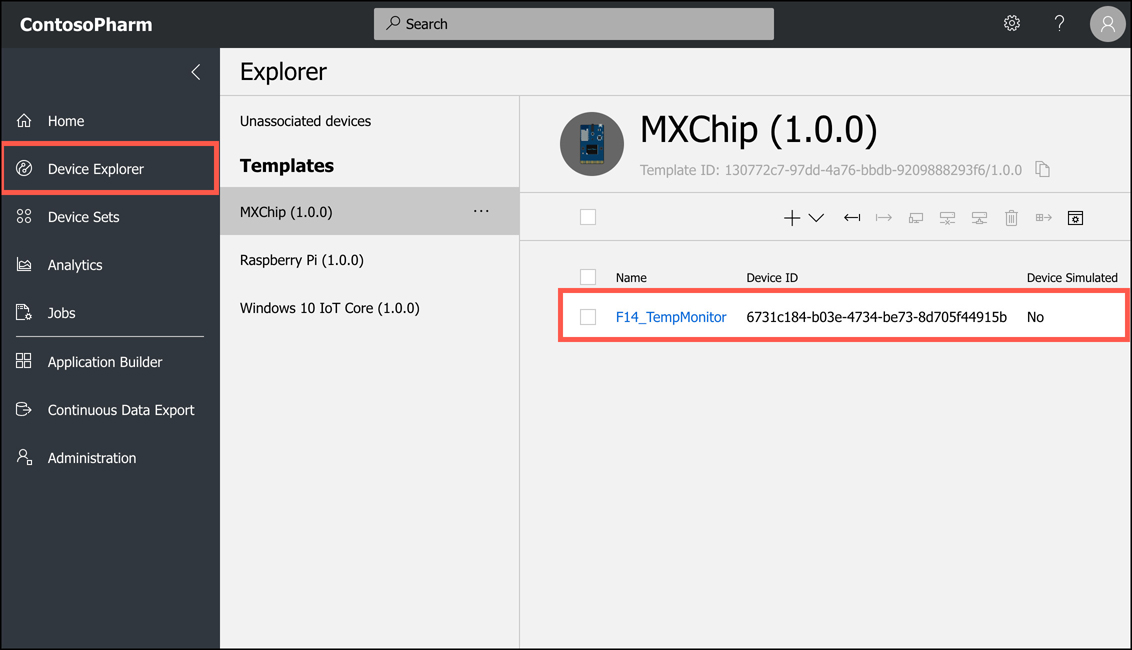
Add a new device by clicking the plus sign as shown in Figure 2-34. You have the option of adding a real device if you have one, but you can also add a simulated device. Adding simulated devices is a good way to get everything set up the way you want them in IoT Central and then you can add real devices at a later time.

Note Simulated Devices Is An IoT Central-Only Feature
The ability to create a simulated device is specific to IoT Central. IoT Hub doesn’t offer this capability.
Every page within your app can be edited directly in the browser. Figure 2-35 shows the home page for the IoT Central app. If you click on the Edit button, you can remove tiles, add tiles, and edit information in tiles in a point and click interface right within my browser.
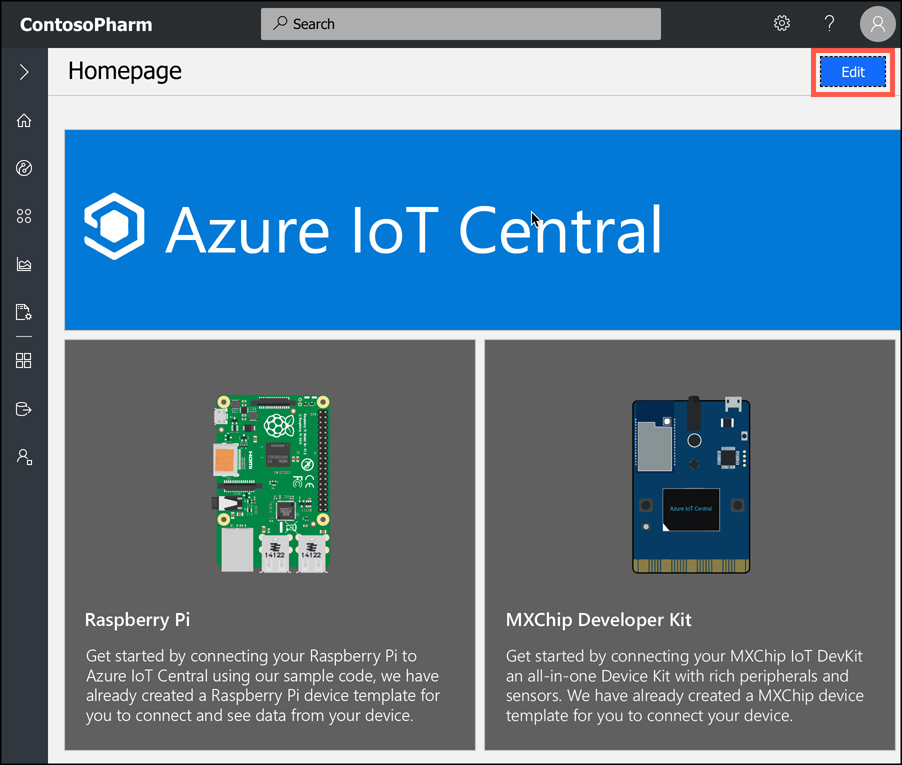
The reason we see an Edit button is because this user is set as the administrator of this application. IoT Central gives you control over who can do what using roles. There are three built-in roles you can assign a user to.
Application Administrator Users in this role have full access to the application and can edit page and add new users.
Application Builder Users in this role can edit pages, but they can’t perform any administrative tasks such as adding users, changing user roles, changing application settings, and so on.
Application Operator Users in this role can use the application, but they can’t edit any pages and they can’t perform administrative tasks.
In some situations, these built-in roles may not offer the flexibility you need, so Microsoft is working on allowing you to define your own roles with custom permissions.
To administer your application, click on Administration on the menu on the left as shown in Figure 2-36. You can then add and remove users, adjust user roles, change the application name or URL, add a custom image for your application, and so on. You can also copy or delete your application from this screen.

If you click on a device, you can look at information coming from the device’s sensors. In Figure 2-37, you can see the humidity and temperature sensors on a F14_TempMonitor device. Humidity is the top line and temperature is the bottom line. As you can see, we’re experiencing a small rise in temperature and a pretty strong rise in humidity.
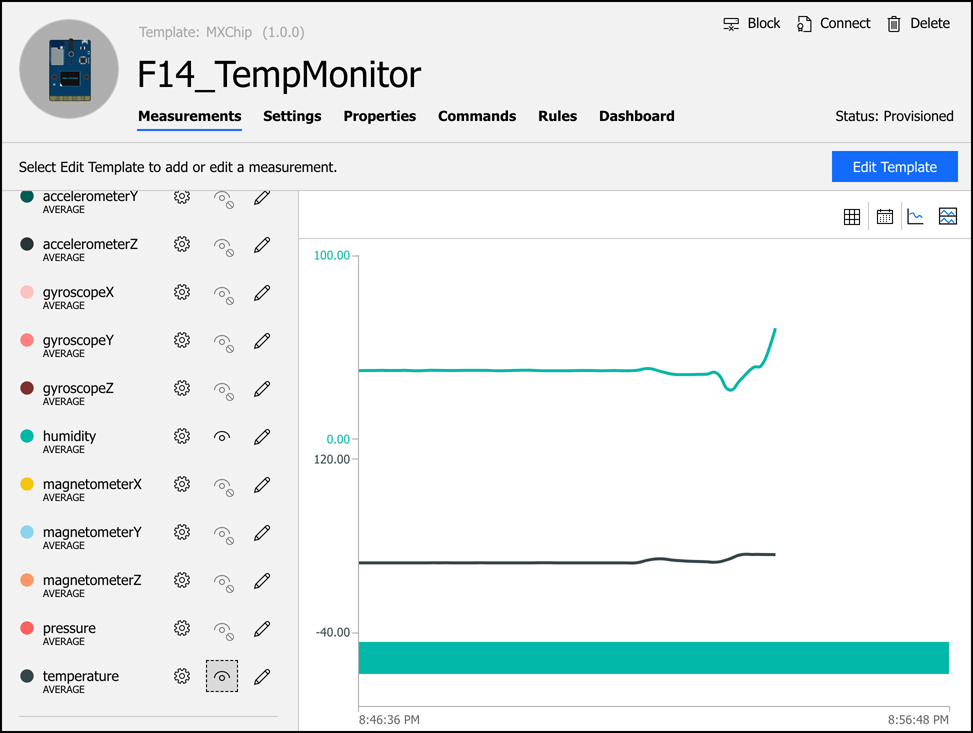
If you want a better view of data from your device, you can click on Dashboard as shown in the top of the screen in Figure 2-37. The dashboard, like other pages in your application, is customizable so that you can see exactly the data you want. Figure 2-38 shows a dashboard created for a device.

Note Dashboards
Dashboards are for a single device. If you want to see customized information for more than one device, you can add tiles for the devices to your home page located at https://<your_app_name>.azureiotcentral.com.
IoT Central also allows you to easily configure rules that will monitor your devices and perform an action you choose when your rule is activated. In Figure 2-39, we are configuring a rule that will activate when humidity reaches 60 or above. Notice that we also have a live historical view of the metric in a graph on the right so that you can make more intelligent decisions about the thresholds.
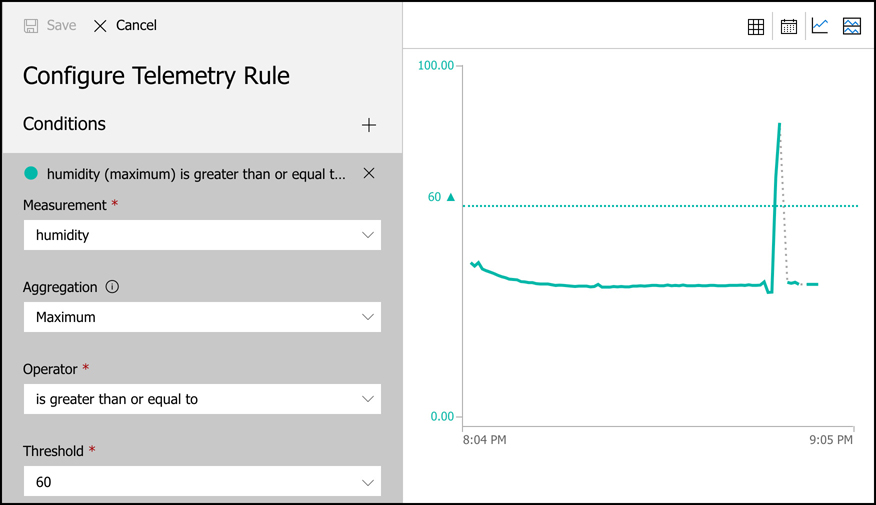
When a rule is triggered, IoT Central can send an email to someone with details of what happened. You can also choose to trigger a webhook, make a call to an Azure Function, run a workflow in an Azure Logic App, or run a workflow in Microsoft Flow. These options provide the flexibility to perform almost any task when a rule is triggered.
When you have a large number of devices, it’s convenient to group devices into a device set so that you can take action on many devices at a time. To create a device set, specify a condition that should be met for a device to be added to the set. In Figure 2-40, we’re creating a device set for all devices that have F14 in the name. If the name contains “F14,” the device is automatically added to the device set. Even when adding a new device at a later time, it will be part of this device set if the name contains “F14.”
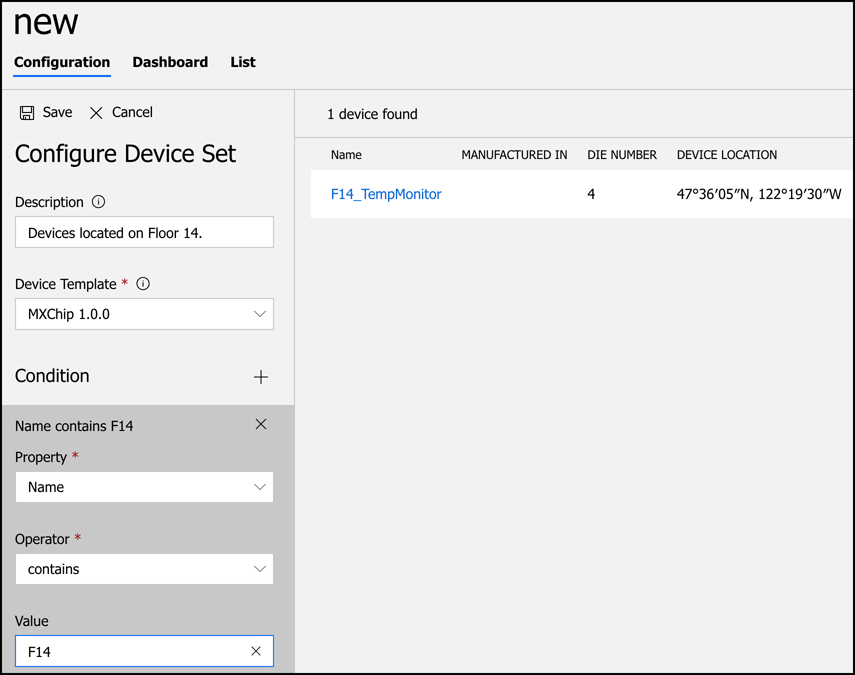
Once you’ve created a device set, you can take action on the devices in it by creating a job. Click on Jobs on the main menu of your application to configure your job. A job can modify properties, change settings, or send commands to devices. In Figure 2-41, we create a job that will turn the IR sensor on for all devices in our device set.

IoT Central also allows you to perform analytics on metrics from devices in a device set. For example, you can look at all devices that registered temperatures above a certain level. For even richer analytics of data, you can configure IoT Central to continuously export data from your devices to Azure Blob Storage, Azure Event Hubs, or Azure Service Bus.
Big Data and analytics
Businesses collect tremendous amounts of data from many different sources. As you’ve already learned, Microsoft offers an SLA on Azure services that are in the area of 99.9%+ for availability. Microsoft doesn’t put that number out there and then just cross their fingers that nothing goes wrong. They maintain enormous amounts of data on how the Azure infrastructure is operating, and they use that data to predict problems and react to them before they impact customers.
Because of the sheer enormity of the Azure infrastructure, you can just imagine how much data is being generated for every single system in that infrastructure, and in order to meet SLAs, they have to be able to reliably analyze that data in real time. How exactly do they do that? You can’t really throw that amount of data at a VM or a pool of VMs without overloading the system to the point of failure.
The problem of actually doing anything with the vast data we collect is common across all businesses, and this is what we mean by big data. Big data means more data than you can analyze through conventional means within the desired time-frame.
By placing big data in a data warehouse, you can then use massive amounts of computing power to analyze multiple pieces of data in parallel, and you can perform analysis on the data much more quickly than you otherwise could.
We’ll get into the analysis of big data later in this chapter. First, let’s talk about where to store big data. Microsoft has two Azure offerings for storing big data for analysis: Azure SQL Data Warehouse and Azure Data Lake Storage. They are similar in purpose but quite different in design.
![]() Exam Tip
Exam Tip
Azure Blob Storage can also be used as a data store for big data. However, SQL Data Warehouse and Data Lake Storage are explicitly designed for this purpose. Microsoft has also recently released Data Lake Storage Gen2, which combines the features of Blob Storage with Data Lake Storage, so the usage of Blob Storage for data warehousing is becoming unnecessary.
Azure SQL Data Warehouse
Azure SQL Data Warehouse is designed for storing big data that’s in the form of relational data. Data stored in SQL Data Warehouse is in a form quite similar to tables in a SQL Server database, and in fact, when you analyze data in SQL Data Warehouse, you run complex SQL queries against the data.
SQL Data Warehouse provides secure authentication using both SQL Server Authentication in the connection string, which is username and password authentication, and Azure Active Directory. Once a user is authenticated, you can only perform actions that you’ve been authorized to perform, and that authorization is controlled via database permissions.
While your data is in SQL Data Warehouse, it’s encrypted using Transparent Data Encryption (TDE) AES-256 encryption. Data is encrypted using a database encryption key, and this key is protected by a server certificate that’s unique to each SQL Database server. These certificates are rotated by Microsoft at least every 90 days, so you can be assured that your data is safe.
SQL Data Warehouse uses several methods to control costs. In fact, in a recent study by GigaOm, SQL Data Warehouse was found to be 94% less expensive than Google BigQuery and up to 31% less expensive than Amazon AWS Redshift. (SQL Data Warehouse was also much faster in benchmarks than either of these offerings.) One way SQL Data Warehouse reduces costs is by decoupling the data storage from compute resources. This allows you to easily scale to more compute resources when you need them, and then scale back down to save money when you no longer need the power.
There are two performance tiers available in SQL Data Warehouse, and both of them support scaling up or down and pausing resources so you don’t pay for them. The Gen1 performance tier measures compute resources in Data Warehouse Units, or DWUs. When you scale Gen1 data warehouses for more power, you add DWUs. The Gen2 tier uses compute Data Warehouse Units, or cDWUs. The difference is that Gen2 uses a local disk-based cache in order to improve performance. As long as you don’t scale or pause the data warehouse, the cache will substantially improve performance. If you do scale or pause, when the data warehouse is restarted, the cache will have to be refreshed, and you won’t experience the same performance improvement until that refresh is complete.
To use SQL Data Warehouse, you create an instance of it in Azure and then you load data into it using either queries against the database or by using tools like ADF Copy, SQL Server Integration Services, or the command line. You can then run complex queries against your data. Because of the power of SQL Data Warehouse, queries that would otherwise take several minutes to run can run in seconds, and a query that might take days to complete can finish in hours. Finally, you can use Microsoft’s Power BI to gain important insight into your data in an easy-to-use web browser-based environment.
More Info Migrating Data To Sql Data Warehouse
For more information on migrating data to SQL Data Warehouse, see: https://docs.microsoft.com/azure/sql-data-warehouse/sql-data-warehouse-migrate-data.
Azure Data Lake Storage
Like SQL Data Warehouse, Azure Data Lake Storage is designed for storing large amounts of data that you’d like to analyze, but Data Lake Storage is designed for a wide array of data instead of relational data. In a data lake, data is stored in containers. Each container typically contains related data.
Note Not Just Azure
The terms data lake and data warehouse aren’t specific to Azure. They are generic terms. A data lake refers to a repository of unordered data, and a data warehouse refers to a repository of ordered data.
The two common modes of accessing data are object-based (such as Azure Blob Storage) and file-based. In an object-based mode, there isn’t a hierarchy of objects. You simply store the object in a flat model. Traditional data lakes use the object-based access mode, but using this mode isn’t always efficient because it requires that you individually interact with each object.
With the introduction of Data Lake Storage Gen2, Microsoft introduced the concept of a hierarchical namespace to storage. This organizes the objects into a system of directories much like the structure of the files on your computer, and it allows for the use of both object-based and file-based models in the same data lake. Microsoft calls this capability multi-modal storage, and Data Lake Storage Gen2 is the first cloud-based solution to offer this capability.
Data Lake Storage is ideal for performing analysis against large amounts of data that aren't stored in a relational way. For example, the vast amounts of information that Google or Facebook might have stored on users can be held in a data lake for analysis. However, data from a data lake often isn’t ideal for presentation to users in a way that’s easy to understand. People work better with data that is relational, and for that reason, it’s pretty common for data to be analyzed in a data lake and then structured and moved into a data warehouse for further analysis and presentation.
Like Azure Blob Storage, Data Lake Storage is available in Hot, Cool, and Archive tiers. The Hot tier has the highest storage costs, but the lowest access costs. The Archive tier has the lowest storage costs, but it has the highest access costs.
If you use the file-based storage in Data Lake Storage Gen2, there are some additional costs for the metadata necessary to implement the file-based hierarchy. There are also some additional costs associated with operations that require recursive calls against the hierarchy. Data Lake Storage supports several open source data analytics platforms, including HDInsight, Hadoop, Cloudera, Azure Databricks, and Hortonworks.
Once you have data available in SQL Data Warehouse or Data Lake Storage, you can use one of Azure’s analytic services to analyze the data, including Azure HDInsight and Azure Databricks.
More Info Azure Databricks
Because Azure Databricks is a big data service most often used with machine learning, we’ll discuss it later in this chapter when we cover artificial intelligence.
Azure HDInsight
HDInsight makes it possible to easily create and manage clusters of computers on a common framework designed to perform distributed processing of big data. HDInsight is essentially Microsoft’s managed service that provides a cloud-based implementation of a popular data analytics platform called Hadoop, but it also supports many other cluster types as shown in Table 2-6.
Table 2-6 HDInsight supported cluster types
Cluster Type |
Description |
|---|---|
Hadoop |
Large-scale data processing that can incorporate additional Hadoop components such as Hive (for SQL-like queries), Pig (for using scripting languages), and Oozie (a workflow scheduling system.) |
HBase |
Extremely fast and scalable NoSQL database. |
Storm |
Fast and reliable processing of unbounded streams of data in real-time. |
Spark |
Extremely fast analytics using in-memory cache across multiple operations in parallel. |
Interactive Query |
In-memory analytics using Hive and LLAP (processes that execute fragments of Hive queries). |
R Server |
Enterprise-level analytics using R, a language that’s specialized for big data analytics. |
Kafka |
Extremely fast processing of huge numbers of synchronous data streams, often from IoT devices. |
Building your own cluster is time-consuming and often difficult unless you have previous experience. With HDInsight, Microsoft does all of the heavy lifting on their own infrastructure. You benefit from a secure environment, and one that is easily scalable to handle huge data processing tasks.
An HDInsight cluster performs analytics by breaking up large data blocks into segments that are then handed off to nodes within the cluster. The nodes then perform analytics on the data and reduce it down to a result set. All of this work happens in parallel so that operations are completed dramatically faster than they would be otherwise. By adding additional nodes to a cluster, you can increase the power of your analytics and process more data even faster.
When you create an HDInsight cluster, you specify the type of cluster you want to create and give your cluster a name as shown in Figure 2-42. You will also specify a username and password for accessing the cluster and an SSH user for secure remote access.
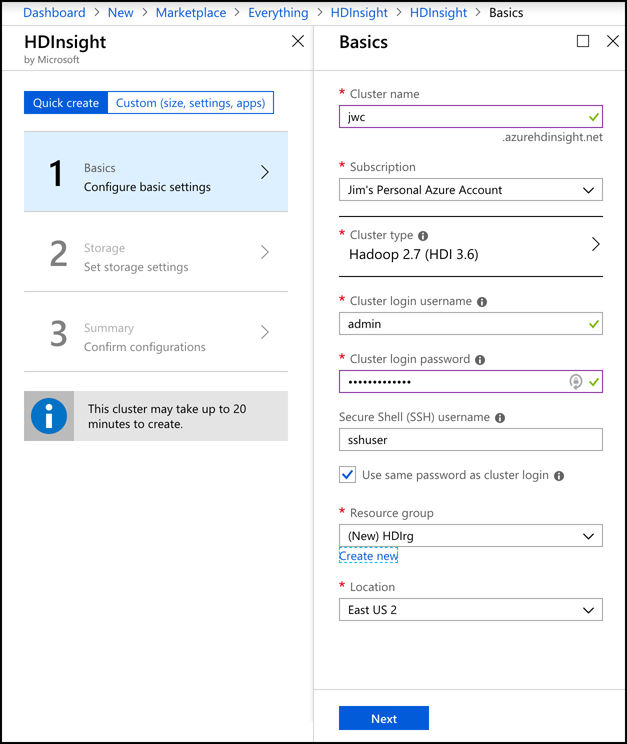
After you click the Next button, you configure the storage account and Data Lake Storage access if desired. Notice in Figure 2-43 that you only see Data Lake Storage Gen1. To use Data Lake Storage Gen2, you must create the storage account first and complete some additional configuration as outlined at: https://azure.microsoft.com/blog/azure-hdinsight-integration-with-data-lake-storage-gen-2-preview-acl-and-security-update/.
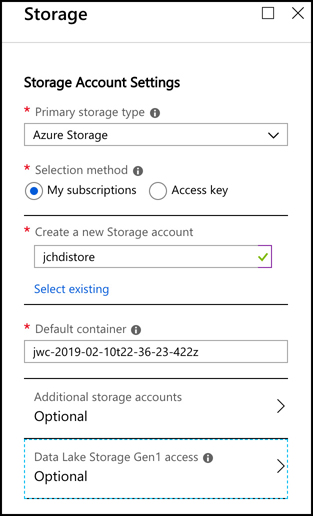
Note Quick And Custom Create
The quick create process in Figures 2-42 and 2-43 creates six Hadoop nodes with 40 cores. If you want a different configuration, you can click Custom (shown in Figure 2-42) to specify your own settings.
Once you start the creation of your Hadoop cluster, it may take up to 20 minutes to complete, depending on your configuration. Once your cluster is ready, you can start the analysis of data by writing queries against it. Even if your queries are analyzing millions of rows, HD Insight can handle it, and if you need more processing power, you can add additional nodes as needed.
HD Insight clusters are billed on a per hour basis, and you pay more per hour based on how powerful the machines are in your cluster. For full pricing details, see: https://azure.microsoft.com/pricing/details/hdinsight/.
Artificial Intelligence
Let’s circle back through what we’ve learned up to this point. We know that the number of IoT devices far surpasses the number of humans, and those IoT devices are generating enormous amounts of data. It’s pretty clear that there is a mind-boggling amount of data being collected.
We learned about technologies that allow us to store this tremendous amount of data and how we can keep it safe and access it quickly. What we haven’t talked about is what we do with all of that data. That’s where artificial intelligence (AI) comes into the picture.
Before we go too far into AI, let’s first come to an agreement on what we mean by AI. When many people think about computer AI, the image that comes to mind is a human-killing android or some other hostile technology obsessed with ridding the world of humans. You’ll be relieved to know that’s actually not what AI means in this context.
The AI of today is called Artificial Narrow Intelligence (or sometimes weak AI), and it refers to an AI that is capable of performing one specific task much more efficiently than a human can perform that same task. All of the AI that we’ve developed so far is weak AI. On the other end of the AI spectrum is Artificial General Intelligence, or strong AI. This is the type of AI you see depicted in movies and science fiction books, and we don’t currently have this kind of capability.
In many ways, it’s a bit misleading to call existing AI technology weak. If you place it in the context of the imaginary strong AI, it certainly has limited capabilities, but weak AI can do extraordinary things, and you almost certainly benefit from its capabilities every day. For example, if you speak to your phone or your smart speaker and it understands what you’ve said, you’ve benefitted from AI.
In the 1973 edition of Profiles of the Future, the famous science fiction writer Arthur C. Clarke said, “Any sufficiently advanced technology is indistinguishable from magic.” While AI was not yet a thing when Clarke made this assertion, the capabilities that AI make possible are certainly applicable, but AI isn’t magic. AI is actually mathematics, and as anyone familiar with computers will tell you, computers are very good at math.
In order to develop AI capabilities, computer engineers set out to give computers the ability to “learn” in the same way that the human brain learns. Our brain is made up of neurons and synapsis. Each neuron communicates with all of the other neurons in the brain, and together, they form what’s known as a neural network. While each neuron on its own can’t do much, the entire network is capable of extraordinary things.
AI works by creating a digital neural network. Each part of that neural network can communicate and share information with every other part of the network. Just like our brains, a computer neural network takes input, processes it, and provides output. AI can use many methods for processing the input, and each method is a subset of AI. The two most common are natural language understanding and machine learning.
Natural language understanding is AI that is designed to understand human speech. If we were to try and program a computer to understand the spoken word by traditional computing means, it would take an army of programmers decades to come anywhere close to usable recognition. Not only would they have to account for accents and vocabulary differences that occur in different geographic regions, but they’d have to account for the fact that individuals often pronounce words differently even in the same regions. People also have difference speech cadences, and that causes some words to run together. The computer has to know how to distinguish individual words when that might not be easy to do. In addition to all of this complexity, the computer has to account for the fact that language is an ever-changing thing.
Given this complexity, how did Amazon ever develop the Echo? How does Siri ever understand what you’re saying? How does Cortana know to crack a clever joke when we ask her about Siri? The answer in all of these cases is AI. We have millions of hours of audio recordings, and we have millions more hours in videos that include audio. There’s so much data available that no human being could ever process all of it, but a computer processes data much more quickly. Not only does it have more analytical pathways than humans do, but it also processes information much more quickly.
More Info Computers Are Fast
When I say that computers can process information more quickly than humans, I really mean it! Information in a human brain travels between neurons at a speed that’s just under the speed of sound. While that’s plenty fast for our needs, it’s nothing compared to computers. The information in an AI neural network travels at the speed of light, and that’s what enables computers to process enormous amounts of data. In fact, a computer’s AI system can process 20,000 years of human-level learning in just one week.
If we feed all of those recordings into a natural language understanding engine, it has plenty of examples in order to determine what words we’re speaking when we say something to a smart speaker or smart phone, and determining the meaning of these words is simply pattern recognition. As Apple, Amazon, and Microsoft were working on this technology, they fine-tuned it by getting your feedback. Sometimes they might actually ask you whether they got it right, and other times, they might assume they got something wrong if you just bowed out of the conversation early. Over time, the system gets better and better as it gets more data.
Machine learning (ML) is similar in that it uses a neural network to accomplish a task, but the task is different than understanding speech. In fact, machine learning can be used in many applications. One of the common uses of machine learning is image recognition. As it turns out, AI neural networks are particularly good at recognizing patterns in images, and just like audio, we have an enormous amount of data to work with.
![]() Exam Tip
Exam Tip
In ML, the process of decision making at several points along the AI neural network is known as the ML pipeline. It’s a series of decisions made by the ML model that eventually results in a particular output.
Many examples of ML relate to image processing because ML is well-suited to doing that kind of work. However, a lot of ML focuses on using existing data to make a prediction about what will happen in the future, and to do that with a high degree of reliability.
We’re likely all aware that satellites have been photographing the surface of the earth for quite some time. We have detailed imagery from just about every square inch of our planet, and those images are valuable in many ways. For example, scientists who are working on conservation efforts benefit by knowing how our planet is changing over time. Forest engineers need to know about the health of our forests. Wildlife conservationists need to know where to focus efforts on where animals are most at risk. By applying an ML model to all of these images, Microsoft is able to serve all of these needs.
More Info Microsoft AI For Earth
For more information on all the ways Microsoft is using AI for conservation and earth sciences, see: http://aka.ms/aiforearth.
Image analyzing AI isn’t limited to the planetary scale. It’s also helpful when we want to search through our own pictures. Perhaps you want to find all of the pictures you’ve taken of a particular person, or maybe you’re interested in finding all of your pictures of flowers. Your phone can likely do this kind of thing, and it does it by using AI and ML. In fact, Google Photos is even able to identify specific people in photos when the time between two photos is decades apart. All of this uses ML.
ML uses a learning algorithm that is the basis for the AI. Once the algorithm is developed, you feed test data to it and examine the result. Based upon that result, you may determine that you need to tweak the algorithm. Once the algorithm is suitable to your task, you typically deploy it to an environment where it has a vast array of compute resources that you can allocate to it. You can then feed huge amounts of data to it for processing. As the algorithm deals with more data, it can improve itself by recognizing patterns.
When you’re testing an ML model, you typically set up a scenario where only a portion of your complete dataset is sent to your model for training. Once your model is trained, you send the rest of your data through your model in order to score the results. Since you’re dealing with a historical dataset, you already know that which your model is attempting to figure out, so you can accurately determine the accuracy of your model. Once you have achieved the desired accuracy of your model, you can deploy it and begin using it against production data.
Even with careful modeling and scoring, ML algorithms can make mistakes. In a paper on ML published in 2016, Marco Ribeiro, Sameer Singh, and Carlos Guestrin wrote about an ML experiment that was designed to look at pictures and differentiate between dogs and wolves. As it turns out, the algorithm was making plenty of mistakes, but the humans couldn’t figure out why.
When they went back and tested the ML algorithm to determine how it was making these incorrect decisions, they found that the algorithm had come to the conclusion that pictures with wolves in them had a snowy background and pictures with dogs had grass in the background. Therefore, every picture with a dog-like creature that was taken on a snowy background was immediately classified (sometimes incorrectly) as a wolf.
More Info AI And Trust
The wolf analogy illustrates one of the primary concerns of AI, and that is how to determine when to trust an AI model. If you want to dig into this concept, check out this paper referenced at: https://arxiv.org/pdf/1602.04938.pdf.
When you’re dealing with developing and using AI with the enormous amount of data available today, the cloud offers some distinct advantages. You can take advantage of the enormous computing resources that cloud providers make available, and you can use those resources in time slices only when you need to do work. This makes it possible to use more powerful resources than you’d have available on-premises, and it also makes it possible to control your costs by scaling your usage.
Microsoft offers many technologies in Azure to help you with your AI and ML needs. You can even get started without doing any of your own AI and ML work by using some of the provided services that Microsoft itself uses. These services are part of Azure Cognitive Services, and they include:
Computer Vision Analyze images and recognize faces, text, and handwriting.
Microsoft Speech Recognize, transcribe, and translate speech.
Language Understanding Intelligent Service (LUIS) Natural language service that uses ML to understand speech and take action on it.
Azure Search and Bing Search Search for specific data in order to build complex data sets.
These offerings allow you to fast-track your ML capabilities by taking advantage of work Microsoft has done to support its own services like Bing, Office 365, and more. Microsoft also provides resources you can use to build your own offerings using many of the tools that engineers are already familiar with. They even provide a feature-rich development environment called Visual Studio Code that runs cross-platform and allows for rapid development of ML models.
Microsoft also supports numerous ML frameworks that are commonly used by developers of AI solutions. These include ONNX (Open Neural Network Exchange), Pytorch, TensorFlow, and Sci-Kit Learn. This allows AI programmers (known as data scientists) to get started in Azure without having to learn new frameworks and techniques.
Azure services aimed at data scientists run the frameworks mentioned above. These services include Azure Databricks, Azure Machine Learning Service, and Azure Machine Learning Studio. Powering these services are infrastructure components especially well-suited to AI and ML.
Azure Databricks
We’ve looked at some of the Azure services for storing big data such as SQL Data Warehouse and Azure Data Lake Storage. Data that gets stored in these services is typically raw data that is often unstructured and difficult to consume in order to build a ML model. We also may need data for our ML model that comes from multiple sources, some of which may even be outside of Azure. Azure Databricks is an ideal solution for accumulating data and for forming the data (called data modeling) so that it’s optimal for ML models.
Figure 2-44 shows a new instance of an Azure Databricks resource. All of your interactivity with Databricks is via the Databricks workspace, a web-based portal for interacting with your data, and to access the workspace, click on the Launch Workspace button shown in Figure 2-44.
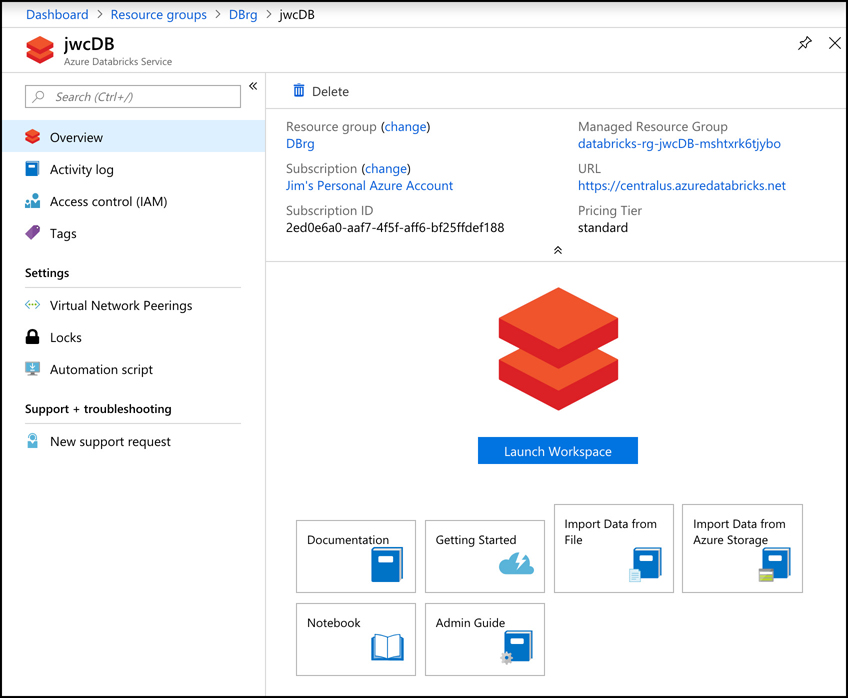
When clicking on Launch Workspace, you’re taken to the Databricks workspace. Azure will automatically log you in when you do this using your Azure account. My Databricks instance is completely empty at this point. Along the left side of the page (as shown in Figure 2-45) are links to access all of the Databricks entities such as workspaces, tables, and jobs. There’s also a Common Tasks section, which allows you to access these entities, as well as to create new notebooks, which are detailed soon.
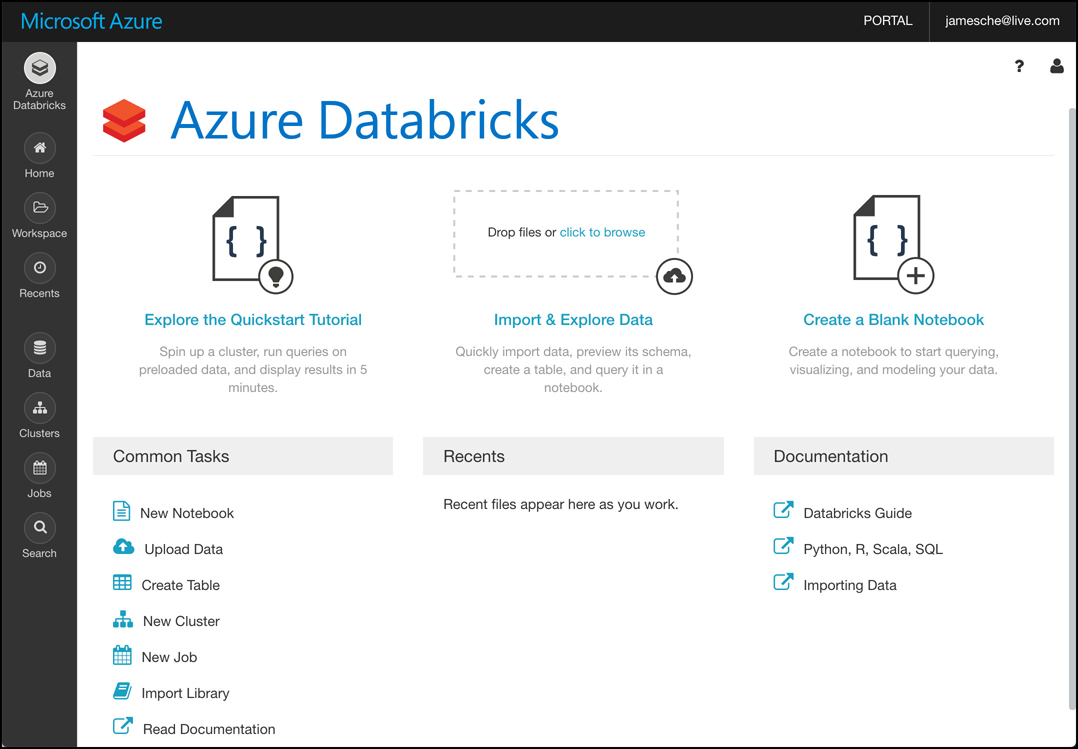
Let’s now create a cluster. Databricks does all of its work using clusters, which are the compute resources. To create a cluster, you can click on New Cluster under Common Tasks. You’ll now see the Create Cluster screen shown in Figure 2-46, where the new cluster has been named “jcCluster,” and all other options are the default.
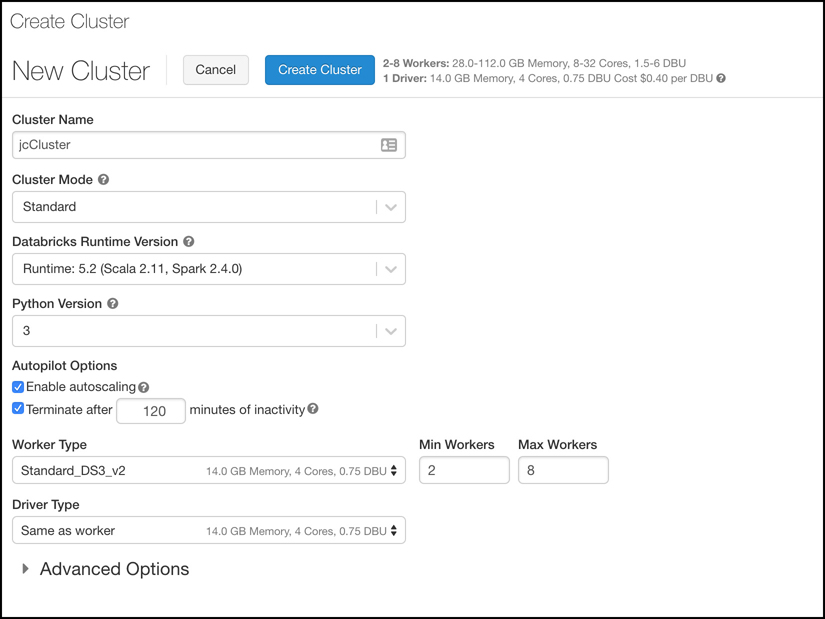
Next, we’ll create a notebook. Notebooks are a powerful way to present and interact with data that is related. Each notebook contains not only data, but also visualizations and documentation of that data to help us understand the data. Once your data is in your notebook, you can run commands against ML frameworks in order to build your ML model right inside of your notebook.
Clicking the Azure Databricks button in the menu on the left (shown in Figure 2-45) allows you to then click on New Notebook to create a notebook. In Figure 2-47, we create a new notebook that uses SQL as the primary language. Databricks will assume that the code written in this notebook will be SQL code unless specified. You can also choose to specify Python, Scala, or R as the language.

After you create a new notebook, you’ll see an empty notebook with one cell. Inside of that cell, you can enter any data that you wish. For example, you might want to have some documentation that defines what this notebook contains. Documentation in notebooks is entered using markdown, a language that’s well-suited to writing documentation. Figure 2-48 shows the new notebook with some markdown that documents what’s in the notebook. Notice that the markdown starts with “%md.” This tells Databricks how the content that follows is in markdown and not in the primary language of SQL.
If you click outside of this cell, the markdown code will be rendered in HTML format. In order to add some data to this notebook, you need to create a new cell by pressing “B” on your keyboard or by hovering over the existing cell and clicking the “+” button to add a new cell.
Note Keyboard Shortcuts
Keyboard shortcuts are by far the fastest way of working in Databricks. You can find the entire list of keyboard shortcuts by clicking the “Shortcuts” link shown in Figure 2-48.
After pressing “B” on your keyboard, a new cell is inserted at the end of your notebook. You can enter some SQL code in this cell in order to populate a table with some data as shown in Figure 2-49. (This code was taken from the Databricks quick start tutorial at https://docs.azuredatabricks.net/getting-started/index.html.) After entering your code, you can run it by clicking on the Run button.

More Info Where Data Comes From
Notice that the path entered for the data starts with/databricks-datasets. When creating a cluster you gain access to a collection of datasets called Azure Databricks Datasets. Included in these datasets is some sample data in a comma-separated values format, and the specified path points to that data. When this command runs, it pulls that data into your notebook.
You can run a query against the data that was added using the command shown in Figure 2-49 by writing a SQL query in a new cell. Figure 2-50 shows the results of a query against the data.
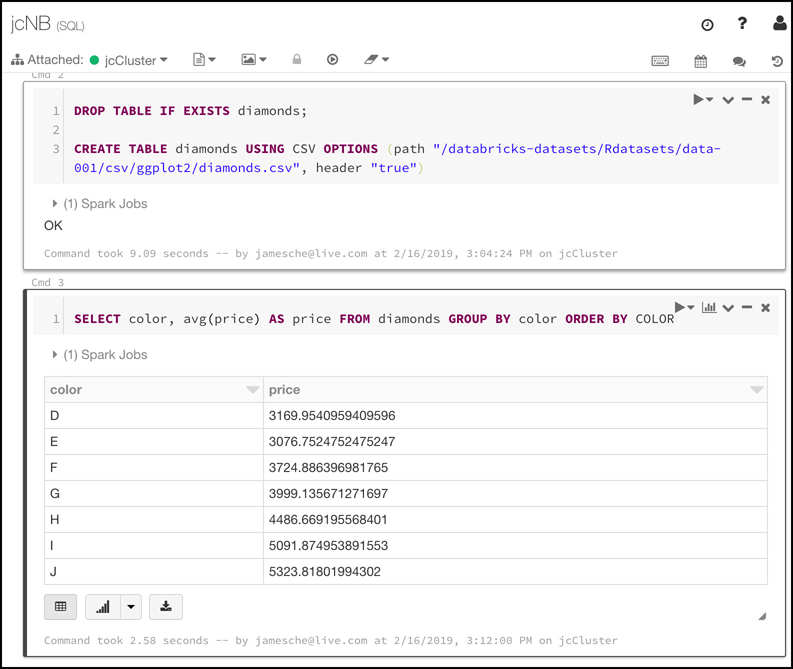
When you run commands in a cell, Databricks creates a job that runs on the compute resources you allocated to your cluster. Databricks uses a serverless model of computing. That means that when you’re not running any jobs, you don’t have any VMs or compute resources assigned to you. When you run a job, Azure will allocate VMs to your cluster temporarily in order to process that job. Once the job is complete, it releases those resources.
This example is quite simple, but how does all of this relate to ML? Azure Databricks includes the Databricks Runtime for Machine Learning (Databricks Runtime ML) so that you can use data in Databricks for training ML algorithms. The Databricks Runtime ML includes several popular libraries for ML, including: Keras, PyTorch, TensorFlow, and XGBoost. It also makes it possible to use Horovod for distributed deep learning algorithms. You can use these components without using Databricks Runtime ML. They’re open source and freely available, but the Databricks Runtime ML saves you from the hassle of learning how to install and configure them.
![]() Exam Tip
Exam Tip
A discussion of how you program ML models is far outside of the scope of the AZ-900 exam and we won’t discuss it here. The important point to remember is that Databricks works with third-party ML frameworks to allow you to build ML models.
To use the Databricks Runtime ML, you’ll need to either specify it when you create your cluster, or edit your existing cluster to use it. You do that by choosing one of the ML runtimes as shown in Figure 2-51.

You’re not limited to the libraries included with Databricks Runtime ML. You can configure most any third-party ML tools in Azure Databricks, and Microsoft provides some pointers on doing that in their documentation located at: https://docs.azuredatabricks.net/spark/latest/mllib/index.html#third-party-libraries.
![]() Exam Tip
Exam Tip
You might have noticed several references to Spark in Databricks. That’s because Databricks is based on Apache Spark, an open source system for doing computer work in a clustered environment.
Once you’ve built your ML model in Databricks, you can export it for use in an external ML system. This process is referred to as productionalizing the ML pipeline, and Databricks allows you to productionalize using two different methods: MLeap and Databricks ML Model Export.
MLeap is a system that can execute an ML model and make predictions based on that model. Databricks allows you to export your model into what’s called an MLeap bundle. You can then use that bundle in MLeap to run your model against new data.
Databricks ML Model Export is designed to export your ML models and pipeline so that they can be used in other ML platforms. It’s specifically designed to export Apache Spark-based ML models and pipelines.
Azure Machine Learning Service
The Azure Machine Learning Service provides a cloud-based solution for building ML models. The Machine Learning Service uses a programming language called Python, so you’ll need to be familiar with Python to use the service.
The main purpose of the Azure Machine Learning Service is to use cloud-based resources to run the complex computations necessary to build ML models. Unlike Databricks where everything is in the cloud, with Machine Learning Service, you can build your data sets on-premises and then upload your data to the cloud to do ML modeling.
Like Databricks, Machine Learning Service uses notebooks. You can use Jupyter Notebooks on-premises, but you can also use Azure Notebooks, a cloud-based Jupyter Notebook offering from Microsoft. Whether you use a local notebook or Azure Notebooks, you’ll typically start things off by training your model locally in order to save on compute costs. Once you’re ready to train your model in Machine Learning Services, you can move the data to the cloud, create a cloud-based script for your model, and start training your model, all within your notebook.
Figure 2-52 shows output of training a ML model tested on a local machine. This model looks at images of handwritten numbers and attempts to correctly identify the numbers that were written. It took three minutes to train on a local machine, providing us with a 92% accuracy level.

When you submit your model to your Machine Learning Service cluster for training, it will prepare the model and then queue it for training in the cluster. Like Databricks, the Machine Learning Service is a serverless service, meaning you only use compute resources when your using the cluster. When you submit a job, it’s queued until compute resources are available, usually taking only a few seconds. Once your job completes, those resources are released.
In Figure 2-53, we’ve sent the model to a cluster in Machine Learning Services running an experiment on it to test for accuracy. If you click the link to the Azure portal, you can see additional information about the run.

In Figure 2-54, you can see the node in the cluster where this script is running. In this test, we only have one node in the cluster, but you can add additional compute resources if needed. If you were training a complex model, you might want to add compute resources in order to more quickly train that model.
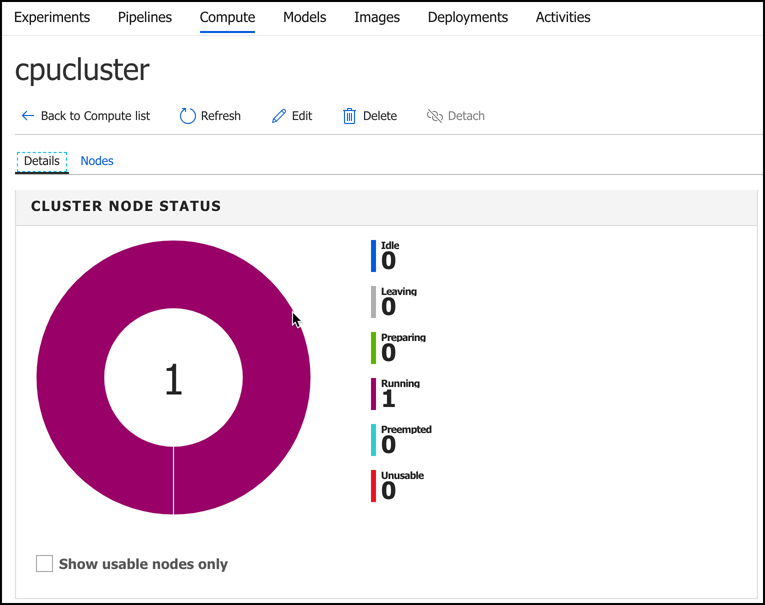
When you train models in Machine Learning Services, a Docker container is created, and your model actually runs inside of that container. A Docker container is a zipped copy of everything that’s necessary to run your model. That zipped copy is called a Docker image, and it can be run on any computer that is running the Docker runtime, including the VM that makes up your Machine Learning Services cluster.
When you want to export your model so that you can use it in a production workload, you can export it as a Docker image. By using Docker images, Machine Learning Services is able to make your model portable so that it can run just about anywhere. In addition to that, you can use powerful container clustering services like Azure Kubernetes Service to run your models at large scale.
More Info Docker Containers
A discussion of Docker containers is outside of the scope of this guide, but if you’re interested in learning more about Docker, see: https://www.docker.com.
Machine Learning Services can also export your model as an FPGA image. FPGA stands for field-programmable gate array, and it’s similar to a microprocessor except that it can be programmed by a user after manufacturing. FPGAs are extremely fast because they can be programmed explicitly for the task at hand. The only thing faster for AI processing is the application-specific integrated circuit, or ASIC, but an ASIC must be manufactured for its end purpose. It cannot be reprogrammed later.
Microsoft has invested heavily in an FPGA infrastructure for AI, and FPGAs are available today in every Azure data center. In fact, Microsoft powers its own cognitive services for Bing search and more using FPGAs.
Azure Machine Learning Studio
The AZ-900 exam is not a technical exam, and it’s pretty tough to tackle the concept of ML and AI without getting technical. Up until this point, we’ve tried to keep things at a high level and not get too technical, and because of that, some of the concepts might be a little hard to grasp. Thankfully, there’s a way to deal with ML concepts in a visual way. Azure Machine Learning Studio allows people who aren’t data scientists to delve into ML and gain a better understanding of the concepts we’ve discussed up to this point.
Machine Learning Studio is SaaS for ML. It provides an easy-to-use drag and drop interface for creating, testing, and deploying ML models. Instead of having to write your own models, Machine Learning Studio includes a large collection of pre-written models that you can apply to data. The best way to get a handle on Machine Learning Studio is a hands-on approach, so let’s use Machine Learning Studio to build an ML model and test it.
To launch Machine Learning Studio, open a web browser and browse to https://studio.azureml.net. Click Sign-In in the upper right corner and sign in with your Azure subscription username and password.
Once Machine Learning Studio opens, you’ll be taken to your default workspace. A workspace is a logical container for your experiments, datasets, models, and so on. Machine Learning Studio assigns your workspace a default name, but you can change it by clicking on Settings in the lower left corner as shown in Figure 2-55.

Notice in Figure 2-55 that the workspace type is Free. There are two tiers in Machine Learning Studio: Free and Standard. The Free tier is for experimentation while the Standard tier is what you’d want to use if you are using your ML model in a production scenario. There are additional capabilities in the Standard tier, and you have to pay for workspaces that use the Standard tier.
More Info Pricing Of Machine Learning Studio Tiers
For more information on the features and pricing of Machine Learning Studio tiers, click on the Learn More link next to Workspace Type as shown in Figure 2-55. This will take you to the pricing page for Machine Learning Studio.
When you create a workspace by browsing directly to Machine Learning Studio, it will always be in the Free tier. If you want to create a workspace in the Standard tier, you will need to use the Azure portal to create a Machine Learning Studio Workspace. You can then choose your tier.
The Free tier is fine for our purposes because we’re just running some tests. Change the workspace name to “AZ-900-Workspace” and add a useful description. You can then click Save at the bottom of the screen to save your new name and description.
We’re now ready to create our ML model, but before we do, let’s review exactly what we’re going to do. We will:
Create an experiment so that we can test and train the ML model.
Add data we will use to train the ML model.
Add a pre-existing ML algorithm from Machine Learning Studio.
Configure Machine Learning Studio to train the model based on the dataset.
Run an experiment to see how reliable the ML algorithm is.
For this experiment, we’re going to use data that’s included with Machine Learning Studio. The data shows arrival and departure on-time data for various airlines over a one-year period. We will use this data to build a model that will predict the likelihood of a particular flight arriving on-time at its destination.
Step 1: Create an Experiment
The first step to building a ML model for our flight prediction is to create a new experiment. This is where we will create and test the ML model, and it’s called an experiment for a reason. After we test the model, we’ll change some things to try and increase the reliability of the model.
To create an experiment in Machine Learning Studio, click on Experiments on the menu on the left, and then click the New button at the bottom of the screen, as shown in Figure 2-56.

When you do this, you’ll see a collection of templates that Microsoft provides for experiments. These are all pre-built ML experiments, and you can learn a lot by choosing one of them to see how they work, but for our purposes, we’re going to start with a blank experiment. You then click on Blank Experiment as shown in Figure 2-57.

Once you’ve created your experiment, you’ll see the screen shown in Figure 2-58. On the left side, you’ll see a list of all the items you can add to your experiment. You’ll see a list of sample data, but if you scroll down, you’ll see all kinds of items you can use to build a model.
The main part of the screen is where you’ll build your model, and you’ll do that by dragging items from the list on the left and dropping them onto the main screen. You’ll then connect items together to build your model.
Before we do that, let’s rename this experiment so we’ll be able to easily identify it. Your experiment name appears at the top of the screen. Click on that and enter a new name for your experiment as shown in Figure 2-58.
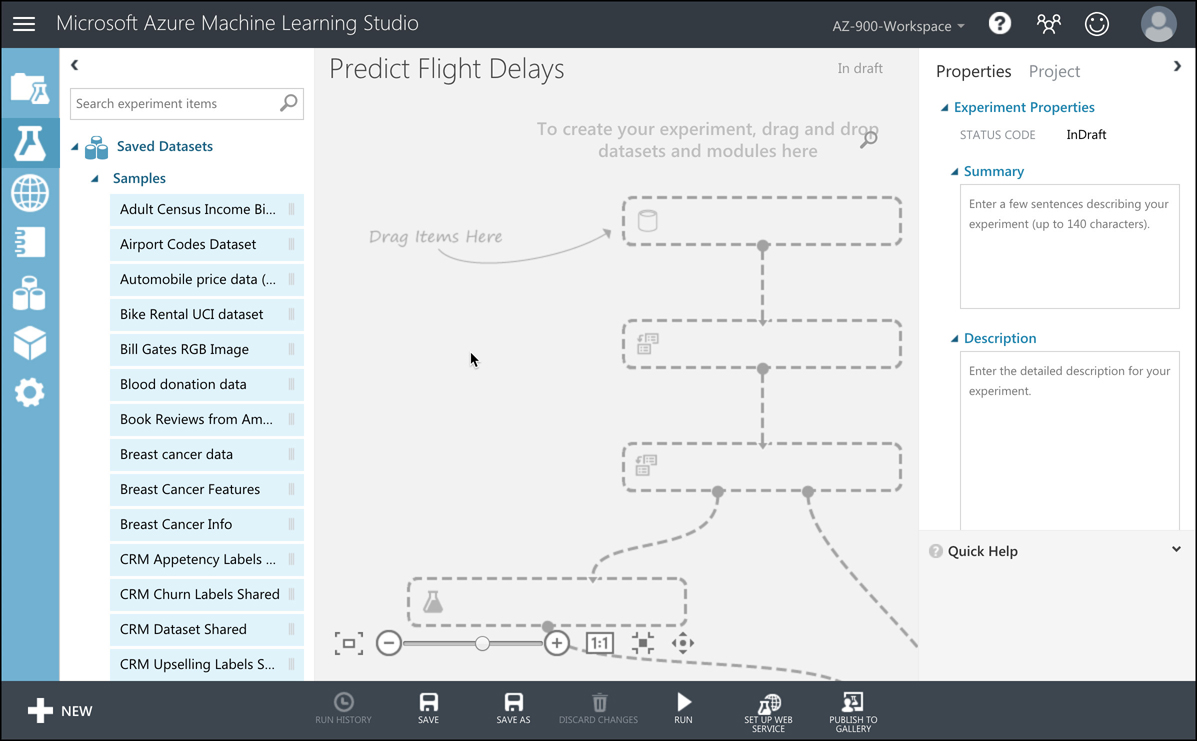
Step 2: Add Data
In order to train a ML algorithm, you need to feed data into it. ML uses historical data to learn how to predict a particular result in the future, and the more data you use to train your model, the more reliable your model will be.
Machine Learning Studio makes it easy to import data from Azure Blob Storage, Azure SQL Database, Hive queries, Azure Cosmos DB, and more. For our ML model, however, we’re going to use some sample data that’s included with Machine Learning Studio.
To find the data we want to use, enter “flight” in the search box on the left. When you do, you’ll see “Flight Delays Data.” This is the data we want to use, so click on it and drag it to the main screen on the right as shown in Figure 2-59.
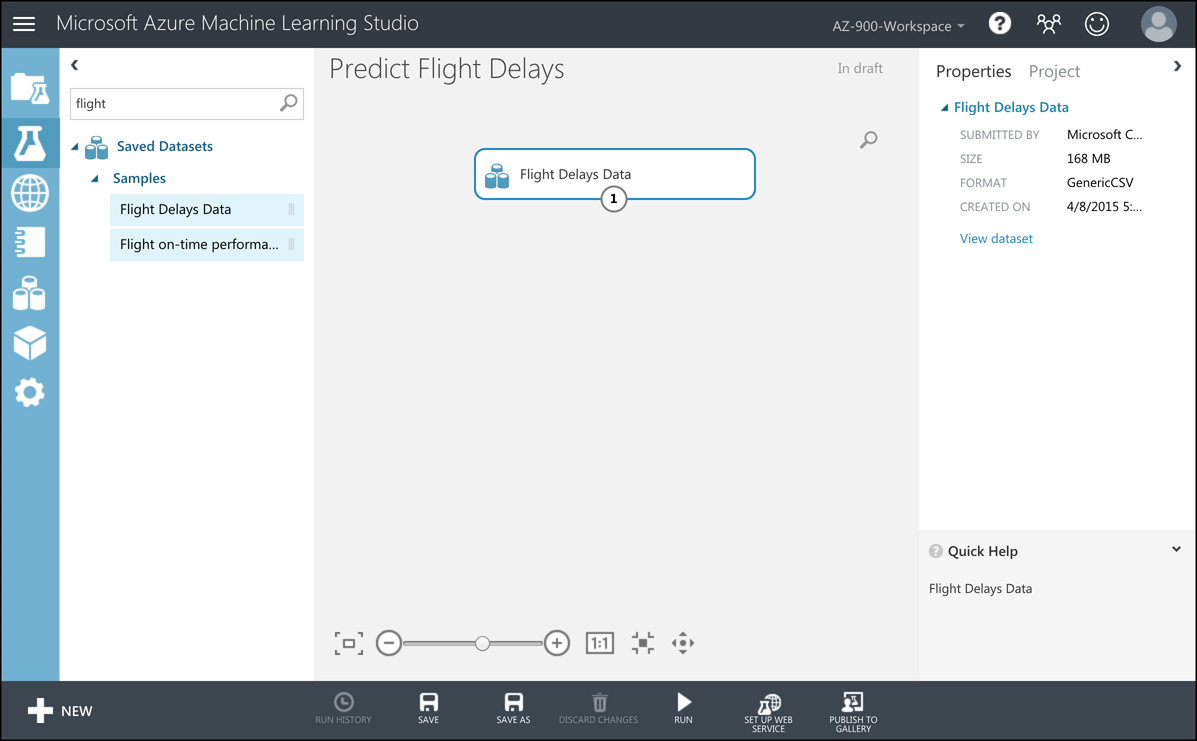
Before you do any work building a ML model, you need to have a good understanding of the data you will use to train that model. Only by having a good understanding of your data will you be able to build a reliable model, and Machine Learning Studio makes it easy to learn about your data. If you right-click on the Flight Delays Data item you just dragged onto your experiment, you can click on Dataset and then Visualize, as shown in Figure 2-60, to see the data contained in the dataset.
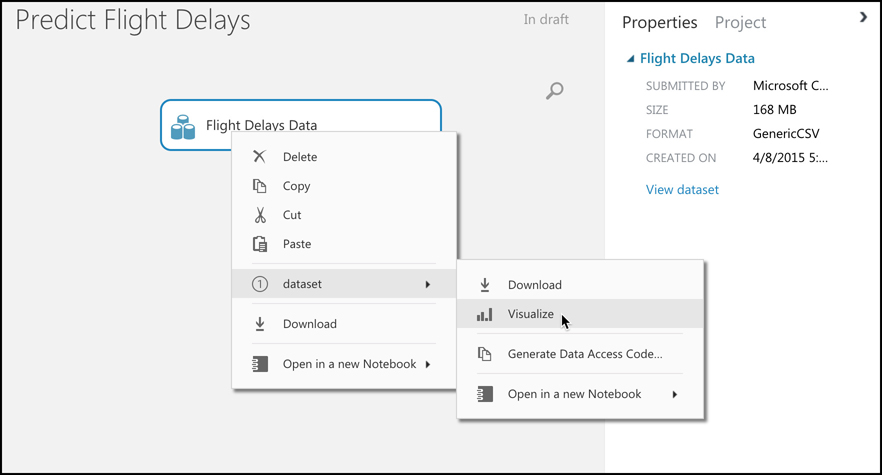
Once your dataset opens in Machine Learning Studio, you will see that we have a little over 2.7 million rows of data to work with. If you click on the Month column header, you’ll see that we have 7 unique values for the month as shown in Figure 2-61. That means we have data here for 7 months out of the year, and while not perfect, that will suffice for what we’re doing. If you were going to use our model in a real scenario, you’d likely want more data for additional months.
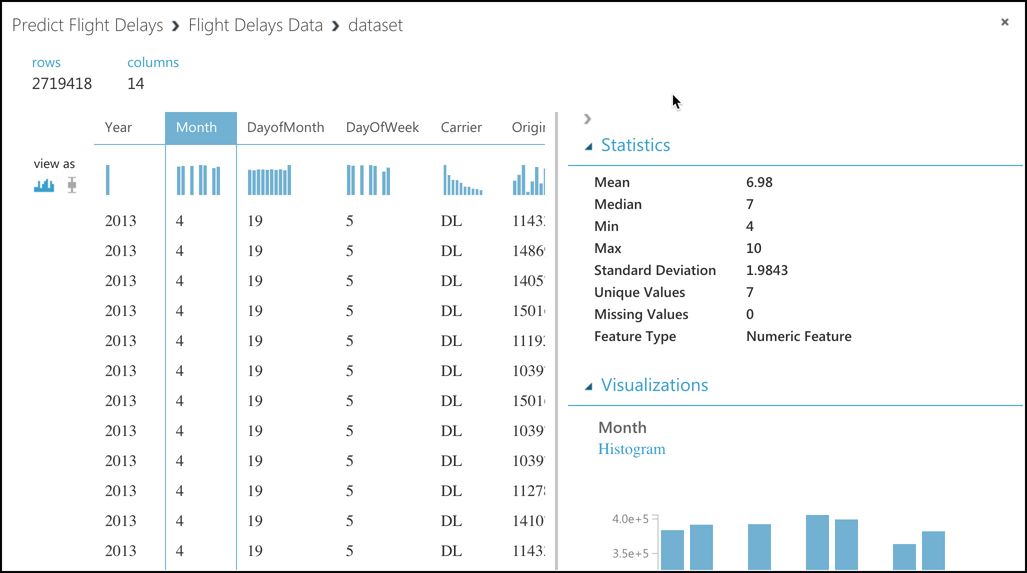
One important thing to pay attention to with ML modeling data is the Missing Values field shown in Figure 2-61. A missing value means that data is either missing completely or you have a 0 in a numeric field. If you are missing data, your model will be flawed, so you’ll want to try and ensure you’re not missing important data.
In this particular dataset, we have some columns that have missing values. Machine Learning Studio includes items you can add to your model to account for missing values. Click the X in the upper-right corner of your dataset to close it. Enter “missing” in the search box and you’ll see an item under Data Transformation called Clean Missing Data. Drag that into your model as shown in Figure 2-62.

In order for Clean Missing Data to do anything to the dataset, we need to feed the dataset into it. To do that, click on Flight Delays Data and you’ll see a circle with a “1” in it. That circle represents the output of the dataset, and we need to connect that to the input of the Clean Missing Data transformation. Click and hold on the “1” and drag it down to the small circle at the top of Clean Missing Data. You’ll see the small circle at the top of Clean Missing Data turn green as shown in Figure 2-63. Once the two nodes are connected, release your mouse button.
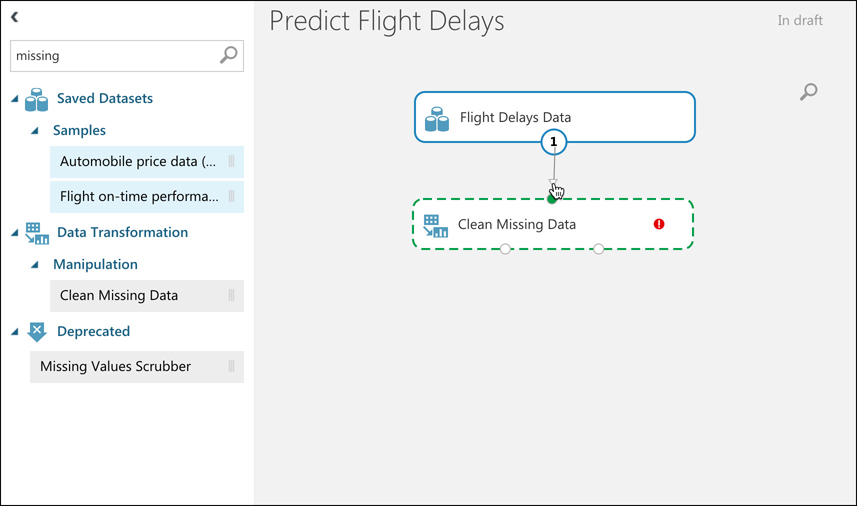
Now we need to tell Machine Learning Studio what we want to do about missing values. Click on Clean Missing Data and you’ll see some properties you can set in the pane on the right. The first thing we need to do is select the columns that have missing values.
We can discover those columns by visualizing the dataset as shown in Figure 2-61. Based on that, we know that the DepDelay, DepDel15, and ArrDelay columns all have missing values. However, in the model, we aren’t concerned with the DepDelay or ArrDelay columns. These columns contain the number of minutes a flight was delayed in departure or arrival, but the columns we want to use are DepDel15 and ArrDel15. Those columns will contain a 0 if a flight departed or arrived within 15 minutes of the schedule and a 1 if it didn’t. Therefore, we only need to clean the DepDel15 column of missing values.
With Clean Missing Data selected, click on Launch Column Selector in the Properties pane as shown in Figure 2-64.

In the Select Columns screen, click on No Columns under Begin With.
Change Column Indices to Column Names and enter DepDel15 in the input box. When you do, a list of columns will appear.
Click on DepDel15 to select that column. Your Select Columns screen should now look like the one shown in Figure 2-65.
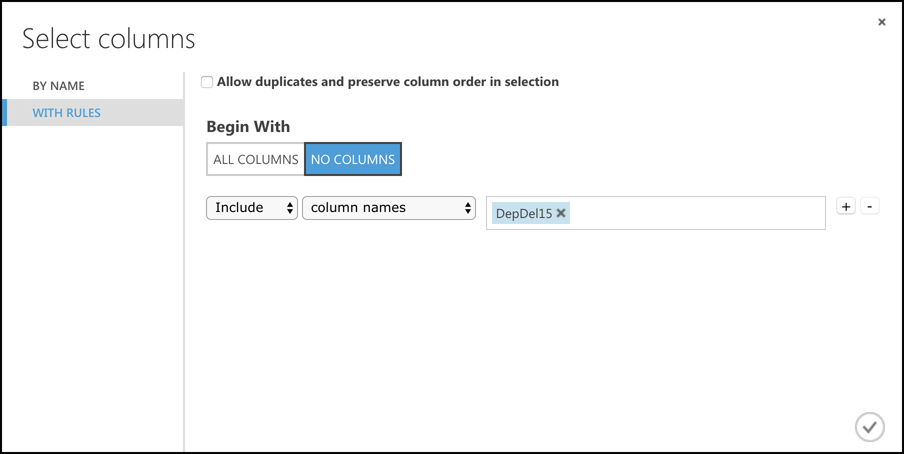
Once you’ve entered the DepDel15 column, click the check mark button in the lower right to save those settings.
We’re going to completely remove any rows that have missing values in the DepDel15 column.
Click on the Cleaning Mode dropdown (shown in Figure 2-64) and select Remove Entire Row. We can now perform our data transformation and check the results.
Click the Run button at the bottom of Machine Learning Studio. This will queue our transformation job and you’ll see a small clock appear on the Clean Missing Data node.
When the transformation process starts, you’ll see a green spinning circle. The transformation is going to clean almost 3 million rows, so it will take a minute or so. When it’s complete, a green check will appear.
We can now look at our cleaned dataset to check the results of our data cleaning.
Right-click on Clean Missing Data.
Point to Cleaned Dataset.
Click on Visualize, as shown in Figure 2-66.
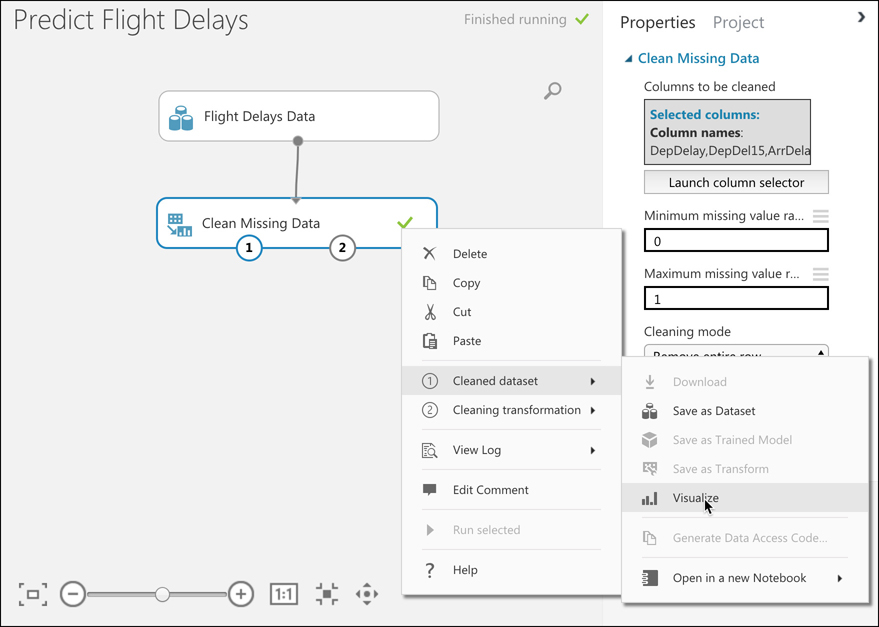
Use the same technique you used earlier when visualizing the dataset. You’ll notice that we have fewer records than we had before because our data transformation removed rows where data was missing. If you click on the DepDel15 column, you’ll see that it now has no missing values.
Now that we have clean data, we need to tell our model which columns in this data are of interest to our model. We want to create a model that will predict the likelihood that a particular flight will arrive late, so we only want columns in the dataset that are important for us to look at to predict that. Anything else is just noise that the model doesn’t need to consider.
To tell the model which columns to look at, we’ll use the Select Columns in Dataset item.
Click in the search box and enter Select.
Locate the Select Columns in Dataset transformation. Drag it from the list, and drop it directly under Clean Missing Data.
To connect the cleaned dataset to Select Columns in Dataset, click on Clean Missing Data and drag the “1” node to the top node of Select Columns in Dataset as shown in Figure 2-67.
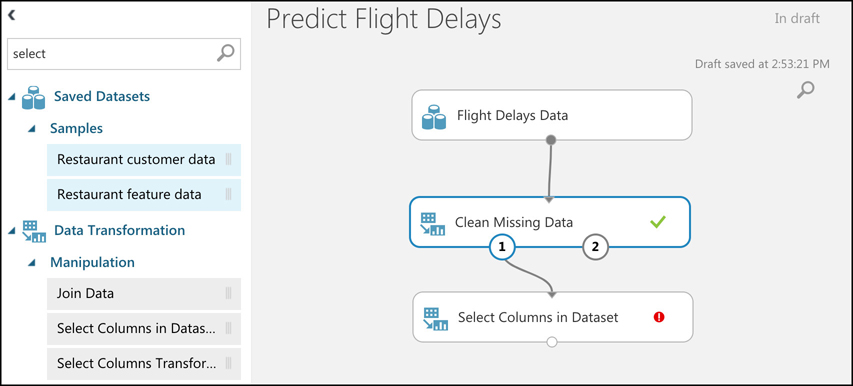
Notice that Select Columns in Dataset is displaying a red circle with an exclamation point. That tells us that we need to configure something for it to work. In this case, we need to tell it which columns we want to select.
Click on Select Columns in Dataset and click Launch Column Selector from the Properties pane.
Select Year from the list on the left and click the right arrow button to move it to the list of selected columns.
Do the same thing for all columns except DepDelay, ArrDelay, and Cancelled. You should see a screen like the one shown in Figure 2-68.
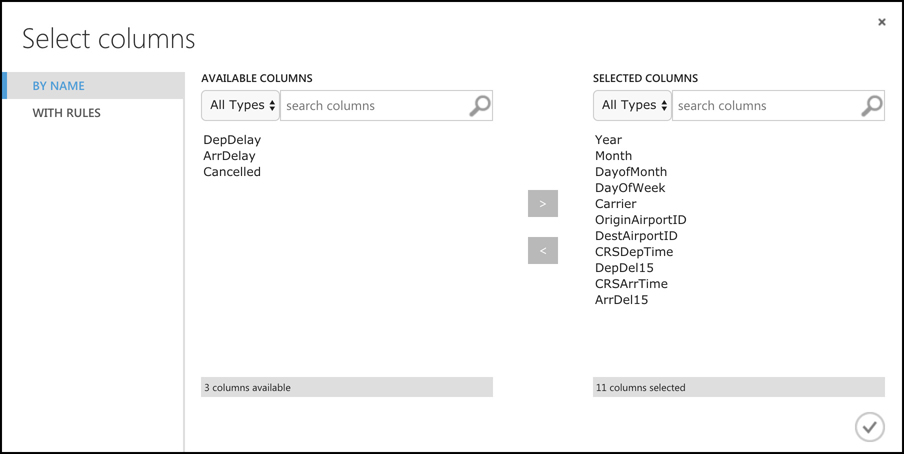
The columns that we selected are all columns that contain information that might impact the arrival time of any particular flight. We’re now ready to start training the ML model with the new dataset.
Note Spend Time With Your Data
We’ve spent a lot of time looking at the data and working to clean it. This step is extremely important when it comes to ML. You need to not only fully understand your data, but you also need to ensure your data is as clean as possible and that you’re only sending relevant data to your model.
One of the great things about Machine Learning Studio is that you can always go back and redo things easily if you make mistakes.
Step 3: Train the Model
When you train a machine language model, you don’t give it all of your data. Instead, you split your data and send a percentage of the data to the model for training. Once the model is trained, you use the remaining data to test your model. The process of testing a model is called scoring the model. By using data with known values to score the model, you can see how many times your trained model got the prediction right before you throw real data with unknown results at it.
Machine Learning Studio makes it easy to split your data for training.
Enter split in the search box and locate the Split Data item.
Drag it under the Select Columns from Dataset node.
Connect the Select Columns in Dataset output node (the circle on the bottom) to the top node of Split Data as shown in Figure 2-69.
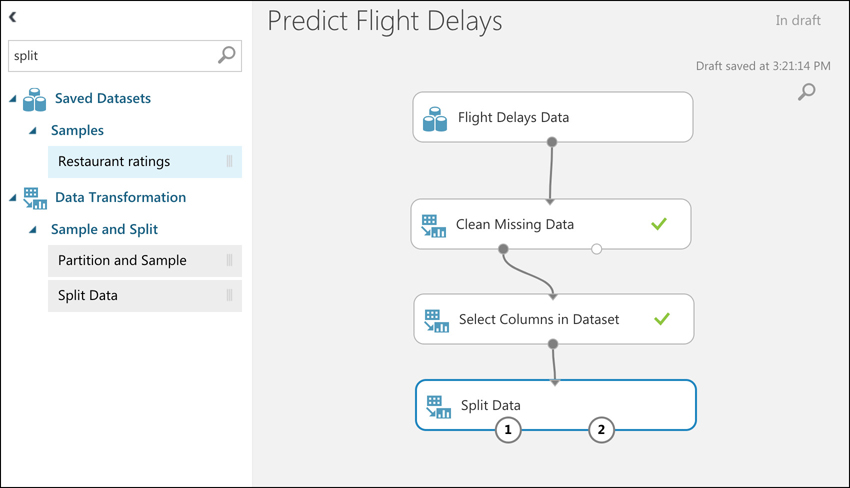
As a general rule of thumb, it’s a good idea to send about 80% of your data to your model for training and 20% of your data to score the trained model. To do that, click on Split Data and set the fraction of rows to include in the first output dataset to .8 as shown in Figure 2-70.
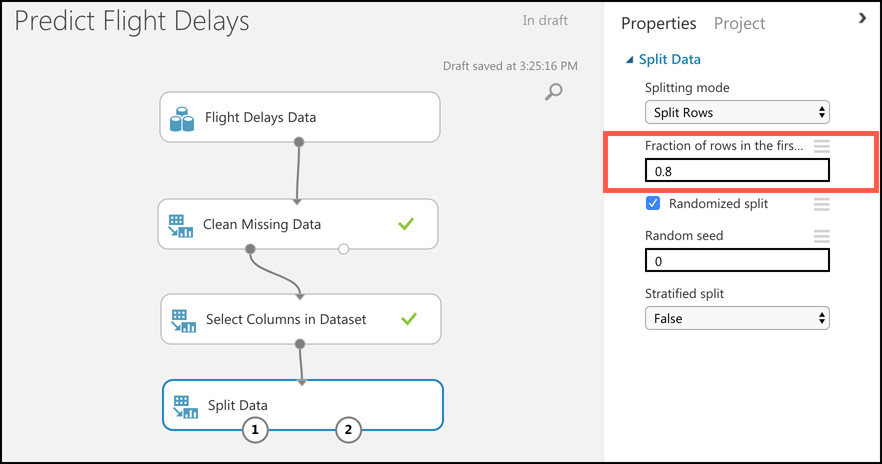
To train a model in Machine Learning Studio, use the Train Model item.
Click in the search box and enter train model.
Drag Train Model to your screen under Split Data.
To make room for our additional items, click on the button circled in Figure 2-71 to enable pan mode and move your items up.
Once you’ve moved them where you want them, click the pan mode button again to turn it off.
Connect the left node of Split Data to the top right node of the Train Model item as shown in Figure 2-71. This sends 80% of our dataset to the Train Model item.
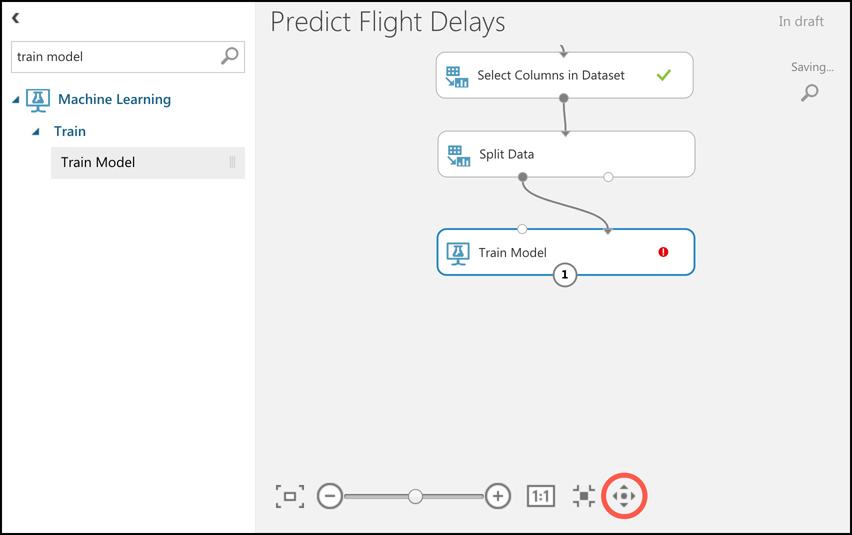
There are a couple of things we need to tell Train Model before we can start training. First of all, we need to tell it what we want our model to predict. We want this model to predict whether a particular flight will arrive at its destination on time, so we want it to predict the value of the ArrDel15 column. (Remember, this value will be 0 if the flight was within 15 minutes of scheduled arrival time and 1 if it’s not.)
Click on Train Model and click Launch Column Selector in the Properties pane.
Click on the ArrDel15 column to select it and then click the check button.
Next, we need to tell Train Model what kind of ML model we want it to use. If you were writing this ML model yourself, you’d have to write the model using a programming language like Python or R, but Machine Learning Studio contains a large number of ML models you can use without any programming.
More Info Ml Models
There are specific ML algorithms that are well-suited to particular situations. A great way to determine the best algorithm in Machine Learning Studio is to use the Machine Learning Cheat Sheet. You can find it at: https://aka.ms/mlcheatsheet.
The model is going to predict a Boolean value based on input data, and for this kind of model, the Two-Class Boosted Decision Tree algorithm is ideal.
Click in the search box and type two-class boosted.
Drag the Two-Class Boosted Decision Tree item to your screen and drop it to the left of Train Model.
Connect the node on Two-Class Boosted Decision Tree to the left node of Train Model as shown in Figure 2-72.
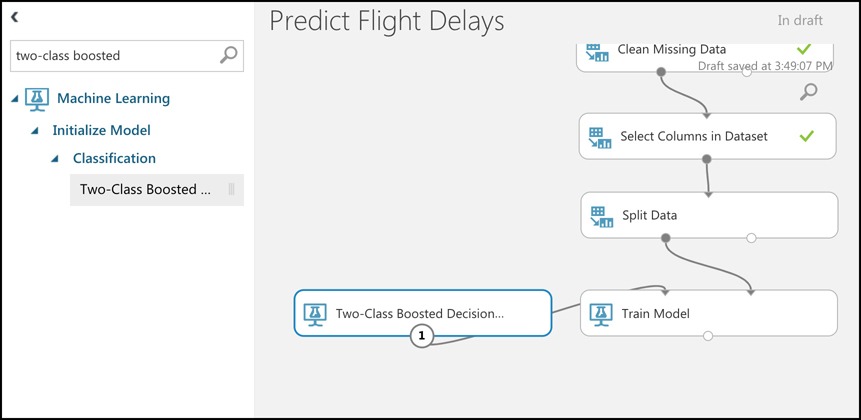
We now have everything in place to actually train the ML model, but we also want to score the model to see how accurate it is. Before we actually train it, let’s configure the workspace so that we can see how well the model did after training.
Step 4: Score the Model
In order to tell how successful this model is, we need to be able to score it with the remaining 20% of the data. We’ll use the Score Model item in Machine Learning Studio to do that.
Click in the search box and type score model.
Drag the Score Model item to your workspace and drop it under Train Model.
Connect the output node of Train Model to the top left node of Score Model. This sends the trained model to Score Model.
In order to send the remaining 20% of the data to Score Model for scoring, connect the right output node of Split Data to the top right node of Score Model as shown in Figure 2-73.
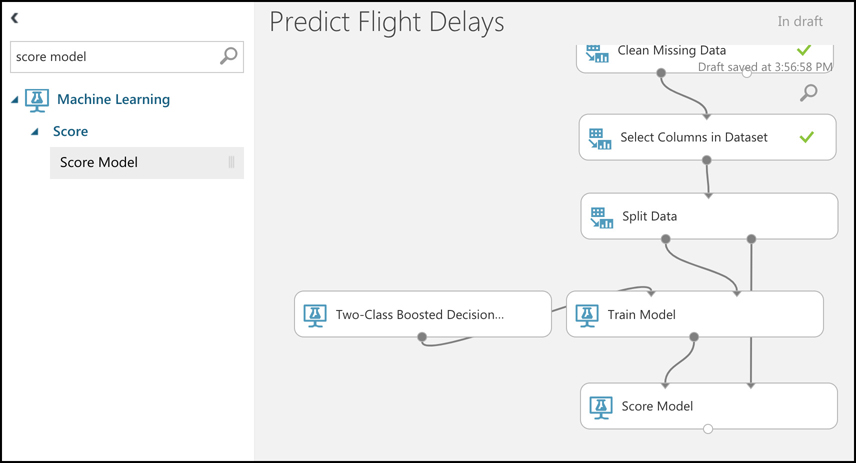
You have just completed all of the steps necessary to create an ML model, send millions of rows of data to it for training, and then test your trained model to see how well it succeeds. The only thing left is to run the training and scoring and see the result. We still need to add a way for us to evaluate that result.
Click in the search box and type evaluate.
Drag the Evaluate Model item so that it’s under Score Model.
Connect the bottom node of Score Model to the top left node of Evaluate Model as shown in Figure 2-74.
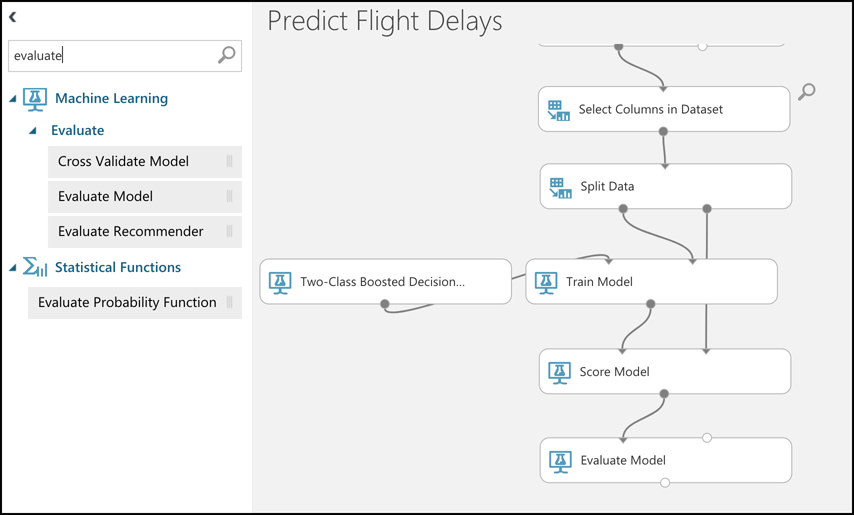
Figure 2-74 Evaluate a model with Evaluate Model
The Evaluate Model item will allow you to see an easily-readable report showing us the accuracy of the model.
Step 5: Train and Score the Model
To train the model and then score it with the remaining 20% of the data, click the Run button at the bottom of the workspace. It will take a while to run, so be patient.
When the model has been trained and scored, you’ll see a green check on each item in your workspace. To view the results of the experiment, right-click on Evaluate Model, point to Evaluation Results, and click on Visualize, as shown in Figure 2-75.

After clicking on Visualize, Machine Learning Studio will show you an ROC curve as shown in Figure 2-76. ROC stands for receiver operating characteristic, and it’s a typical graph for determining the effectiveness of an ML model. The further the line is to the left of the graph, the better the ML model. In this case, we see the model did well. Scroll down to see details on how well we did.
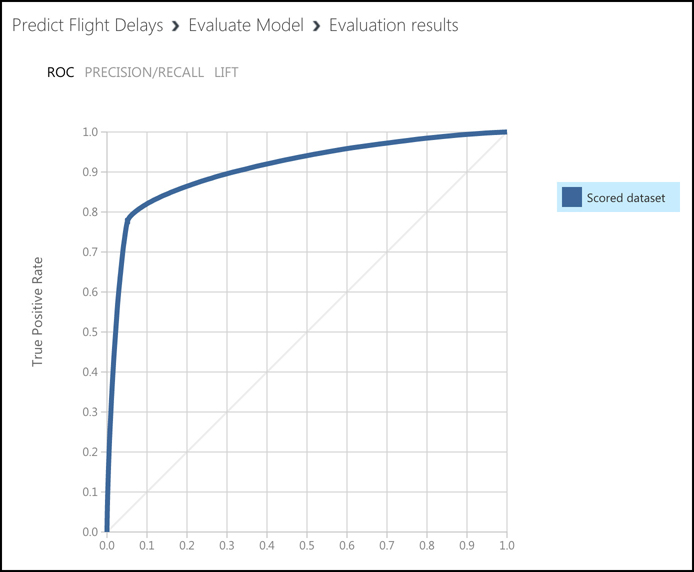
In Figure 2-77, you can see the full results of the experiment. You can see that we scored a 91.3% accuracy rate. We can improve this rate by feeding more data to the model, or possibly by using a different algorithm. Feel free to experiment on your own, and if you want to dig into a much more complicated version of this experiment, check out the Binary Classification: Flight Delay Prediction experiment template in Machine Learning Studio.
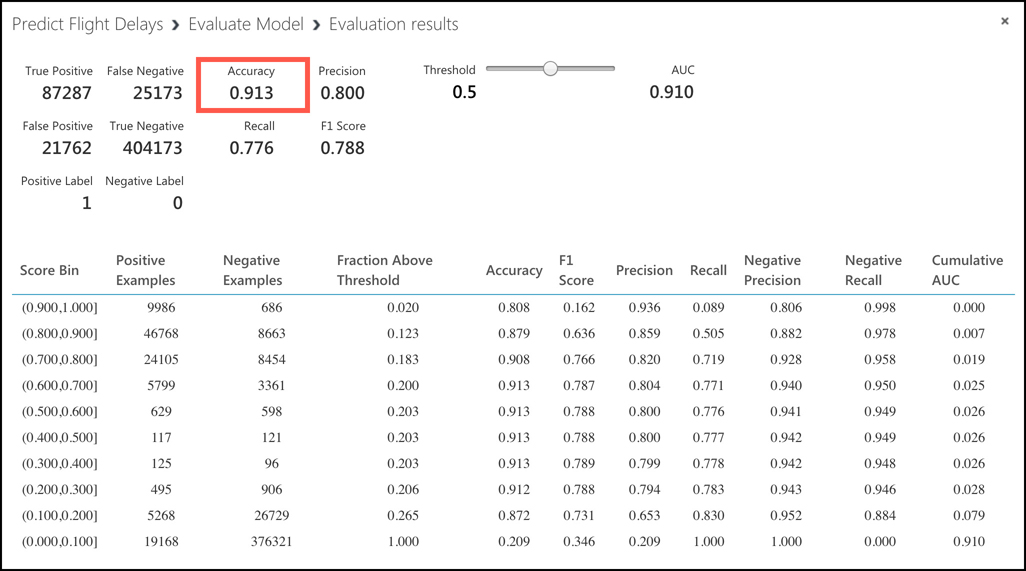
Once you’re satisfied with the result of the ML model, you can publish it to the Internet so that users can call it. Machine Learning Studio uses a Web service (which is a website) to do this, and you can easily deploy your ML model to a Web service by clicking the Set Up Web Service button at the bottom. When you do, Machine Learning Studio will add some nodes to a new tab called Predictive Experiment to your workspace, so you’ll need to click the Run button to test the new configuration before you can use the Web service.
After you click Run and your new predictive experiment complete successfully, click the Deploy To Web Service button to finish creating your Web service. Machine Learning Studio will display your Web service as shown in Figure 2-78, and you can even click on Test to test your new Web service.

Serverless computing
As you’ve already learned, one of the great advantages of moving to the cloud is that you can take advantage of the large amounts of infrastructure that cloud providers have invested in. You can create VMs in the cloud and pay for them only when they’re running. Sometimes you just need to “borrow” a computer in order to run a computation or perform a quick task. In those situations, a serverless environment is ideal. In a serverless situation, you pay only when your code is running on a VM. When your code’s not running, you don’t pay anything.
The concept of serverless computing came about because cloud providers had unused VMs in their data centers and they wanted to monetize them. All cloud providers need surplus capacity so they can meet the needs of customers, but when VMs are sitting there waiting for a customer who might want to use it, it’s lost revenue for the cloud provider. To solve that problem, cloud providers created consumption-based plans that allow you to run your code on these surplus VMs and you pay only for your use while your code is running.
![]() Exam Tip
Exam Tip
It’s important to understand that “serverless” doesn’t mean that no VMs are involved. It simply means that the VM that’s running your code isn’t explicitly allocated to you. Your code is moved to the VM, it’s executed, and then it’s moved off.
Because your serverless code is running on surplus capacity, cloud providers usually offer steep discounts on consumption-based plans. In fact, for small workloads, you may not pay anything at all.
Azure has many serverless services. We’ve already discussed that Azure Databricks and Azure Machine Learning Service are serverless. However, there are other serverless services that don’t fit into the categories we’ve already discussed. They are Azure Functions for serverless compute, Azure Logic Apps for serverless workflows, and Azure Event Grid for serverless event routing.
Azure Functions
Azure Functions is the compute component of Azure’s serverless offerings. That means that you can use Functions to write code without having to worry about deploying that code or creating VMs to run your code. Apps that use Azure Functions are often referred to as Function Apps.
More Info Function Apps Use App Service
Function Apps are serverless, but under the hood, they run on Azure App Service. In fact, you can choose to create your Function App in an App Service plan, in which case you don’t benefit from the consumption model of paying only when your code runs. We’ll cover that in more detail later in this chapter.
Functions can be created in many different ways. You can create a Function App using:
Microsoft Visual Studio
Microsoft Visual Studio Code
Maven for Java Function Apps
Python command line for Python Function Apps
Azure command line interface (CLI) on Windows or Linux
The Azure portal
Assuming you aren’t creating your Function App using a method specific for a particular language, you can choose between .NET (for C# and F# Function Apps), Java, and JavaScript (for Node Function Apps.) In Figure 2-79, we’re creating a Function App in the Azure portal, and selected .NET as the Function App runtime so that you can use the C# language to write functions.
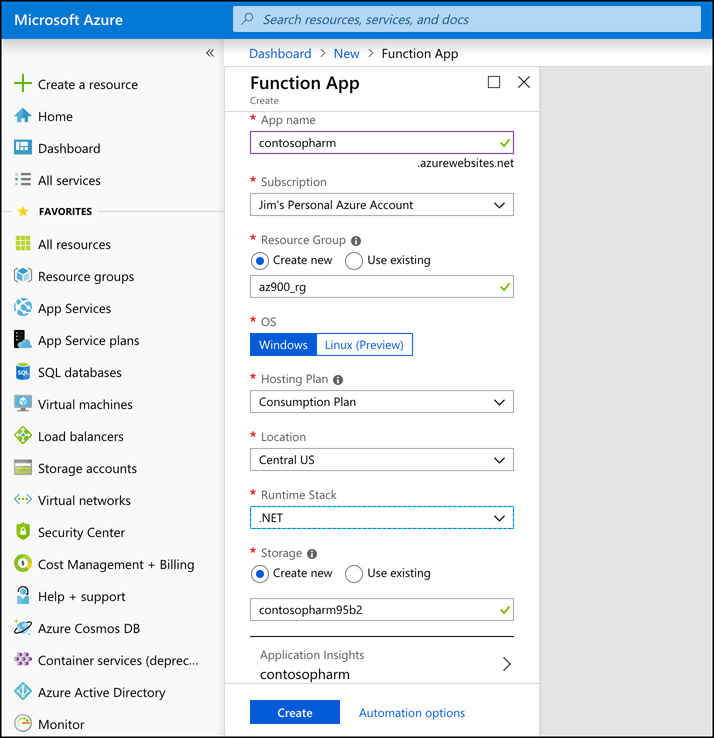
Once your Function App is ready, you can open it in the portal to begin creating functions. Figure 2-80 shows the new Function App in the Azure portal.

From here, you can create a new function, a new proxy, or a new slot. A function is code that runs when something triggers it. (We’ll look at triggers soon.) A proxy allows you to configure multiple endpoints for your Function App, but expose all of them via a single URL. Slots allow you to create a copy of your Function App that isn’t public-facing. You can write code and test this copy, and when you are satisfied that it’s ready for production, you can swap it over to production with the click of a button. This feature in App Service is called Deployment Slots.
If you click on Function App Settings under Configured Features (shown in Figure 2-80), we can change some settings for the Function App, as shown in Figure 2-81.

From this screen, you can configure a daily quota for your Function App. Once you reach the quota, Azure will stop the Function App until the next day. You can also change the Function App runtime version. This is the runtime version of Azure Functions, and while it’s generally advised to use the latest version, if your functions were written in an earlier version, you won’t be able to upgrade them by simply changing the version here. Changing major versions can cause your app to break, so Microsoft will prevent you from changing the version if you have existing functions in your Function App.
You can also change your Function App to read-only mode to prevent any changes to it. This is helpful if you have multiple developers writing code for your app and you don’t want someone changing something without your knowledge. Finally, you can view, renew, revoke, and add new host keys. A host key is used to control access to your functions. When you create a function, you can specify whether anyone can use it or whether a key is required.
![]() Exam Tip
Exam Tip
Although a key can help protect your functions, they’re not designed to offer complete security of Function Apps. If you want to protect your Function App from unauthorized use, you should use authentication features available in App Service to require authentication. You can also use Microsoft API Management to add security requirements to your Function App.
If you click on Application Settings (shown in Figure 2-80), you can configure the settings for the Function App. These are settings specific to App Service. Figure 2-82 shows some of these settings, including whether the app runs in 32-bit or 64-bit, the HTTP version, how you can access your files using FTP, and more. You can also configure database connection strings from this page.

Finally, if you click on the Platform Features tab, you can see all of the features available to you in the App Service platform, as shown in Figure 2-83. From here, you can configure things such as SSL certificates, custom domain names for your Function App, turn-key authentication, and more.
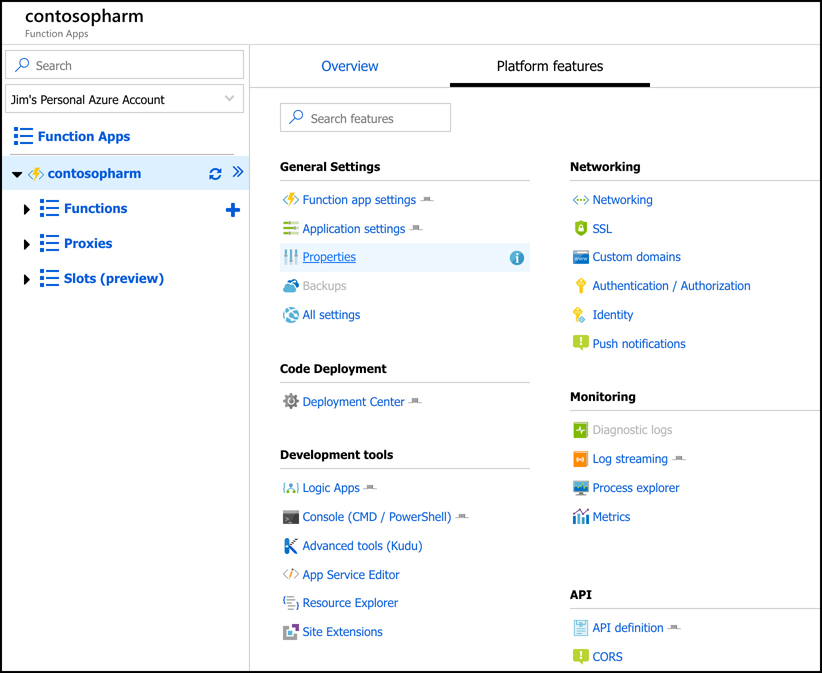
More Info Azure App Service
A full discussion of Azure App Service is outside of the scope of this book, but if you want to learn more, check out: https://azure.microsoft.com/services/app-service.
To create a new function, click on the + sign as shown in Figure 2-84. You can then choose your development environment. You can choose Visual Studio, Visual Studio Code, a development environment right inside the Azure portal, or you can use a code editor of your choice alongside the Azure Functions Core Tools.
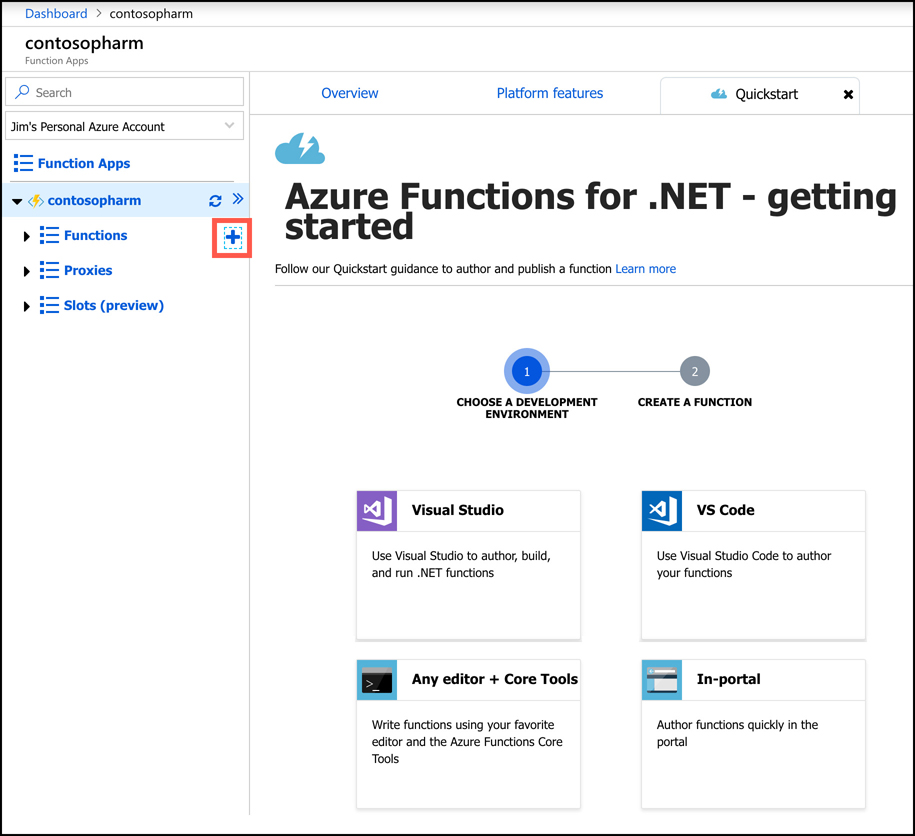
If you choose any option other than In-Portal, you’ll need to specify how you want to deploy your function to App Service. Your options depend on which development environment you choose, but typically it will involve either using features of your environment to send the function directly to App Service, or you’ll need to use App Service Deployment Center. Either way, deployment is quick and easy.
Depending on which development environment you choose, you will likely have to complete some prerequisite steps in order to develop your function. You’ll see a screen telling you exactly what to do so that everything will work correctly. In Figure 2-85, you can see what’s required to use VS Code to develop functions. In most cases, it will require you to install the Azure Functions Core Tools.
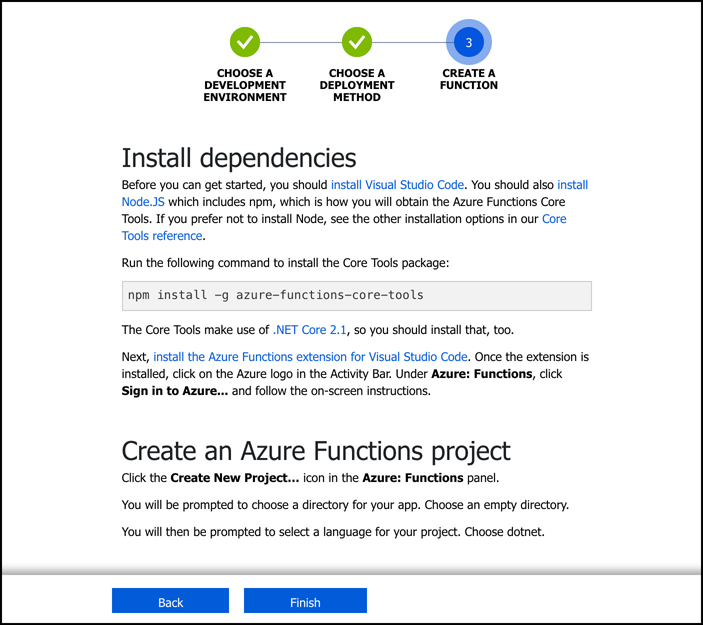
Functions work using a trigger-based system. When you create your function, you choose a trigger that will kick off your function. When it’s triggered, your function code will run. You will typically want your function code to do something simple. If you need a more complex function that performs many things, you can use Function Proxies to create several functions that work together to complete a task. This kind of development is referred to as microservices, and it allows you to quickly swap out functionality by simply changing a single function.
After your function is triggered and the code runs, you can choose what happens using what’s called an output binding. The type of bindings you can use are dependent on the type of function you create. Figure 2-86 shows some of the different output bindings available when using an HttpTrigger for a function. This function will run as soon as a particular URL is requested.

More Info Httptrigger Functions
HttpTrigger functions are incredibly powerful because they can be called as a webhook. Many online services support webhooks. In a webhook scenario, you can configure a service to make a request to a particular URL in response to events. If you configure that webhook to call your Azure function’s URL, you can easily add powerful functionality to your workflow.
You can configure multiple outputs for your function as well. For more complex workflows, however, Logic Apps is often a better choice, and you can integrate Logic Apps directly with Azure Functions.
Azure Logic Apps
Logic Apps are similar to Function Apps in that they are kicked off by a trigger, but what happens after that is completely different. Unlike Function Apps, you don’t have to write code to create some powerful workflows with Logic Apps.
A workflow simply means that a Logic App reacts to something happening and responds by performing a series of tasks such as sending an email, transferring data to a database, and so on. It can do these things in order, but it can also do two things at once. As an example, you might have an e-commerce site and when a customer orders a product you might want to:
Update your inventory count of the product
Generate an invoice for the item
Email the invoice to the customer
Sign the customer up for your newsletter
Generate a shipping label for the item
Logic Apps allows you to create these kinds of complex workflows easily, and because Logic Apps integrates with over a hundred other services (both Azure services and third-party services), you can do just about anything in a Logic Apps workflow.
There are three components in Logic Apps that make workflows possible: connectors, triggers, and actions. A connector is a component that connects your Logic App to something. That could be another Azure service, but it could also be a third-party service, an FTP server, and so forth. Each connector will have one or more triggers and actions specific to that connector. A trigger is a specific action that will cause your Logic App workflow to run, and an action is what your Logic App will do as an output. You can combine multiple actions for a connector, and you can also combine multiple connectors to create complex and powerful workflows.
You create Logic Apps in the Azure portal. Once you create it, the Logic Apps designer is shown by default. From the designer, you can choose the trigger for your Logic App as shown in Figure 2-87. The list shown is a brief list of common triggers, but there are many more to choose from. In fact, there’s a trigger for Azure Functions as well, so you can trigger a Logic Apps workflow when your function runs.
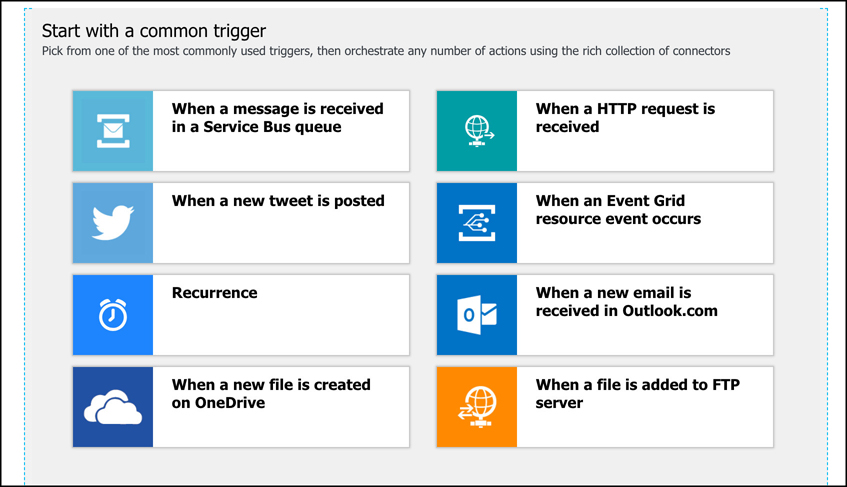
![]() Exam Tip
Exam Tip
It’s important to understand the difference between connectors and triggers. All of the items shown in Figure 2-87 are triggers that are associated with specific connectors. For example, When A New File Is Created On OneDrive is a trigger for the OneDrive connector. There are other OneDrive triggers available as well, including When A File Is Modified and When A File Is Deleted.
If you scroll down, you’ll see a large number of templates you can use to create a Logic App as shown in Figure 2-88. These templates will automatically configure a Logic App that contains a full workflow that you can modify for your own purposes. This is the fastest way to get started, but the included templates might not be exactly what you want, so you can also create a blank Logic App and start from scratch.

After you create your blank Logic App, you can choose from several ways to start building your workflow. You can select a trigger from the list, search for a trigger or connector, or you can just select a connector from the list and see what triggers are available. As shown in Figure 2-89, there are many options available to get started.
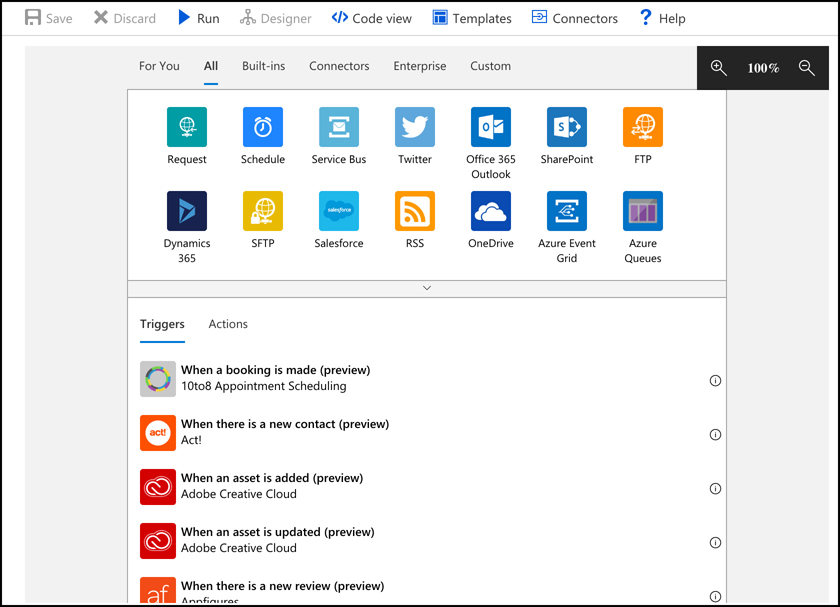
In Figure 2-90, we’ve configured the OneDrive connector to monitor a folder in OneDrive. When a file is modified in that folder, it will start the Logic App workflow. In order to do something when a file is modified, click on New Step to add an action.

When you click on New Step, you’ll see the same kind of screen that shows when the Logic App starts. Since we added a step to a workflow that already has a trigger, Logic Apps shows the actions you can take when the app is triggered. There are many actions to choose from, as shown in Figure 2-91.
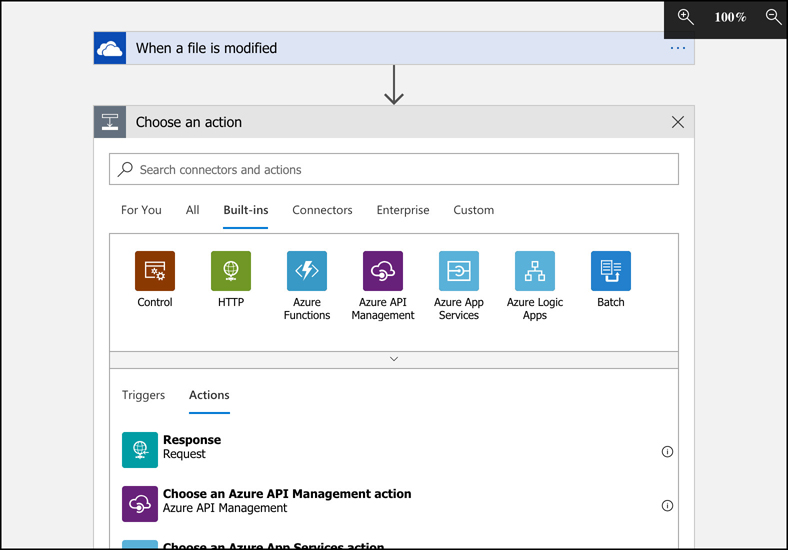
In Figure 2-92, we configured the Logic App to call the Function App when a file is modified in the OneDrive folder. You can pass the filename that was modified to the Function App so that it will know what has changed, which you can do using dynamic content. Just click on File Name from the list. Of course, you can only pass one dynamic content item in your action.
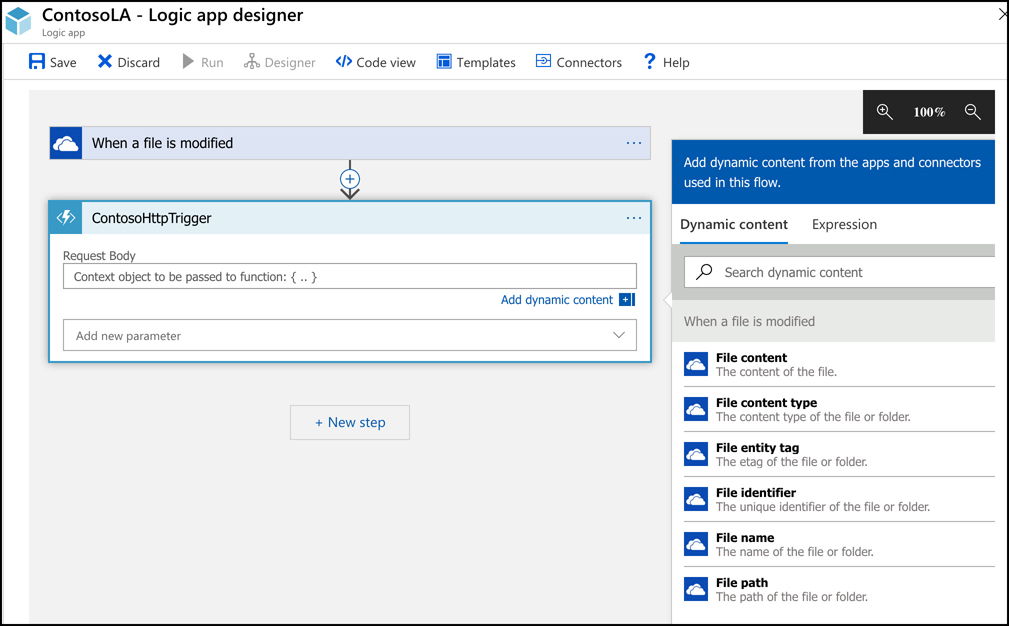
More Info Passing Parameters To Function Apps
When using a Logic App to call a Function App, make sure the Function App was designed to accept the data the Logic App is passing to it. Otherwise, the Function App will encounter an error when it’s triggered by the Logic App.
![]() Exam Tip
Exam Tip
As you’re configuring triggers and actions in the Logic Apps designer, Logic Apps is writing code for you under the hood that will implement your workflow. Logic App workflows are defined using JSON files, and the designer generates this JSON code as you are configuring your app.
You now have a functioning Logic App. You can test the workflow by clicking Save at the top of the designer. The OneDrive connector was configured to check for a modified file every three minutes (see Figure 2-90), so you may need to wait a few minutes before the workflow is triggered. You can also click on Run Trigger at the top of the designer to manually run the trigger.
You can monitor your Logic Apps using the Azure portal. Open the app and click on Overview to see when your trigger was activated, and whether or not it ran your workflow as shown in Figure 2-93.
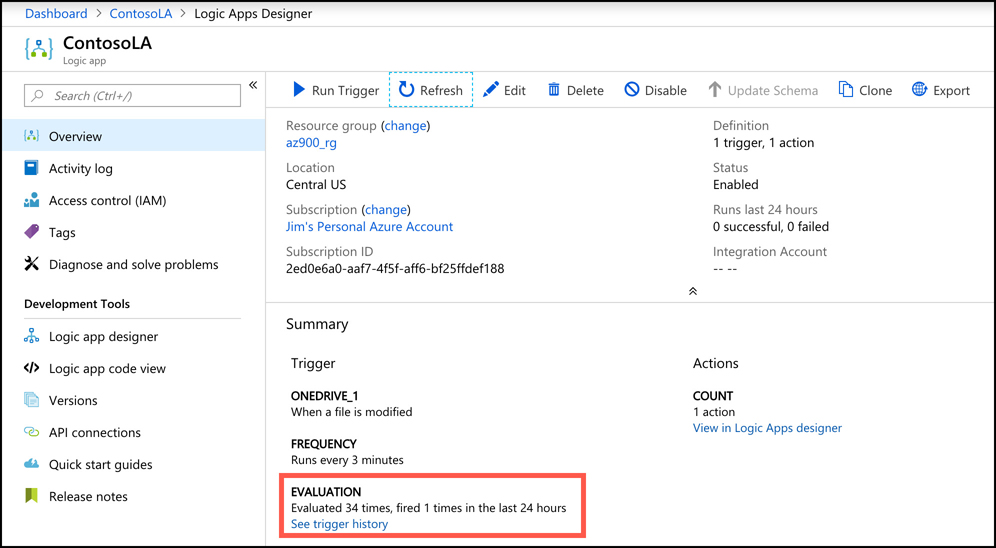
If you click on See Trigger History, you can see an entire history of when your trigger was evaluated and when it fired the workflow for your Logic App.
In this case, we’ve used a Logic App to call an Azure Function, but you could have written a log file to Azure Storage or stored some information in an Azure SQL Database. If you want your Logic App to integrate specifically with other Azure services such as this, you can integrate your Logic App with Azure Event Grid for a more optimal experience.
Azure Event Grid
The concept of different Azure services interacting with each other should be pretty familiar to you by now. There are many ways that you can integrate services such as this, and in some cases, you need one Azure resource to know about a change in another Azure resource. You could use a polling method for this, similar to the Logic App checking once against OneDrive every three minutes looking for a change. It’s more efficient, however, to enable an Azure service to trigger an event when something specific happens, and configure another Azure service to listen for that event so it can react to it. Event Grid provides that functionality.
Note Event Grid And Serverless Computing
Event Grid has many capabilities that aren’t related to serverless computing, but in the scope of this chapter, we only cover serverless capabilities and Event Grid.
Both Azure Functions and Azure Logic Apps are integrated with Event Grid. You can configure a function to run when an Event Grid event occurs. In Figure 2-94, you can see the list of Azure resources that you can trigger Event Grid events. Not all Azure services are represented in Event Grid, but more services are being added over time.
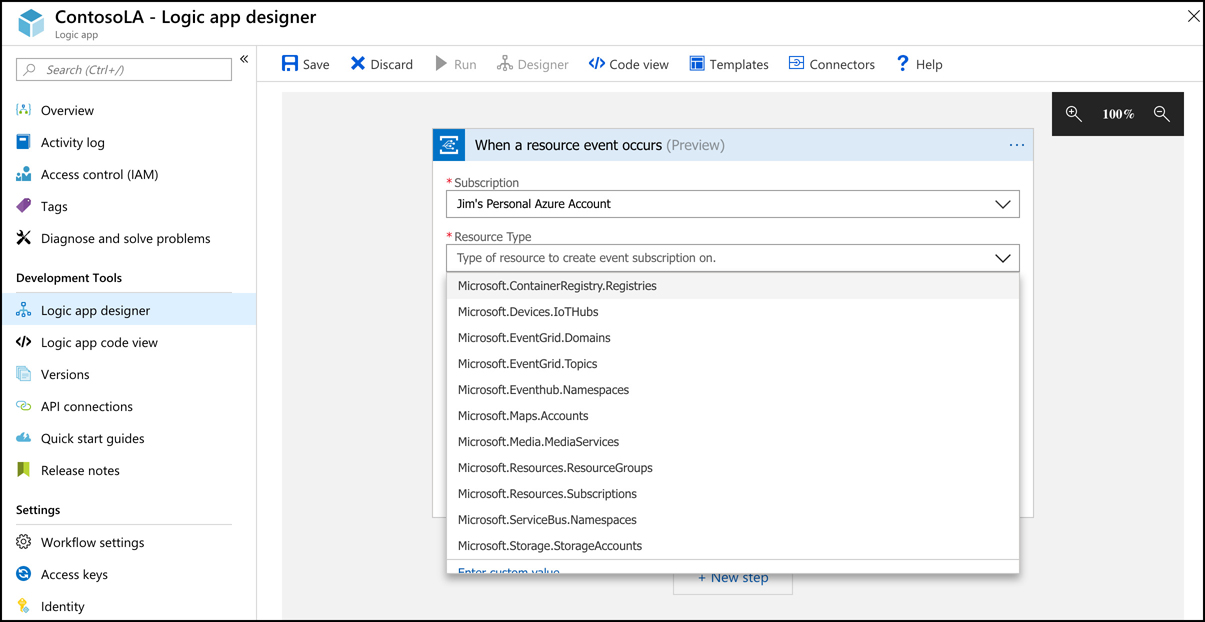
Once you’ve selected the resource type, configure the event you want to listen for. The events that are available may differ depending on the resource you selected. In Figure 2-95, we are creating an event for an Azure subscription.
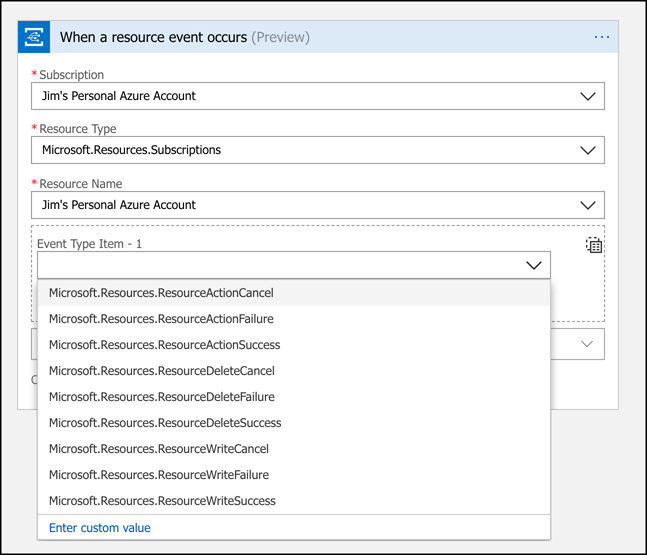
More Info Events
For full details on all events and what they mean, see: https://docs.microsoft.com/azure/event-grid/event-schema.
When an event occurs, you can take an action against an Azure resource using the Azure Resource Manager connector in a Logic App. You can also run a script that interacts with the Azure resource to do something like tag a resource, or configure it in a way that is specific to your organization.
The primary benefit of using Event Grid in this way is the rapid development of solutions. You also benefit from Event Grid reliably triggering your events. If an Event Grid event fails to trigger for any reason, Event Grid will continue to retry triggering the event for up to 24 hours. Event Grid is also extremely cost effective. The first 100,000 operations per month are free, and after that point, you pay 60 cents for every million operations.
Skill 2.4: Understand Azure management tools
You now have experience using Azure portal and Azure Resource Manager (ARM). Although using the Azure portal is a common way to interact with Azure services, it’s sometimes not the most efficient way, especially if you are doing a lot of things at the same time. For those more complex situations, Microsoft offers PowerShell cmdlets that you can use to interact with Azure resources, and they also offer the Command Line Interface (CLI) for cross-platform users.
More Info Rest API And Azure App
Microsoft also offers a REST API for interacting with Azure, but we won’t cover that in this book because it’s not covered in the AZ-900 exam.
The Azure portal
The Azure portal that is in use today is the third iteration of the Azure portal, and it came about when Microsoft moved to ARM. Everything that you do in the Azure portal calls ARM on the back-end.
![]() Exam Tip
Exam Tip
For the AZ-900 exam, you probably don’t need to know that the Azure portal is just making calls to ARM on the back end, but it doesn’t hurt to know it. For the rest of this section, however, we’ll cover only the different parts of the portal and how to navigate and customize it. That information is on the AZ-900 exam.
The first time you open the Azure portal, you’ll be prompted to take a tour of the portal. If you’re completely unfamiliar with the portal, taking a tour will help you to get a feel for how it works. If you choose not to, and change your mind later, you can click the question mark in the top toolbar to access the guided tour at any time.
The default view in the portal is Home, as shown in Figure 2-96. From here, you can see icons for various Azure services, and if you click on one of those icons, it will show you any resources of that type that you’ve created. The menu on the left side includes these same icons, and more.
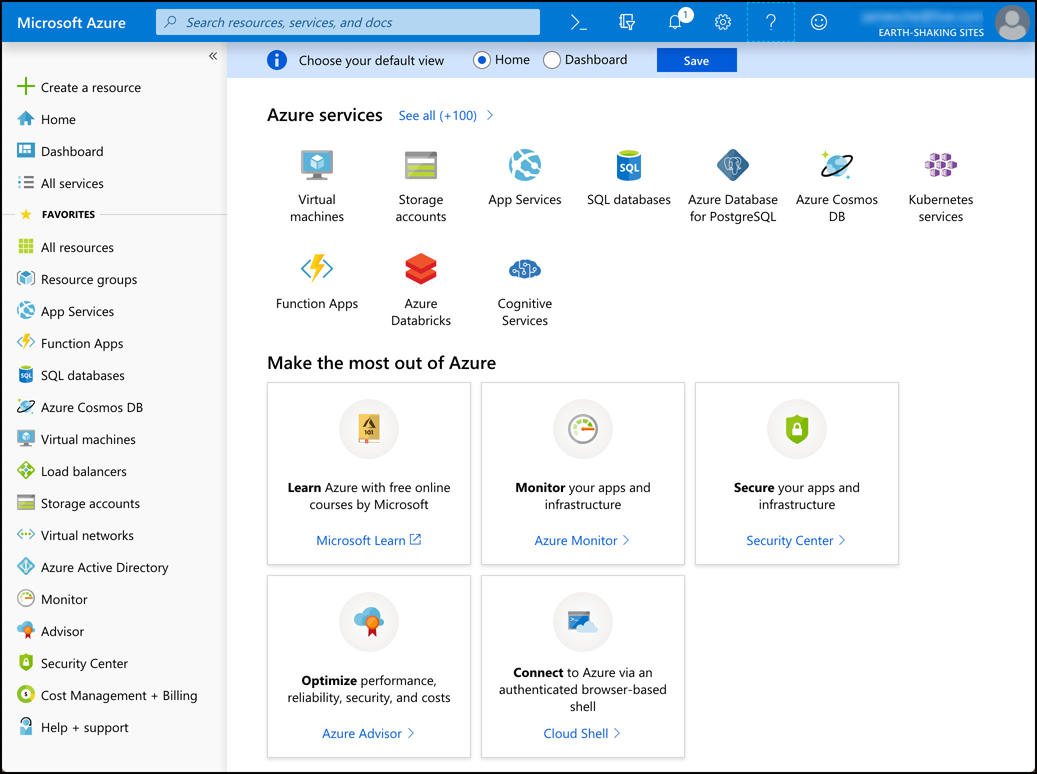
The bottom portion of the screen includes large tiles designed to help you learn more about Azure. If you click on one of the links provided in these tiles, a new tab will open in your browser so you don’t lose your place in the portal.
At the top of the screen, you can choose your default view for the portal. You can select between Home and Dashboard. The Dashboard is a fully-customizable screen that we’ll look at a little later. Once you’ve made your choice, click Save and the portal will always open in the screen of your choice. However, you can always access the Home screen or the Dashboard by clicking the relevant links in the menu on the left side of the Azure portal.
Along the top colored bar, you’ll find a search bar where you can search for Azure services, docs, or your Azure resources. To the right of the search box is a button that will launch Azure Cloud Shell. Cloud Shell is a web-based command shell where you can interact with Azure from the command-line. You can create Azure resources and more. As you’re reading through Azure documentation, you may see a Try It button, and those buttons use Cloud Shell to help you test out different services and features.
To the right of the Cloud Shell button is a filter button that allows you to configure the portal to only show resources in a certain Azure subscription or Azure Active Directory. To the right of that is the Notification button. This is where you’ll see notifications from Azure related to your services and subscription. In Figure 2-96, you can see the number 1 on the button. That indicates that you have one unread notification.
To the right of the notifications button is the Settings button. Clicking on that brings up a panel where you can alter portal settings as shown in Figure 9-97.
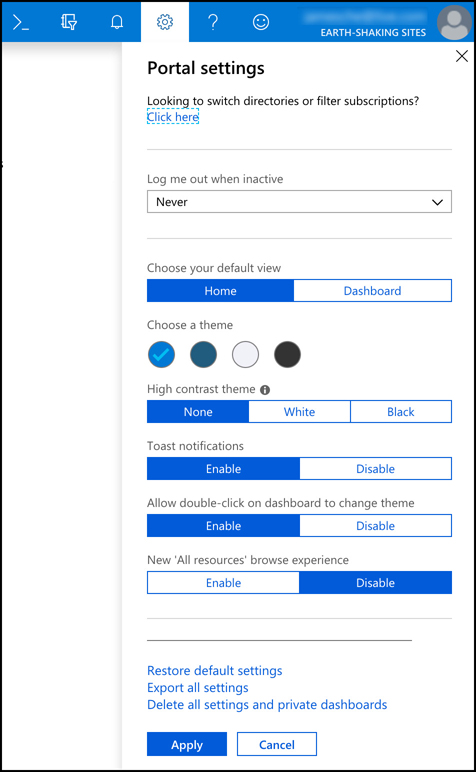
From Settings, you can change your default view, you can alter the color scheme of the portal, you can disable toast notifications, or pop up notifications that Microsoft may display from time to time. Other settings that appear here may change as Microsoft adds new features. For example, in Figure 2-97, you can see how if you chooe to you can change the portal to the new browse experience for your resources.
If you click on your name in the upper-right corner (shown in Figure 2-96), you can log out or switch to other Azure accounts. You can also change the Azure Active Directory to access resources in another directory. This is helpful if your company has a corporate directory and you also have a personal directory.
The menu along the left side of the portal contains a default list of Azure resources. Clicking on one of those will display all resources of that type. If you don’t find a service on that list that you’d like to add to the list, click All Services, locate the service you want to add to the list, and click on the star to the right of the service to mark it as a favorite, as shown in Figure 2-98.
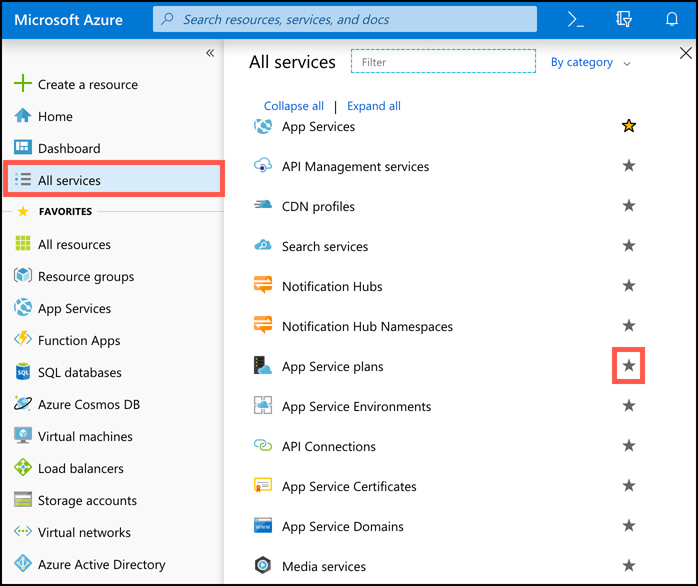
Note Moving Menu Items
You can reorder items on the menu. Click and hold on an item and drag it to a new location in the menu.
In Figure 2-99, we clicked App Service Plans on the menu to see all of the App Service plans. From this list, you can click on a resource to see that resource. You can also click on a column header to sort by that column, assuming you have more than one resource of that type. Click on Edit Columns to edit the columns that are displayed here. To create a new resource of this type, click on Add. Finally, you can click the three dots on the far right side of the resource to delete the resource.
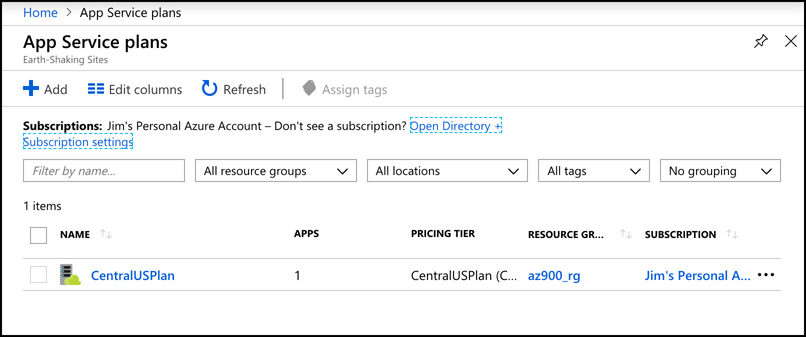
When you click on a particular resource, it will open that resource in the portal. Along the left side will be a menu that’s specific to the type of resource you opened. In the main window, you’ll see different items based on the type of resource you’re viewing. These window areas in the portal are often referred to as blades.
In Figure 2-100, you’ll see an App Service Web App in the portal. The Overview blade is a blade that’s common to most Azure resources, but the information that appears there will differ based upon the resource. In a Web App, you can see the resource group it’s in, the status, the region, and more. We also have various tiles related to Web Apps such as the Http 5xx tile and Data In tile. In the upper right of these tiles is a pin button. If you click on that pin, it will add that tile to the portal dashboard.
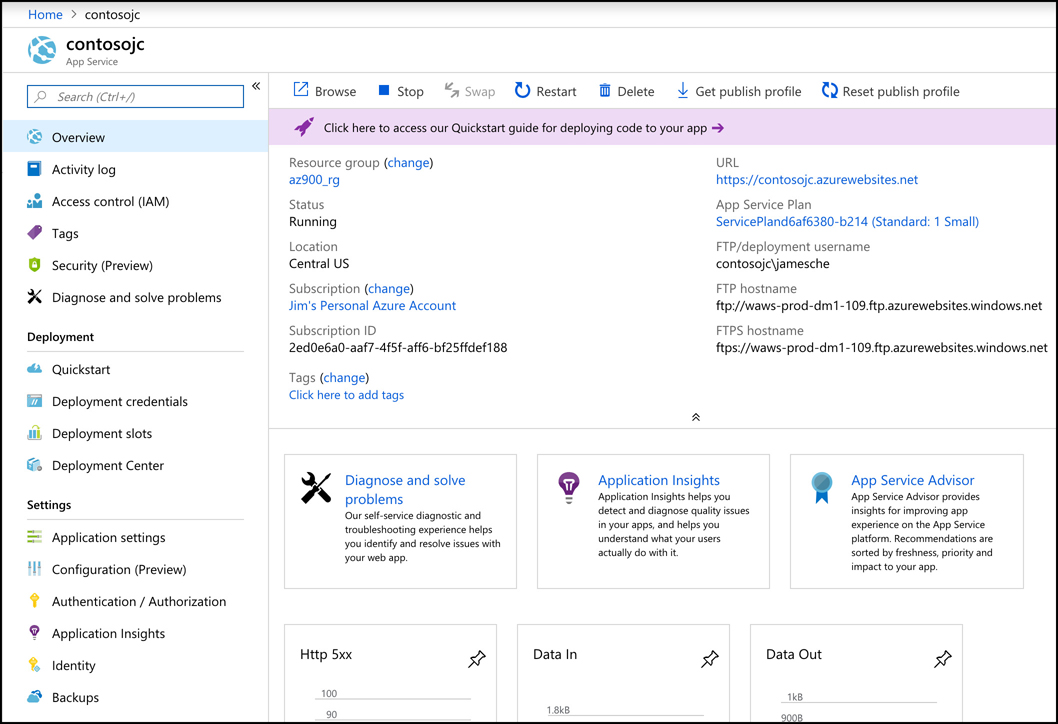
Along the top of the blade for the Web App are several buttons for interacting with the resource. For a Web App, you have a Browse button that will open the app in a browser, a Stop button to stop the Web App, a Swap button to swap deployment slots, and so on. Each resource type will have different buttons available to you so you can easily interact with the resource from the Overview blade.
If you click on an item in the menu at the left, the content from the Overview blade is replaced with the selected new item. In Figure 2-101, we have clicked on Diagnose And Solve Problems, which replaces the Overview blade with new content from the Diagnose And Solve Problems blade.
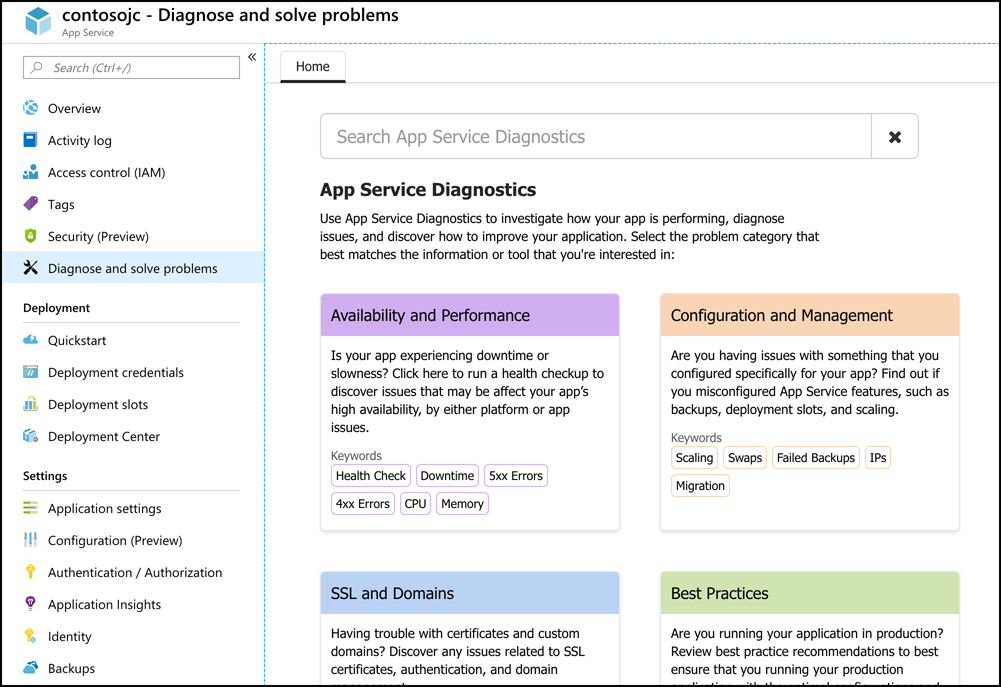
As you use the portal, you’ll find that there is inconsistency between different services. Each team at Microsoft has their own portal development sub-team, and they tend to design portal interfaces that make sense for their own team. For that reason, you may see buttons on the top in some blades and buttons on the bottom in other blades.
You can customize your portal experience using the dashboard. If you click on Dashboard from the portal home screen, you’ll see your default dashboard. As you’re managing your resources, click on pins (as shown in Figure 2-100) to pin tiles to your dashboard. You can then move these tiles around and customize them in other ways to create a view that’s unique to your needs.
To customize your dashboard, click Dashboard in the menu to show the dashboard and then click on Edit as shown in Figure 2-102.
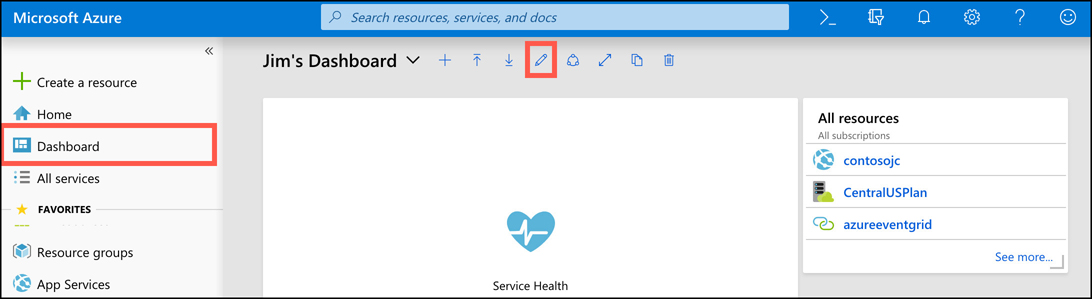
From the customize screen shown in Figure 2-103, you can change the name of your dashboard by clicking inside the current name and changing it to a new name. You can add tiles to the dashboard by choosing from one of the hundreds of tiles available in the Tile Gallery on the left side of the portal, and you can search and filter the list if necessary. If you hover over an existing tile, you’ll see a Delete button and a menu button represented by three dots. Click on the Delete button to remove the tile from the dashboard. Click the menu button to access a context menu where you can resizethe tile.
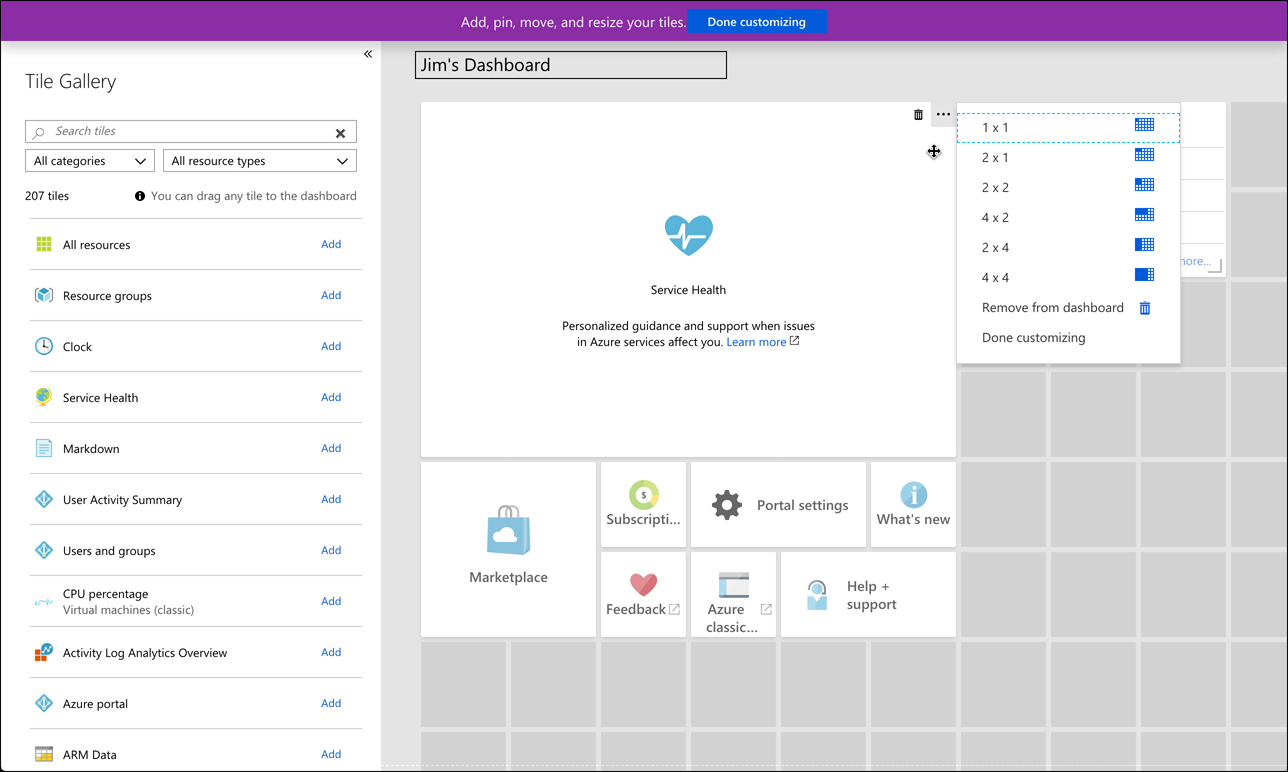
When you’re satisfied with your dashboard, click on Done Customizing to close the customization screen.
You can create new dashboards for specific purposes by clicking the plus sign (shown in Figure 2-102) next to your dashboard name. This takes you into a customization screen for your new dashboard just like the one shown in Figure 2-103.
In Figure 2-104, we’ve created a dashboard specific to Web Apps. You can easily switch between this dashboard and the default dashboard by clicking the down arrow next to the dashboard name.
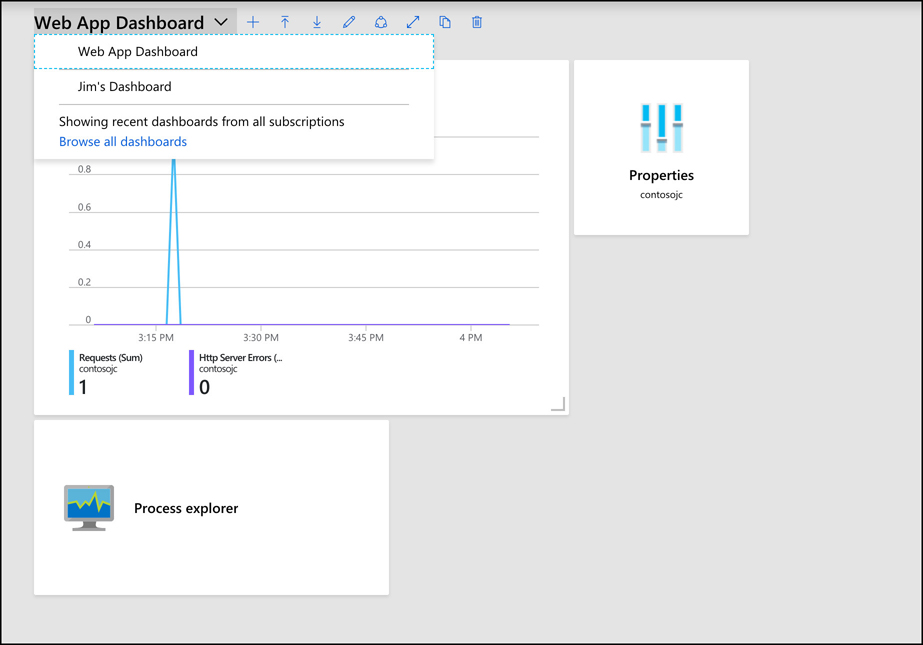
Azure and PowerShell
If you’re a PowerShell user, you can take advantage of that knowledge to manage your Azure resources using the Azure PowerShell Az module. This module offers cross-platform support, so whether you’re using Windows, Linux, or macOS, you can use the PowerShell Az module.
More Info Azurerm And Az
The PowerShell Az module is relatively new. Prior to it, all PowerShell commands used the AzureRm module. The commands that you use with both are identical. The only difference is the module name.
More Info INSTALL POWERSHELL ON LINUX OR MACOS
If you’re running Linux, you can find details on installing PowerShell at https://docs.microsoft.com/powershell/scripting/install/installing-powershell-core-on-linux?view=powershell-6. MacOS users can find steps at https://docs.microsoft.com/powershell/scripting/install/installing-powershell-core-on-macos?view=powershell-6.
![]() Exam Tip
Exam Tip
The PowerShell Az module uses the .NET Standard library for functionality, which means it will run with PowerShell version 5.x or 6.x. PowerShell 6.x is cross-platform and can run on Windows, Linux, or macOS.
If you’re running Windows 7 or later and you have PowerShell 5.x, you’ll also need to install .NET Framework 4.7.2.
Before you can use the PowerShell Az module, you’ll need to install it. To do that, you first need to run PowerShell elevated. In Windows, that means running it as an Administrator. In Linux and macOS, you’ll need to run it with superuser privileges using sudo.
To install the module, run the following command.
Install-Module -Name Az -AllowClobber
When you install a new PowerShell module, PowerShell checks all existing modules to see if they have any command names that are the same as a command name in the module you’re installing. If they do, the installation of the new module fails. By specifying -AllowClobber, you are telling PowerShell that it’s okay for the Az module to take precedence for any commands that also exist in another module.
If you are unable to run PowerShell elevated, you can install the module for your user ID only by using the following command.
Install-Module -Name Az -AllowClobber -Scope CurrentUser
Once you’ve installed the module, you need to sign in with your Azure account. To do that, run the following command.
Connect-AzAccount
This command will display a token in the PowerShell window. You’ll need to browse to https://microsoft.com/devicelogin and enter the code in order to authenticate your PowerShell session. If you close PowerShell, you’ll have to run the command again in your next session.
More Info Persisting Credentials
It is possible to configure PowerShell to persist your credentials. For more information on doing that, see: https://docs.microsoft.com/powershell/azure/context-persistence.
If you have more than one Azure subscription, you’ll want to set the active subscription so that commands you enter will impact the desired subscription. You can do that using the following command.
Set-AzContext -Subscription "subscription"
Replace subscription with the name or subscription ID of your Azure subscription you want to use with the Az module.
All Az module commands will have a common syntax that starts with a verb and an object. Verbs are things like New, Get, Move, or Remove. The object is the thing that you want the verb to impact. For example, the following command will create a resource group called MyRG in the South Central US region.
New-AzResourceGroup -Name MyRG -Location "South Central US"
If this succeeds, you’ll see a message letting you know that. If it fails, you’ll see an error. To remove the resource group, run the following command.
Remove-AzResourceGroup -Name MyRG
When this command is entered, you’ll be asked to confirm whether you want to delete the resource group. Type a y and the resource group will be removed as shown in Figure 2-105.
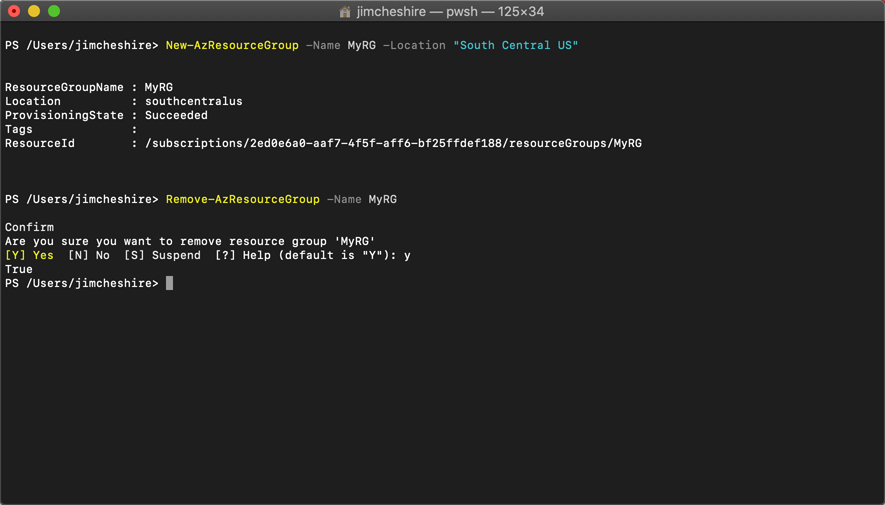
In many situations, you will be including PowerShell commands in a script so that you can perform a number of operations at once. In that case, you won’t be able to confirm a command by typing y, so you can use the -Force parameter to bypass the prompt. For example, you can delete the resource group using the following command and you won’t be prompted.
Remove-AzResourceGroup -Name MyRG -Force
You can find all of the commands available with the PowerShell Az module by browsing to: https://docs.microsoft.com/powershell/module/?view=azps-1.3.0.
Azure CLI
As I pointed out earlier, one of the main benefits of PowerShell is the ability to script interactions with Azure resources. If you want to script with PowerShell, however, you’ll need someone who knows PowerShell development. If you don’t have anyone who can do that, the Azure command-line interface (Azure CLI) is a great choice. Azure CLI can be scripted using shell scripts in various languages like Python, Ruby, and so on.
Like the PowerShell Az module, the Azure CLI is cross-platform and works on Windows, Linux, and macOS as long as you use the 2.0 version. Installation steps are different depending on your platform. You can find steps for all operating systems at: https://docs.microsoft.com/cli/azure/install-azure-cli?view=azure-cli-latest.
Once you install the Azure CLI, you’ll need to login to your Azure account. To do that, run the following command.
az login
When you run this command, the CLI will open a browser automatically for you to login. Once you login, if you have multiple Azure subscriptions, you can set the default one by entering the following command.
az account set --subscription "subscription"
Replace subscription with the name or subscription ID you want to use.
To find a list of commands you can run with the CLI, type az and press Enter. You’ll see a list of all the commands you can run. You can find detailed help on any command by entering the command and adding a --help parameter. Figure 2-106 shows the help for az resource.
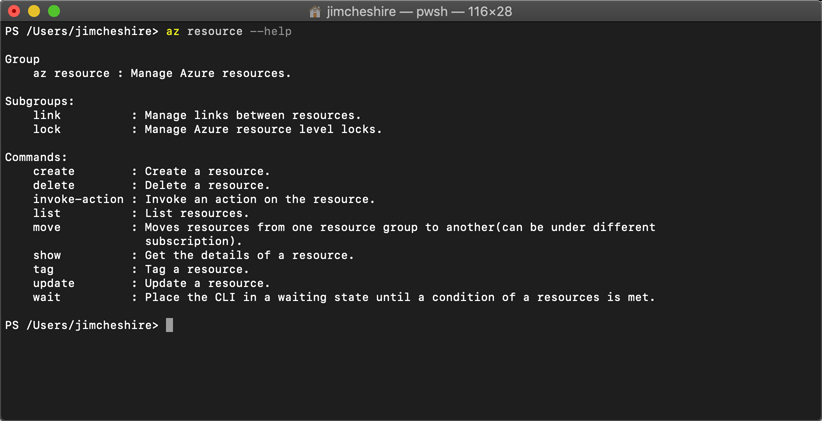
You can take this a step further if you aren’t sure what the commands do. You can, for example, run the following command to get help on the syntax for az resource create.
az resource create --help
This provides you with help and example commands to understand the syntax.
![]() Exam Tip
Exam Tip
Like PowerShell, most commands in the Azure CLI have a --force parameter that you can include so that no prompts are displayed. When scripting PowerShell or the CLI, you need to include this parameter or your script won’t work. Watch out for examples in the AZ-900 exam that test for this kind of knowledge.
An even easier way to learn the CLI is to switch into interactive mode. This provides you with auto-complete, the scoping of commands, and more. To switch into interactive mode enter az interactive at the command prompt. The CLI will install an extension to add this functionality. Figure 2-107 shows the Azure CLI with interactive mode active. You’ve typed we at the command prompt, and it’s displaying the rest of the command in dimmed text. You can press the right arrow key to enter the dimmed text in one keystroke.
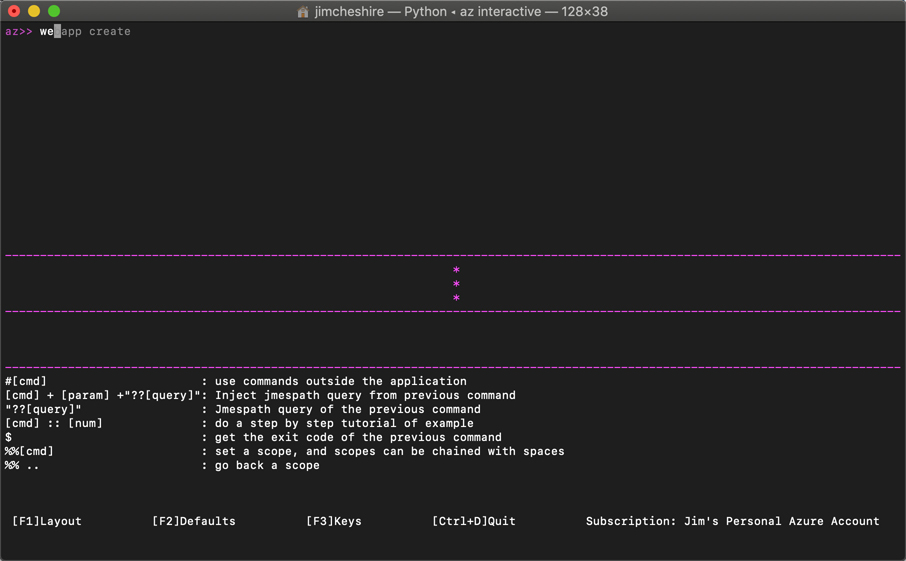
You can install additional extensions for added functionality. Because the CLI uses an extension architecture, Azure teams are able to provide support for new functionality without having to wait for a new CLI release. You can find a list of all available extensions that Microsoft provides by running the following command.
az extension list-available --output table
This will not only show you available extensions, but it will show you if you already have the extension installed and if there’s an update you should install. To install an extension, run the following command.
az extension add --name extension_name
Replace extension_name with the name of the extension you want to install.
Azure Advisor
Managing your Azure resources doesn’t just include creating and deleting resources. It also means ensuring that your resources are configured correctly for high-availability and efficiency. Figuring out exactly how to do that can be a daunting task. Entire books have been written on best-practices for cloud deployments. Fortunately, Azure can notify you about problems in your configuration so that you can avoid problems. It does this via the Azure Advisor.
Azure Advisor can offer advice in the area of high availability, security, performance, and cost. While the documentation states that Azure Advisor is available only for Azure VMs, availability sets, application gateways, App Service applications, SQL Server, and Azure Redis Cache, many more services are onboarded to Azure Advisor and you will get recommendations for just about all of your Azure services.
To access Azure Advisor, log into the Azure portal and click Advisor in the menu on the left. Figure 2-108 shows Azure Advisor with 1 low-impact recommendation for high availability and 2 high impact recommendations for security.
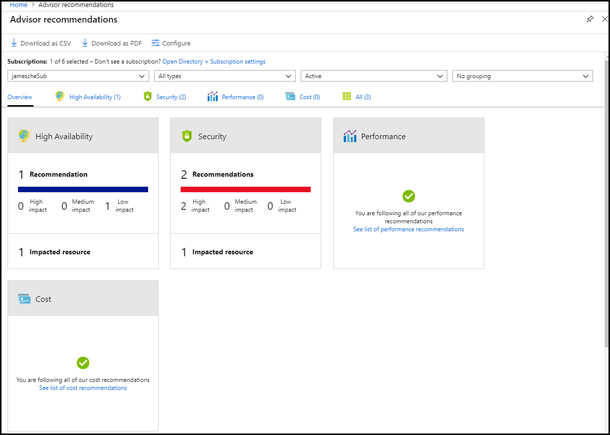
To review details on a recommendation, click the tile. In Figure 2-109, we have clicked the high availability tile and you can see a recommendation to create an Azure service health alert.
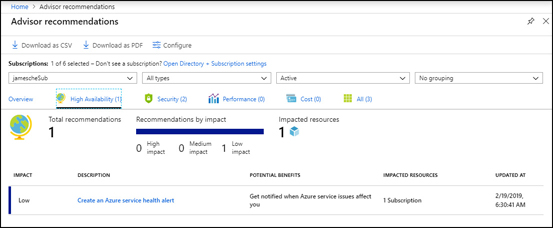
You don’t have to do what Azure Advisor recommends. If you click on the description, you can decide to postpone or dismiss the alert as shown in Figure 2-110. If you choose to postpone the alert, you have the option of being reminded in 1 day, 1 week, 1 month, or 3 months.
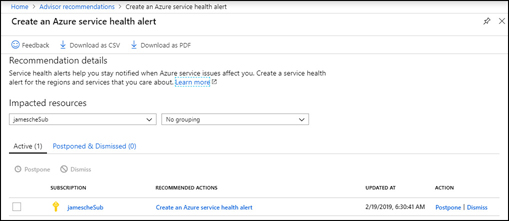
If you have a large number of recommendations, or if you’re not the right person to take action on the recommendations, you can download Azure Advisor recommendations as either a comma-separated values file or a PDF. Click Download As CSV or Download As PDF, as shown in Figure 2-108. You can also download a file with specific recommendations by clicking the appropriate download button while reviewing details as shown in both Figure 2-109 and Figure 2-110.
Thought experiment
Now that you’ve learned about core Azure services, let’s apply that knowledge. You can find the answers to this thought experiment in the section that follows.
ContosoPharm has contacted you for assistance in setting up some Azure virtual machines for hosting their Azure services. They want to ensure that their services experience high-availability and are protected against disasters that might occur in a datacenter at a particular Azure region. In addition to that, they want to ensure that a power outage at a particular datacenter doesn’t impact their service in that region. They also want to be certain that their application doesn’t go down in case a VM has to be rebooted for any reason.
ContosoPharm’s VMs will also be using specific configurations for virtual networks, and they want to ensure that they can easily deploy these resources into new Azure regions, if necessary, at a later time. It’s critical to them that the later deployments have the exact same configuration as all other deployments because any differences can cause application incompatibilities.
Some of the VMs they are deploying are under the cost center for research and development. Other VMs are going to be used for marketing to track pharmaceutical orders. For cost reporting, it’s important that they be able to report on Azure expenses for each cost center separately.
During some periods of time, ContosoPharm has noticed that their applications can cause extreme CPU spikes. They’d like a system that will account for that and possibly add additional VMs during these peak times, but they want to control costs and don’t want to pay for these additional VMs when they aren’t experiencing a usage spike. Any advice you can offer for that would be a bonus.
The marketing application uses a website for orders, and keeping accurate inventory in real-time is critical. ContosoPharm has sales people all over the globe, and they want to implement a system where a user who accesses the site in one particular geographic region is directed to a website running in an Azure datacenter close to them.
In addition to that, they want to ensure that they keep a copy of each order invoice. These invoices are uploaded to the website as a PDF, and they want to keep them in the cloud. They don’t need to be able to run any kind of reporting on these invoices, but they do need them in case regulators ask for them at some point in the future.
All of ContosoPharm’s chemicals and pharmaceuticals are kept in a large research facility. They’d like to integrate a database in that facility with their Azure services, and they need that connection to be encrypted and secure. They also need to be able to carefully track the temperature of that facility where the on-premises database is stored. They’ve added Internet-enabled thermostat devices in the building, but they currently have no way to ensure that they can be notified is something is out of the ordinary with the temperature.
Because of the sensitivity of on-premises inventory, they’d like to store all of the telemetry from all of the devices that monitor temperature. They currently have over 500,000 sensors that record the temperature every two seconds. The CTO of the company has told you that he believes they should be able to take all of those historical readings and set up some kind of system that will be able to predict when an anomaly is happening before it becomes a problem and puts their assets at risk. He’d like a recommendation on how we can implement that.
The last requirement that they have is the ability to easily tell if there are any opportunities for them to reduce cost based on their Azure resource usage over time. They have invested a large amount of money in the planning of this system, and they want to ensure that additional expenses are controlled wherever possible.
Provide a recommendation to ContosoPharm that meets all their requirements. You don’t need to give them specific technical details on how to implement everything, but you should point them in the right direction if you don’t have specifics.
Thought experiment answers
In this section, we’ll go over the answers to the thought experiment.
To ensure that their VMs are protected against disasters at a datacenter within a particular Azure region, you should recommend that ContosoPharm use availability zones. By deploying VMs in availability zones, they can ensure that VMs are distributed into different physical buildings within the same Azure region. Each building will have separate power, water, cooling system, and network.
To protect their application when a VM has to be rebooted, they should use an availability set. An availability set would provide them with multiple fault domains and update domains so that if a VM has to be rebooted, they’d still have an operational VM in another update domain.
In order to ensure consistent deployments now and in the future, ContosoPharm can create an ARM template for their deployment. By using an ARM template, they can ensure that every deployment of their resources will be identical.
To separate invoice tracking for the R&D department and marketing department, Contoso Pharm can use resource tags for each of their resources. Their Azure invoice can be filtered on these tags so they can track expenses.
To ensure that they always have enough VMs to handle load when CPU spikes, they should use scale sets. They can then configure auto-scale rules to scale out when load requires it and scale back in to control costs.
To ensure that sales people using the marketing website are directed to a datacenter that’s geographically close to them, ContosoPharm should use Azure Traffic Manager with Geographic rules. This will ensure that the traffic goes to a datacenter closest to the DNS server that made the request.
To store their invoices in the cloud, ContosoPharm can use Azure Blob Storage. They could store them in a database as binary blobs, but since they don’t need to run any kind of reporting or queries against them, Azure Blob Storage will be cheaper.
To connect their on-premises database to Azure resources, they can use a VPN with VPN Gateway. This allows them to set up an encrypted tunnel between their on-premises resources and their Azure virtual network.
To monitor their on-premises thermostat devices, ContosoPharm can use IoT Hub. They can set up alerts to notify someone when temperatures are outside of normal range. They can even use the device twin to configure tags so that they can set up different rules for different groups of IoT devices. Because they will need to add over 500,000 devices, they can use IoT Hub Device Provisioning Service to provision all of those devices.
You can advise the CTO to route IoT data from IoT Hub to Azure Data Lake Storage. You can then use Azure Databricks to clean that data and feed it into Azure Machine Learning Service. If their developers can develop a ML model that can be trained to discover anomalies, they can score that model to determine if they can reliable predict a problem before it happens. If they don’t have anyone with the expertise to develop a model, they can likely get that work done without programming using Machine Learning Studio. The model can then be exposed as a web service that can be called by another application.
Finally, to ensure they are taking action to reduce costs as much as possible, you can advise them to make use of Azure Advisor to take action on any cost recommendations.
Chapter summary
This chapter covered a lot of ground! Not only did you learn some of the basics of Azure related to regions and resource groups, but you learned about a lot of the core services Azure provides. You also learned about some of the hottest topics in technology today: IoT, machine learning, and serverless computing. We wrapped it up with information on how you can use some of the management tools Azure provides.
Here’s a summary of what this chapter covered.
An Azure region is an area within a specific geographical boundary, and each region is typically hundreds of miles apart.
A geography is usually a country, and each geography contains at least two regions.
A datacenter is a physical building within a region, and each datacenter has its own power, cooling supply, water support, generators, and network.
Round-trip latency between two regions must be no greater than 2ms, and this is why regions are sometimes defined as a “latency boundary.”
Customers should deploy Azure resources to multiple regions to ensure availability.
Availability zones ensure that your resources are deployed into separate datacenters in a region. There are at least three availability zones in every region.
Azure Resource Manager (ARM) is how Azure management tools create and manage Azure resources.
ARM uses resource providers to create and manage resources.
An ARM template allows you to ensure consistency of large Azure deployments.
Resource groups allow you to separate Azure resources in a logical way, and you can tag resources for easier management.
Azure Virtual Machines are an IaaS offering where you manage the operating system and configuration.
Availability sets protect your VMs with fault domains and update domains. Fault domains protect your VM from a hardware failure in a hardware rack. You are protected from VM reboots by update domains.
Scale sets allow you to set up auto-scale rules to scale horizontally when needed.
Containers allow you to create an image of an application and everything needed to run it. You can then deploy this image to Azure Container Instances, Azure Kubernetes Service, or Web App for Containers.
An Azure virtual network (VNET) allows Azure services to communicate with each other and the Internet.
You can add a public IP address to a VNET for inbound Internet connectivity. This is useful if a website is running in your VNET and you want to allow people to access it.
Azure Load Balancer can distribute traffic from the Internet across multiple VMs in your VNET.
Azure Application Gateway is a load balancer well-suited to HTTP traffic and is a good choice for websites.
VPN Gateway allows you to configure secure VPN tunnels in your VNET. This can be used to connect across Azure regions or even to on-premises machines.
Azure Content Delivery Network caches resources so that users can get a faster experience across the globe.
Azure Traffic Manager is a DNS-based solution that can help to load balance web requests, send traffic to a new region in an outage, or send users to a particular region that’s closest to them.
Azure Blob Storage is a good storage option for unstructured data such as binary files.
If you need to move a large amount of data to Blob Storage, Azure Data Box is a good option. You can have hard drives of numerous sizes shipped to you. Add your data to them and ship them back to Microsoft where they’ll be added to your storage account.
Azure Queue Storage stores messages from applications in a queue so they can be processed securely.
Azure Disk Storage is virtual disk storage for Azure VMs. Managed Disks allow you to remove the management burden of disks.
Azure Files allows you to have disk space in the cloud that you can map to a drive on-premises.
Azure SQL Database is a relational database system in the cloud that is completely managed by Microsoft.
Azure Cosmos DB is a NoSQL database in the cloud for unstructured data.
The Azure Marketplace is a source of templates for creating Azure resources. Some are provided by Microsoft and some are provided by third-parties.
The Internet of Things (IoT) refers to devices with sensors that communicate with each other and with the Internet.
Azure IoT Hub allows you to manage IoT devices and route message to and from those devices.
Azure IoT Hub Provisioning Service makes it easy to provision a large number of devices into IoT Hub.
Azure IoT Central is a SaaS offering for monitoring IoT devices.
Big data refers to more data that you can analyze through conventional means within a desired time-frame.
Big data is stored in a data warehouse. In Azure, that can be Azure SQL Data Warehouse or Azure Data Lake Storage. SQL Data Warehouse is good for relational data. Data Lake Storage is good for any type of data.
HDInsight is Microsoft’s solution for clustered Hadoop processing of big data.
The process of AI decision making at several points along the neural network is referred to as the ML pipeline.
Azure Databricks is a good solution for modeling data from a data warehouse so that it can be effectively used in ML modeling.
Databricks clusters are made up of notebooks that can store all types of information.
Azure Machine Learning Service uses cloud-based resources to train ML models much faster.
Azure Machine Learning Studio allows you to build, train, and score ML models in a drag-and-drop interface.
Serverless computing refers to using surplus VMs in Azure to run your code on-demand. You pay only for when your code runs.
Azure Functions is the compute component of serverless in Azure.
Azure Logic Apps is a workflow serverless solution that uses connectors, triggers, and actions.
Azure Event Grid makes it possible to raise and handle events as you interact with your Azure resources.
The Azure portal is a web-based interface for interacting with your Azure services. It uses ARM API calls under the hood to talk to Azure Resource Manager.
Azure PowerShell Az is a cross-platform PowerShell module that makes it easy to manage Azure resources in PowerShell.
The Azure CLI is a command-line tool that is cross-platform and can be scripted in multiple languages.
Azure Advisor provides best practice recommendations in the area of high-availability, security, performance, and cost.