
Modeling the effectiveness of radio frequency identification (RFID) technologies in improving sales performance in fashion retail outlets
A. De Marco, A.C. Cagliano, M.L. Nervo and C. Rafele, Politecnicodi Torino, Italy
Abstract:
The application of item-level radio frequency identification (RFID) technology in retail supply chains is beneficial in terms of cost savings and increased revenue. However, the economic effects of improved store operations, labor utilization and increased sales have yet to be fully explored. This chapter uses system dynamics (SD) as a means of carrying out structural modeling and simulation, to be integrated with conventional evaluations of return on investment (ROI). Building on previous research into RFID technology in retail supply chains, a model is developed on the basis of a case study of a leading Italian apparel retailer. Simulations show that RFID implementations are profitable whenever they contribute to increasing sales, especially when a fashion retailer is focused on clerk-assisted sales strategies. RFID technology allows better inventory control and faster inventory turnover; moreover, as a result of these more efficient backroom operations, store personnel have more time to assist consumers, leading to a growth in sales.
Key words
radio frequency identification (RFID); supply chain management; retail operations; fashion industry; system dynamics (SD)
9.1 Introduction
RFID technology has the potential to make a significant impact on retail supply chain (SC) operations.1 By remotely reading the electronic product code and other pieces of information on a tag and making data available to information systems across the SC, RFID technology claims to allow better inventory control, reduce stock-out, offer savings in labor costs, and to lead to reduced shrinkage and fewer transaction errors. However, despite several pilot studies and deployment in the retail sector, there is still a limited understanding of the business value of RFID technology (Delen et al., 2007; Lee and Özer, 2007; Whitaker et al., 2007) and, in particular, of item-level RFID tagging. While the benefits that SCs gain from automation of operational processes and from better information are quantifiable (Visich et al., 2009), item-level RFID implementation at the shop floor level requires further investigation. In particular, RFID tagging at the item level promises to bring significant benefits to retailers in enhancing shop floor productivity, promoting sales and improving business performance in general (Gaukler et al., 2007).
Numerous studies have been carried out that explore cost-benefit analysis (Özelkan and Galambosi, 2008), the process-driven value of RFID investments across SC stakeholders (Becker et al., 2010), and the optimal configuration of RFID systems within a supply chain network (Chang et al., 2010). However, there is little research available that evaluates the economic impact of item-level RFID-enabled retail store operations on sales and revenue performance. There are two principal reasons for this. First, the contribution of RFID to sales growth is influenced by a number of interrelated factors, making it difficult to identify the separate benefits offered by individual RFID functions. It is therefore more useful to consider retail store operations as a complex system demanding complex analysis techniques. Second, sales performance is heavily dependent on specific SC organizations and retail strategies. Evaluation frameworks and general business cases should thus be built into company-based case studies (Tzeng et al., 2008).
To overcome these issues, this chapter first proposes the use of system dynamics (SD) (Forrester, 1961; Sterman, 2000) as a modeling and simulation tool to refine ex-ante estimates. SD is the preferred approach, because conventional financial methods, such as capital budgeting with discounted cash flow analysis (CFA), do not inherently include any feedback relationships between system variables in their analysis. In contrast, SD primarily aims to investigate the structure of these cause-and-effect relations and how they evolve over time. Specifically, SD is used here to understand the extent to which RFID technology might impact on the complex relationships between retail operations, inventory management and sales performance, and to provide accurate input for CFA.
We then build a model based on a case study of implementing item-level RFID technology into the retail stores of a leading Italian Apparel and Fashion (A&F) retailer: Miroglio Fashion S.r.l. This is part of a larger project to restructure the supply chain that the company started in 2007. The project offers a valuable opportunity to illustrate the integrated effects of RFID on sales performance, inventory management and sales force utilization. We also show how the new technology might affect retail business growth, depending on the fashion sales strategy adopted by a particular retailer. The case study serves to prove that SD is a practical and predictable means of assisting in the evaluation of the cost and revenue benefits that can be achieved through the use of RFID technology in retail stores.
The case study is presented as follows. Section 9.2 reviews relevant research in the field and looks at the value of RFID technology to date. Section 9.3 outlines the research methodology adopted in this chapter for the modeling of retail store operations. Section 9.4 introduces the case study, while Section 9.5 discusses the model for the project, and Section 9.6 the procedures for testing the model. The next two sections discuss the findings, with Section 9.7 focusing on the impact of RFID, while Section 9.8 looks specifically at the question of return on investment (ROI). Finally, the conclusions are summarized in Section 9.9, along with some limitations and potential future directions.
9.2 Assessing the value of RFID technology
Within the vast amount of literature on the adoption and application of RFID technology (Curtin et al., 2007; Ngai et al., 2008), studies specifically related to the problem of assessing the economic impact of RFID technology can be subsumed into two main management areas: those concerned with understanding the roots of RFID-enabled cost efficiency in retail SCs, and those that look at the impact of RFID on retail store operations and the revenue stream.
The first group can in turn be broken down into further streams of research. Some studies explore the strategic and operational value of RFID to reduce cost and improve the service performance of inter-organizational SCs (Ju, 2008) through enhanced information sharing, increased asset utilization and higher visibility (Lee, 2009; Tzeng et al., 2008; Ustundag, 2009). A second stream of research is more focused on the use of quantitative methods to measure the economic benefits resulting from different aspects of RFID implementation (Delen et al., 2007; Doerr et al., 2006; Kumar et al., 2011; Lee, 2009; Prater and Frazier, 2005) and to provide ROI evaluation models (Lee and Lee, 2010). Within this stream, some works are specifically related to fast retail (Bottani and Rizzi, 2008) and fashion businesses (Koh et al., 2006; Moon and Ngai, 2008). In particular, Bottani et al. (2009) examine a fashion SC composed of a distribution center and a retail store, in order to assess the profitability of an RFID investment and to provide guidelines for its implementation in the A&F industry.
Fieldwork initiatives and pilot studies have also been carried out to determine the effectiveness of RFID implementation and the achievement of cost savings. Key examples come from the experiences of Wal-Mart and METRO Group (Hardgrave et al., 2008; Ton et al., 2005). Some cases report on pilots in the A&F retail industry, such as Prada, Benetton, Marks & Spencer and Kaufhof (Loebbecke and Huyskens, 2006; Loebbecke, 2008). With specific regard to Galeria Kaufhof, Thiesse et al. (2009) survey the use of RFID at the intersection between store logistics and customer service, analyze physical in-store processes, put forward theories about the effects that RFID may have on business processes, and develop a conceptual model to explain the different cause-and-effect chains between RFID investments and their impact on business performance. Gaukler et al. (2007) provide an extensive list of reports and academic papers on RFID trials in the retail industry.
Turning to the second major research area, most models and case-based studies demonstrate that RFID technology has an impact on profitability through revenue growth rather than through cost reduction (Mithas et al., 2008; Tzeng et al., 2008). It is therefore important to assess the impact of RFID on sales and revenues (Whitaker et al., 2007). This second area therefore looks at the benefits that RFID can offer in retail store operations and the revenue stream. It seems that item-level RFID technology contributes to revenue growth because of its inherent intelligent ability to improve sales and capture the customer’s needs (Lo et al., 2008). For example, Koschat (2008) demonstrates that a greater inventory leads to increased consumer demand. In particular, A&F consumers perceive large quantities of items displayed on shelves as an indication of novelty and a major motivation for shopping. Item-level RFID tags can therefore contribute to sales growth through improvements in inventory management and on-shelf availability. For instance, some business studies carried out on pilot schemes (Bauer et al., 2008) report that revenues can increase by 5 to 10% when RFID technology is used to improve store inventories.
However, claims that RFID investments contribute not just to cost savings but also to revenue expansion have not yet been completely substantiated: detailed model-based analysis is required, which would allow integration of the CFA with the complex relationships between different areas of the business influenced by RFID technology (Lee and Özer, 2007). This chapter seeks to fill this gap by using a case-based model to understand the extent to which item-level RFID technology provides value through sales growth and cost efficiency in fast fashion trades (Rust et al., 2002). The case study allows a model to be built to simulate the complex relationships between the variables that affect business performance and to provide CFA with pertinent input data.
9.3 Modeling retail store operations
The company examined in the case study undertook a large project late in 2007, with the aim of restructuring the SC through the implementation of item-level RFID technologies. As part of this project, our research group was given the task of investigating the strategic impact of RFID technology on store operations and providing a viable method to assess the benefits for both revenue and cost streams.
Our approach was based on SD model and simulation phased methodology, as described by Lyneis (1998). SD is a modeling and computer-based simulation method that helps in the understanding of complex systems (Sterman, 2000). SD permits the graphic diagramming of a system of feedback causal loops between interrelated accumulation stocks, flow rates, and auxiliary variables, and the definition of various linear and nonlinear mathematical relations. It also allows commercial software packages to carry out the discrete-step computation required to solve differential sets of equations over a preset time frame (Sterman, 2000). The output from the computer simulation provides a graph showing the curve lines of all variables plotted on the time axis, and the model testing is based on historical data and sensitivity analyses. SD lets the user understand the overall dynamics of the system and the impact of the different variables on the problem at issue; it also provides support for important decisions, and offers a means of testing policies by simulating different scenarios. SD has been widely used in production and operations management to explore inventory capacity and instability (Anderson et al., 2005; Croson and Donohue, 2005; White 1999), as well as to investigate the effects of new technologies on business strategies (Disney et al., 2004; Lyneis, 1998; Pardue et al., 1999; Winch, 1997).
Following the approach adopted by Lyneis, we first worked on understanding, structuring and analyzing the system with regard to distribution, store operations and sales issues. This was achieved by gathering detailed information and process flow data, process mapping, interviews with logistics managers, marketing executives and salespersons, as well as through direct observation of warehouse, shipping and retail store operations.
A first-hand conceptual causal loop diagram was developed with the participation of the company’s personnel, and a numerical SD model was then worked out. In compliance with SD principles and practice, the case model included stock variables, flows and feedback loops that tackle store inventory management, store labor utilization and customer demand, and is based on a select number of previous studies. In part, it is founded on the ‘Stock Management Structure’ model devised by Sterman (2000), which replicates a supply line integrated with stock control balancing feedback loops, comprising both the desired and actual adjustment quantities and the review periods examined. However, the model follows standard practice in SD, rather than other approaches, in considering customer demand as an endogenous variable affected by the performance of the supply line itself (Akkermans and Dellaert, 2005; Ashayeri and Lemmes, 2006; Gonçalves et al., 2005). For instance, Gonçalves et al. (2005) demonstrate that although SC instability and customer demand are often analyzed separately, both interact with product availability: product shortages cause lower demand, which in turn leads to reduced production, prolonging stock-outs that further lower demand, as a destabilizing reinforcing feedback loop, resulting in demand being endogenously affected from within the SC system.
The mathematical equations that underpin the stock and flow diagram were then drawn up. The model was then tested by a variety of methods: curve fitting of historical data, robustness appraisal in relation to extreme values, and analysis of model sensitivity associated with random exogenous variables. The next step was to carry out a number of simulation runs using different scenarios to investigate the effects of RFID implementation on inventory management, use of labor and sales growth. The simulations also provided input data for CFA and ROI assessments. The results were then analyzed and recommendations made.
9.4 Case study: Miroglio Fast Fashion
The mass A&F market is a buyer-driven SC, where retailers seek to capture the consumers’ mood of the moment. Products in the market typically have short life-cycles with highly volatile and seasonal demand; impulse purchasing is also a key feature. Mass apparel retailers therefore follow fashions and seek to exploit the market by bringing new products to their stores as frequently as possible. A large variety of clothes must be designed at short notice so as to include the most recent fashion trends. They must also be made available as quickly as possible to meet customers’ requirements, and in sufficient quantities to ensure sufficient sales, avoid stock-outs and allow prompt replenishment of successful items (Christopher et al., 2004). These factors have all led to an increasing focus on the agile SC and the philosophy of the quick response, a means of increasing the speed and flexibility of reactions to market shifts (Lowson et al., 1999; Masson et al., 2007).
Key international competitors in the mass fast fashion market include Zara-Inditex, H&M-Hennes & Mauritz, The Gap, Benetton, Miroglio and Mango. Most follow an innovative business plan featuring in-house creative design, centralized distribution and frequent shipments to well-located stores that are attractive to consumers (Ghemawat and Nueno, 2006). The stores themselves in fact play a crucial role in communication and advertising: they aim to offer customers a unique shopping experience through variety and novelty of products, to stimulate brand loyalty and to foster the retailer’s identity and brand equity compared to their competitors. The mass fast fashion market displays a number of features, including demand volatility, flexibility and speed, which make it an ideal testing ground for the validity of SD techniques in assessing the effectiveness of RFID technology.
Miroglio Fashion S.r.l., Fast Fashion Division (Miroglio) is a global retailer headquartered in Alba, Italy, which designs, manufactures and sells women’s garments and accessories through the Motivi, Oltre and Fiorella Rubino brands. At the end of 2008, it produced 20 million clothing items and operated more than 1680 stores globally (although this study is restricted to only the 850 stores located in Italy). In the two seasons, fall/winter and spring/summer, each brand chain presents several collections, which are in turn split into a variety of themes, or looks, that differ in design, fabrics and colors. A centralized distribution center (DC) located close to the headquarters collects from multiple manufacturers and packs items to serve all retail stores around the world (Cagliano, 2010).
Product novelty, along with frequency of consumer visits, is achieved by shipping a new theme to Miroglio stores every two weeks, and reconfiguring the interior display. In addition, store managers and sales assistants are committed to delivering experienced and personalized advice to customers, in order to enhance brand fidelity. The corporate managers of the business claim that this clerk-assisted sales strategy distinguishes Miroglio stores from those of its competitors, which are more based on self-purchasing and visual merchandising (Mittelstaedt and Stassen, 1990), and has the added advantage of involving salespersons in the process of improving product quality. The shop personnel must therefore be dedicated to assisting customers, and not required to spend very much time on backroom tasks and other operations that are not directly aimed at selling products.
We now turn to a description of inventory control and receiving and other operations as they are currently performed in Miroglio’s stores. With regard to inventory management, the initial quantity and variety of items to fill the store inventory at the beginning of each theme period (9 per season) are determined centrally by the marketing department, based on demand planning. Replenishment of best-selling items can then be carried out up to twice a day. Store managers are responsible for determining when a replenishment order is required, based on personal experience, past sales performance and forecast, as well as projected store window displays. The reorder quantity is checked and may be adjusted by the central marketing, the basis of store location and visitor frequency statistics. Orders enter the DC queuing system that optimizes the number and size of shipments based on the tradeoff between time and cost of transportation. Whenever a product goes out of stock, availability at other nearby stores is checked; an urgent order can then be placed, which will be sent out in the shortest possible timeframe.
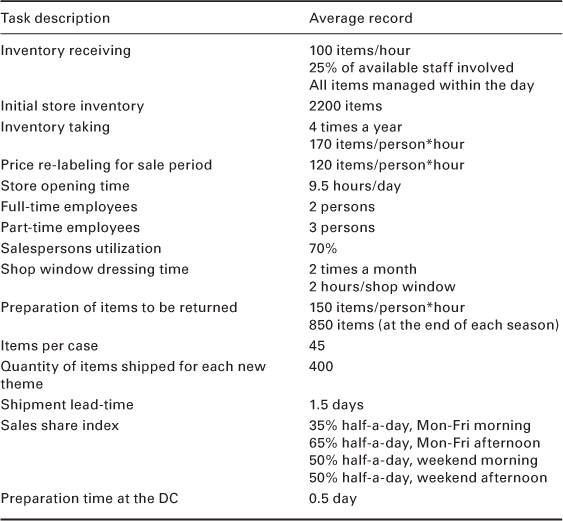
At present, unit loads received in the store backroom are checked against the bill of lading. Then, whenever sales staff are available, items are removed from boxes, individual barcodes are scanned and magnetic-acoustic security tags are applied. A portion of the items received is soon displayed on shelves in the store, while the rest is stored in the backroom. Typically, 70% of the total store inventory is displayed on the shop floor. All salespersons share backroom duties to facilitate the selection of items based on customer demand. At check out, items are scanned for payment transaction and the security tags are removed. Unsold items are put on promotional sale for an 8-week period at the end of the season; any remaining items, which make up approximately 10% of total production, are returned: security tags are removed and a barcode-scanned list of lading is created. Table 9.1 provides a summary of the main tasks with associated parameters, as recorded by the company’s internal auditors of both the Sales and Marketing and the Logistics departments, over a 4-year period since 2005.
We now turn to the impact of introducing RFID technology into the Miroglio SC, with specific focus on assessing the benefits that can result from more efficient shop operations and, in particular, on understanding the sources of sales growth. A disposable garment-care RFID tag was selected (passive ultra-high frequency EPC global standard UHF Class2 Gen2) for this purpose. Handheld readers, with a reading distance of up to 2 meters and a capacity to scan 250 items simultaneously, are used to support the store staff in the receipt of goods as well as with treatment, picking, inventory taking, item positioning and dressing of shop windows. Information corners and theft prevention portals are also included.
With this configuration, a few aspects of store operations will undergo significant changes: incoming deliveries will not need to be counted manually, meaning that boxes do not have to be opened, and items will be made available for display more quickly, because price labeling will be replaced by information corners. In addition, anti-lheft magnetic tagging will no longer be necessary, since the RFID tag incorporates theft prevention technology. Moreover, RFID will allow real-time inventory control and will support the store managers in the process of placing appropriate replenishment orders. The time required for the quarterly inventory and packing returnable items will fall to only a few minutes, meaning that store personnel have more time to devote to exclusive customer care.
9.5 Modeling of store operations at Miroglio
This section provides a description of the main stages of developing the SD model, namely the causal loop diagram and the numerical SD model built using the Vensim® DSS software tool.
9.5.1 Causal loop diagram
Before examining the main feedback loops, one important assumption of our SD model needs to be discussed: the relationship between the time available to assist customers and sales. A survey carried out in the 850 Miroglio stores in Italy revealed that store managers perceive the time spent by salespersons in assisting customers as a key factor in increased sales, probably because staff-assisted sales are a major part of the company’s strategy. This perception is reasonably accurate, since a statistical analysis of historical data collected by the company revealed a slight positive correlation between the time dedicated to helping customers and sales (Fig. 9.1). This finding suggested that the relationship was worth exploring in the study.
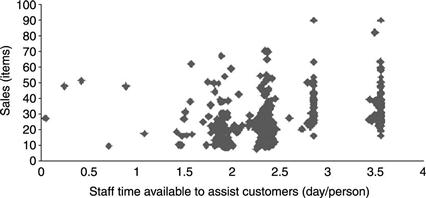
Figure 9.2 illustrates the feedback loops that have the greatest impact on the final SD case model. The loops are extracted from the total diagram:
• Loop No. 1 is a representation of the balancing feedback effect of sales on store inventory. The larger the inventory, the more time staff spend handling items (labeling, counting, etc.), resulting in less time being available to help customers with an associated negative impact on sales. If the sales fall, fewer orders will be placed, leading to fewer items coming into the store and slower inventory growth.
• Loop No. 2 shows the balancing impact of order rate on store inventory. In fact, the order rate is determined by both the sales forecast, through the reorder point and the current level of inventory. If the level of inventory increases, fewer items will be ordered per unit of time, assuming that the reorder point remains equal. As a consequence, fewer items will enter the store, resulting in a store inventory level decrease.
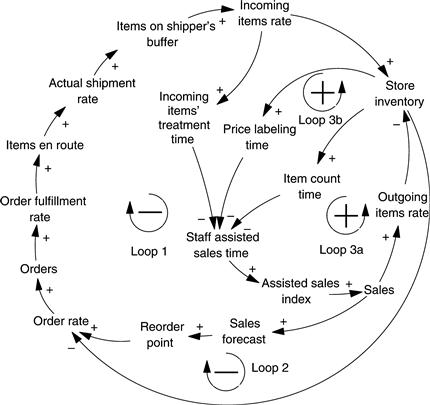
The feedback structure presented in Fig. 9.2 also includes two other reinforcing loops; Loop No. 3a and Loop No. 3b are somewhat similar. As the store inventory increases, less time will be available to assist customers, so that sales will decrease, with a subsequent reduced rate of outgoing items and, therefore, inventory growth. Finally, it should also be noted that the ‘assisted sales index’ has been defined to quantitatively represent the impact on sales of the time spent by staff on customer care. This will be discussed in depth in a later Section.
9.5.2 SD Model
The model is an illustration of the average behavior of the real system: the large variety of garments, sizes and colors is reduced to one sample item and the variety of points of sale is limited to one sample store. The model makes use of the average values reported in Table 9.1. Figure 9.3 illustrates the most relevant parts of the model. The full list of equations is available in the Appendix at the end of the chapter (Section 9.11).
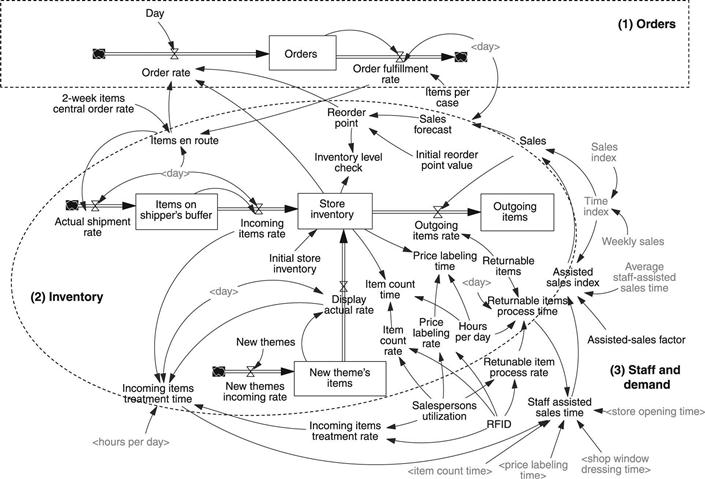
The SD model developed here is a representation of a variable reorder quantity and a stock control policy with a variable review period in times of uncertain demand. It can be broadly divided into two stock and flow sections, namely orders and inventory, and a system of interconnecting variables mainly related to staff usage and sales demand. The top portion of the diagram depicts the order adjustment process: the accumulation of orders is increased by the incoming order rate and decreased by the order fulfillment rate. The rate of orders received at the DC is determined according to
![]() [9.1]
[9.1]
It should be noted that the order rate refers to replenishment orders of sold items. This kind of order is different from other types, namely the 2-week central orders and the new-season orders. Two-week central orders are related to the new themes that Miroglio ships to stores every two weeks during a season, while new-season orders are related to the new themes delivered to stores before the season launch.
As a consequence, ‘items en route’ during a season includes both the ‘2-week items central order rate’ and the ‘order fulfillment rate’, multiplied by the time. The reorder point is initially determined at the beginning of the season and then adjusted throughout the season by both store managers and the central marketing department based on the sales forecast. This has been modeled with a 14-day simple exponential smoothing (Silver et al., 1998); the selected smoothing period is consistent with the period of time that a theme is displayed and allows stochastic noise to be eliminated. The relevant equation is
![]() [9.2]
[9.2]
The portion of the stock and flow diagram that models the store inventory makes use of a dummy incoming buffer (items on shipper’s buffer) in order to eliminate shipments on Saturday afternoons and Sundays, such that Friday shipments are simulated to arrive early the following week. The ‘incoming items rate’ variable refers to those items that enter the store and are promptly displayed for sale. If items that are part of a new theme arrive before the beginning of a season, these are partly stocked in the backroom (new theme’s items) for reasons of limited space, and are progressively displayed on the shelf (display actual rate). The store inventory level is initially determined at the beginning of a season and then increased by both the incoming items rate and the display actual rate. The inventory is reduced by both items sold over the course of the season (the ‘sales’ variable) and items returned at the end of the promotion period (returnable items). It is also worth noting that the variable ‘inventory level check’ returns a binary value, indicating the time when the level of store inventory is lower than the reorder point and, therefore, a replenishment order needs to be placed. Although this type of variable is not strictly essential for the model, it is introduced here for the sake of model testing (Section 9.3).
The lower right-hand portion of Fig. 9.3 relates to measuring the effects of the various feedbacks on the time that store staff can spend on assisting customers and hence increasing sales. This time is equal to the total available productive working hours minus the time required to receive inventory and prepare items for shelf display, dress shop windows and prepare returnable items. The complete definition is given by
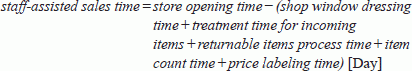 [9.3]
[9.3]
Store opening time is determined by adding the product of full-time employees and full-time working hours to the product of part-time employees and part-time working hours. The resulting quantity is then divided by the number of hours per day.
The ‘sales’ variable is an important element that describes demand and is used to quantify the impact of the increased staff-assisted sales time granted by RFID technology. Sales resulting from the summation of two factors are given as
![]() [9.4]
[9.4]
The ‘time index’ variable allows weekly estimated sales based on previous sales records to be included, and is calculated as
![]() [9.5]
[9.5]
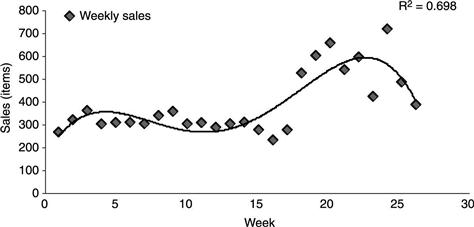
‘Weekly sales’ is a fourth-order polynomial curve line model that reasonably fits previous series of sales data (Fig. 9.4), and the ‘sales index’ (Table 9.1) allows sales to be distributed across every week and day of any one season. It is worth noting that the weekly sales variable represents typical seasonality as a trend, rather than as total values.
The assisted sales index shows the influence of assisted sales time on sales performance, according to
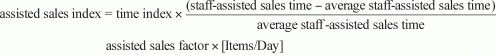 [9.6]
[9.6]
The time index variable is multiplied by the percentage variation of staff-assisted sales time in comparison to the average daily-assisted sales time at each time step of the simulation, and by the ‘assisted sales factor’. The assisted sales factor is a constant parameter that can be set from 0 to 1, to represent the influence of staff assistance on purchasing effectiveness and sales growth. Miroglio has assumed that its current value is 0.5, based on statistics that half of all transactions are completely assisted. An assisted sales factor of zero would cause the system to fall into the polynomial demand model.
A binary ‘RFID’ input variable was also included: a value of 0 means that the model replicates the current store conditions, while a value of 1 denotes a reduction in the time required to perform backroom operations, and consequently an increased amount of time available for customer care. The model considers the potential of RFID technology to automate and reduce the time required to perform the operations listed in Table 9.1. The simulations were run with Euler integration, a 0.5 time step, a time horizon consistent with a season of 182 working days, steady and unvaried exogenous conditions, and replenishment orders placed up to day 165, just before the beginning of the sale period. Other assumptions are included in Table 9.1.
9.6 Model testing
Before any simulations involving future state scenarios were tested, the first test was to assess whether the simulated results fit the curve lines of previous data sets pertaining to the current scenario in which RFID technology was not used. These tests were taken as an ex-ante evaluation of the validity and predictability of the model, and were run by means of curve fitting of the simulated behavior, robustness tests and sensitivity analyses (Sterman, 2000).
The fitting of the model output to real data was checked by focusing on the main variables: ‘sales’, ‘store inventory’, and ‘actual shipment rate’ (replenishment shipments). Figure 9.5 compares the trends of actual versus simulated sales when the assisted sales factor variable is set at 0 (Fig. 9.5(a)) and 1 (Fig. 9.5(b)). It is clear that the curve of the simulated outcomes bears a close resemblance to those of the historical outcomes. Only in the last ten weeks of the season do the actual values oscillate more than the simulated values, probably as a result of some particularly appealing characteristics of single themes that are put on the market fortnightly, an aspect that was not considered in our model. Similar results were obtained for the other factors investigated, thus allowing us to conclude that the SD model is able to effectively reproduce the actual behavior of the system at issue.

9.5 (a) Actual and simulated sales when the assisted sales factor equals 0; and (b) actual and simulated sales when the assisted sales factor equals 1.
Model robustness and sensitivity analyses were supported by the specific validation tool developed by Vensim® DSS. Multivariate sensitivity analyses were performed by defining input variables as uniformly distributed and launching 200 simulation runs for each analysis. As a first step, assisted sales factor and sales were assumed to be random input variables. When the level of store inventory is lower than the reorder point, such as when the binary variable inventory level check is activated, it is assumed that there is an increased probability of stock-out, negatively influencing sales. Thus, a sales decrease of 30 to 90% has been assumed in those time steps when inventory level check equals 1. Figure 9.6(a) shows the probability distribution of the store inventory variable, and Fig. 9.6(b) the probability distribution of the incoming items rate variable as the percentage of reduced sales varies.
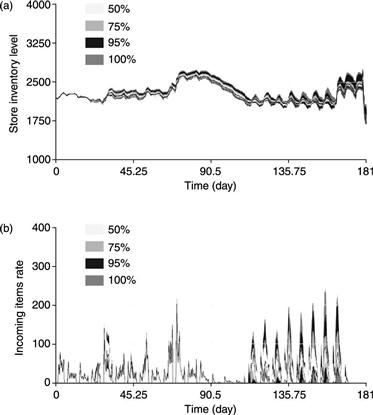
9.6 (a) Probability distribution of store inventory level; and (b) probability distribution of the incoming items rate.
Both variables show similar trends associated with different confidence levels (50, 75, 95 and 100%). The probability distribution of sales provides further evidence of model robustness (Fig. 9.7). First, it should be noted that sales values are never negative. Second, the apparent oscillation observed at the end of the season is not an indication of poor model robustness, but is instead due to the fluctuating market demand during the 8-week-long promotional period.
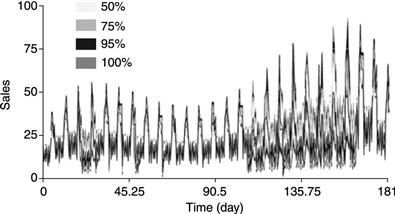
Sensitivity analyses were also performed on the sales growth data. In this case, when the inventory level check variable is nil, sales are increased by up to 70%. The use of a sales increase scenario and a sales decrease scenario means that the model can be effectively tested for conditions of highly variable demand. Inventory level effects on sales were then removed and the variables ‘items per case’ and ‘salesperson utilization’ were defined as random values. Finally, previously defined variations in sales were combined with a scenario in which sales staff are scarce, in order to understand the store behavior predicted by the model under extreme conditions of both highly variable demand and low availability of sales staff. The most relevant stock and flow variables were not found to be sensitive to changes in input quantities.
9.7 Assessing the impact of RFID technology
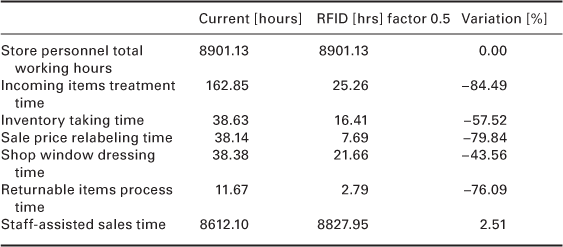
Assuming an assisted sales factor of 0.5, the simulations indicate that the introduction of RFID technology in Miroglio Fashion stores could increase the time available for staff to assist customers by up to 2.5%, as a result of the reduced time required for backroom operations (Table 9.2). Moreover, if the assisted sales factor increases, the inventory turnover also increases as an associated effect of the increased sales rate. This in turn contributes to a time-based competitive advantage.
Table 9.2
Comparison of time spent on store operations between current status and with RFID technology
The combination of the assisted sales factor with RFID technology directly results in increased sales volumes (Fig. 9.8). The model estimates that seasonal cumulative sales would rise by up to 2.5%, assuming that the assisted sales factor remains constant at 0.5, as a result of the interconnecting dynamic feedback effects of increased assisted sales time, better inventory control, reduced stock-outs and faster inventory turnover. As the assisted sales factor goes up, cumulative sales increase almost linearly. Moreover, the derivatives of curves show that as the assisted sales factor increases, the benefits of RFID technology on sales become more significant. However, when the assisted sales factor is zero, for example when visual merchandising and a self-purchasing strategy are adopted, implementing RFID does not contribute directly to sales growth, but only allows cost savings in labor terms due to shorter backroom operations.
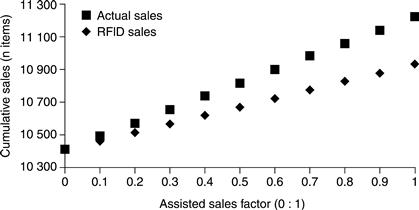
9.8 Growth of sales as a function of the assisted sales factor, in both current and RFID case-scenarios.
The quicker inventory turnover permitted by an increased assisted sales factor also allows a lower level of store inventory to be achieved, improving business efficiency. Figure 9.9 shows the inventory level with and without the use of RFID technology against the different values assigned to the assisted sales factor. Without RFID (Fig. 9.9(a)), an increase in the assisted sales factor generally leads to a decrease in inventory level. This benefit is even more significant when RFID technology is employed: the difference between the curve line with an assisted sales factor equal to 1 and the others is greater than the equivalents without RFID (Fig. 9.9(b)).
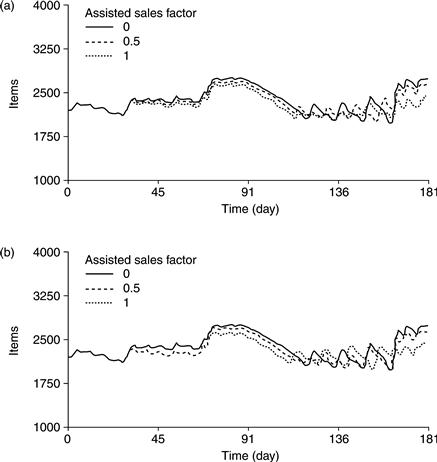
9.9 (a) Inventory level as a function of the assisted sales factor, in the current case-scenario; and (b) inventory level as a function of the assisted sales factor, in the RFID case-scenario.
These results are based on the assumption that the extra time made available by RFID technology is spent serving a greater number of consumers, who can be expected to visit the store when the economy is healthy. Moreover, the longer time available for assisting customers may effectively be used only when the sales strategy is strongly based on staff-assisted sales, as in the case of Miroglio Fashion. However, in periods of low demand, for example, during a stagnating economy, or when sales are not assisted, the time saved in background operations may only lead to cost savings through a reduction in store personnel.
9.8 Assessing return on investment from RFID technology
To complete the process of quantifying the economic benefits of item-level RFID, SD simulation outcomes served as inputs for CFA to evaluate the return on RFID investment achieved by a retailer focused on a salespersons-assisted sales strategy, such as Miroglio. Different market scenarios were considered under different economic conditions. In a stagnating economy, a steady trend of undiminished current sales is assumed over the cash flow period, so that only personnel cost savings are created. In a booming economy, which is modeled using a greater ‘sales index’ variable, the availability of RFID technology would replace the need for additional personnel to meet the increased demand. Also, with the increased sales index associated with a booming economy, the average inventory level reduces due to a greater sales rate and a shorter inventory turnover, meaning that no extra storage space is required over that currently available (Fig. 9.9(b)).
For each of the two scenarios, 3-year and 5-year net present values (NPVs) and internal rates of return (IRRs) were compared. The discounted pay-back period (DPP) was also computed.
We evaluated the discount rate by using the Weighted Average Cost of Capital (WACC) method, based on Miroglio’s current economic performance. Two situations were analyzed: first, the company’s investment in RFID technology was assumed to be completely funded by equity; while the second situation assumed a 65% debt leverage, according to Miroglio’s standard investment policy. The following additional assumptions were made for the purposes of CFA: a €21 500 investment to equip each individual store with RFID technology; a gross profit per item equal to 75% of sale price, lowered to 37.5% during the promotional period; and a cautious cost estimate of 14€cents per disposable tag. Cash streams did not take into account maintenance and operations costs of RFID middleware, and the effect of taxes was not considered.
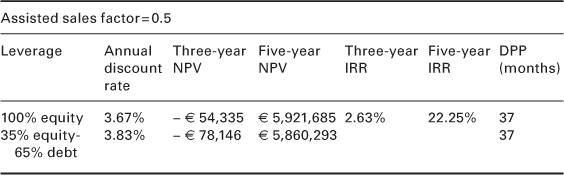
With stagnating demand, RFID only allows a reduction in store personnel. The cash flow comprised the initial RFID investment, the cost of disposable tags and the reduced cost of human resources. Personnel cost savings were evaluated by multiplying the cost per hour of individuals by the total amount of hours saved over the course of a month as a result of the reduced time spent on backroom operations. This scenario leads to a DPP of slightly over three years (Table 9.3). Calculations were performed under Miroglio’s current value for the assisted sales factor (0.5), since an increased assisted sales factor would not lead to augmented sales due to market stagnating conditions. In addition, the 3-year IRR is lower than the cost of capital. Thus, if the RFID technology became obsolete within three years, the investment should not be pursued.
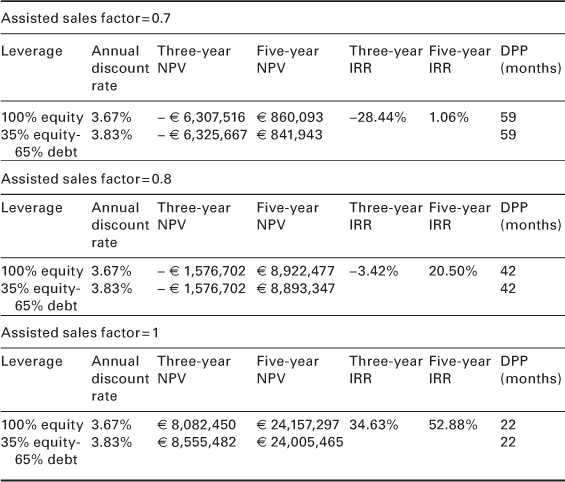
In a booming economy, the decreased time spent on backroom operations can be used to raise sales. However, in order to ensure that Miroglio stores would actually be able to transform this time into increased sales and would not need to reduce staffing levels, we estimated an extra 5-year promotional investment of €10 500 000 to attract the additional demand required and to achieve the predicted increase in market share. The figure is based on budgeted estimates from the company’s marketing department, which indicated that this was a level of effort similar to a previous 5-year plan to increase the market share, so that sales could be expected to increase by 2 to 5% (Fig. 9.8).
The resulting enlargement of the company’s market share has been quantified by capturing the raised sales as an increase in the assisted sales factor. Cash flow analyses were performed by setting the assisted sales factor at 0.7, 0.8 and 1, respectively. The first two values represent a medium market share growth, while the third is a strong expansion. Besides the marketing investment, the cash stream also includes the initial investment in RFID technology, increased sales revenues and the costs of tags. Table 9.4 shows the results obtained. The best investment return is achieved when the assisted sales factor equals 1, in line with a large increase in market share, with a DPP lasting for less than two years. However, with a medium growth in market share, the investment is not profitable within a 3-year time frame.
9.9 Conclusion and future trends
This chapter has proposed the use of SD as a structural modeling and simulation method to assist in the process of assessing the economic impact of item-level RFID technology on retail operations, with specific reference to one fast fashion retailer. SD proves to be a valuable empirical approach, because it is able to take into account the complex interrelated feedback effects of the multiple variables involved in overall performance of the system.
Using this method, RFID technology has been shown not only to reduce operational costs, but to offer benefits in the revenue stream by allowing increased sales, particularly when the retailer makes use of store personnel to assist customers. RFID technology allows various backroom operations to be automated, with a resulting reduction in the time required to carry out these procedures. It consequently also frees up extra time for the store personnel to assist customers, leading to potential increases in sales and revenue. The case study suggests that retailers focused on salesperson-assisted sales strategies could invest in item-level RFID technology in a booming economy as a promising means of tackling market growth, using the time saved from the automation of backroom operations to take care of a greater number of customers, thus achieving a higher return on the RFID investment. In this context, RFID technology can be used as a driver of competitive advantage and a lever for market share growth.
The integration between SD and CFA adopted in this case-based model can easily be applied to similar retailers, as a tool to provide strategic insights for the implementation of item-level RFID technology. It can also be adopted to evaluate both the operational and economic benefits provided by innovation, wherever industry behavior is determined by a series of complex interconnected feedback effects among relevant variables.
However, it should be noted that the approach suggested in this chapter does have some limitations. First, the assumptions made lead to certain restrictions in applicability: storage costs, any potential RFID technology breakdown-related expenditures, and staff training costs are all ignored. Second, the method disregards potential additional impacts on store operations and sales strategy, such as perpetual inventory and in-store location, theft prevention, check-out automation, interactions with salespeople’s productivity, and various innovative marketing technologies, such as dynamic pricing. Moreover, it only takes into account factors relating to product identification, while ignoring possible implications for customer identification and relationship management. Finally, the current study is restricted to just assessing the benefits of RFID on store operations, and does not include any impact on the DC and manufacturing echelons of the SC, nor any additional soft variables involved in restructuring the process. Future research to be carried out by this group should include all of these elements.
It should also be observed that the economic benefits largely depend on the existing technological capacity of the individual retailer, because the lower the current levels of automation, the higher the economic return from RFID implementation. Moreover, the model does not address inter-organizational SC issues. Its main value is therefore for the retailers, who obtain the maximum advantage from in-store implementation of RFID, rather than other SC players (Bottani and Rizzi, 2008). Finally, some limitations are inherent in the predictive nature of the proposed SD decision support model, which would need an ex-post validation based on the experience of implementing RFID before it can be assumed to be wholly valid and reliable.
9.10 Acknowledgements
This study is part of Miroglio’s SC reengineering project with the involvement of the Engineering Systems and Logistics Research Group (RESLOG) of the Politecnico di Torino. The authors wish to acknowledge Miroglio Fashion S.r.l., Sales and Marketing and Logistics Units, and in particular Piero Abellonio, Logistics Director, and Maurizio Rijllo for active collaboration, support and permission for publication.
9.11 Appendix: full list of the equations of the system dynamics model
“2-week items central order”:=GET XLS DATA(‘file.xls’, ‘sheet’, ‘cell’, ‘cell’); Units: Items/Day
actual shipment rate=(items in route/day); Units: Items/Day
arrival of new season’s themes=500 * PULSE TRAIN(163, 0.5, 5, 181); Units: Items/Day
day=1; Units: Day
display actual rate=IF THEN ELSE(PULSE TRAIN(5.2, 1.8, 7, 181), 0, new season’s items/day); Units: Items/Day
“full-time employees” = IF THEN ELSE(PULSE TRAIN(4.5, 2.5, 7, 181), 2, 2 * RANDOM UNIFORM(0.65, 0.7, 0.01)); Units: employee
“full-time working hours” = 1*9.5; Units: Hour/employee
hours per day=9.5; Units: Hour/Day
incoming items rate = IF THEN ELSE(PULSE TRAIN(5.2, 1.8, 7, 181), 0, (items on shipper’s buffer/day)); Units: Items/Day
incoming items treatment rate=IF THEN ELSE(RFId = 0, (salespersons utilization*RANDOM UNIFORM(95, 105, 1)), salespersons utilization* RANDOM UNIFORM(650, 700, 10)); Units: Items/Hour
incoming items’ treatment time = ((incoming items rate + display actual rate) * day / incoming items treatment rate) / hours per day; Units: Day
initial inventory coverage = 2150; Units: Items
intial store inventory = 2200; Units: Items
inventory adjustment = SMOOTH(sales *day ,14); Units: Items
item count rate=IF THEN ELSE(RFId = 0, (salespersons utilization*RANDOM UNIFORM(300, 350, 1))* (PULSE(63, 1) + PULSE(126, 1)), (salespersons utilization *RANDOM UNIFORM (750, 870, 10)) * (PULSE(63, 1) + PULSE(126, 1))); Units: Items / Hour
item count time = IF THEN ELSE(item count rate = 0, 0, (store inventory/item count rate)
/ hours per day); Units: Day
items in route = DELAY FIXED (order fulfillment rate*day + “2-week items central order” * day, (0.5*RANDOM UNIFORM(1.4, 1.7, 0.1 + 0.5* RANDOM UNIFORM(1.9, 2.4, 0.1))), 0); Units: Items
items on shipper’s buffer = INTEG (actual shipment rate-incoming items rate,0); Units: Items
items per case = 45; Units: Items
new season’s items = INTEG (new themes’ incoming rate-display actual rate, 0); Units: Items
new themes’ incoming rate=arrival of new season’s themes; Units: Items/Day
order fulfillment rate = (MAX (0, INTEGER(orders/items per case) * items per case/day)) * PULSE TRAIN(0, 5, 7, 181); Units: Items/Day
order rate = MAX(0, (reorder point-store inventory-items in route) / day); Units: Items/Day
orders = INTEG (order rate-order fulfillment rate, 0); Units: Items
outgoing items = INTEG (outgoing items rate, 0); Units: Items
outgoing items rate = sales + returnable items; Units: Items/Day
“part-time employees” = IF THEN ELSE(PULSE TRAIN(4.5, 2.5, 7, 181), 3, 3* RANDOM UNIFORM(0.65, 0.7, 0.01)); Units: employee
“part-time working hours” = 0.5*9.5; Units: Hour/employee
price labeling rate = IF THEN ELSE(RFId = 0, (salespersons utilization* RANDOM UNIFORM(140, 160, 1)) * PULSE(145, 1), (salespersons utilization*RANDOM UNIFORM(750, 800, 10)) * PULSE(145, 1)); Units: Items/Hour
price labeling time = IF THEN ELSE(price labeling rate = 0, 0, (store inventory/price labeling rate)/hours per day); Units: Day
reorder point = ACTVE INITIAL ((initial inventory coverage + inventory adjustment)*PULSE(0, 165), initial inventory coverage); Units: Items
returnable items time = IF THEN ELSE(returnable item rate = 0, 0, (returnable items*day/returnable item rate) /hours per day); Units: Day
returnable item rate = IF THEN ELSE(RFId = 0, (salespersons utilization*RANDOM UNIFORM(180, 200, 1)) * PULSE(179, 1), (salespersons utilization*RANDOM UNIFORM(750, 800, 10)) * PULSE(179, 1)); Units: Items/Hour
returnable items = RANDOM UNIFORM(700, 800, 10) *PULSE(179, 1); Units: Items/Day
RFId = 1; Units: Dmnl [0,1,1]
sales: = GET XLS DATA(‘file_motivi.xls’, ‘vendite’, ‘A’, ‘C1’); Units: Items/Day
salespersons utilization = 0.7; Units: Dmnl
shop window dressing rate = IF THEN ELSE(RFId = 0, (RANDOM UNIFORM(2, 2.5, 0.1)/salespersons utilization)* PULSE TRAIN(14, 0.5, 14, 181), RANDOM UNIFORM(1.5, 2, 0.5) * PULSE TRAIN(14, 0.5, 14, 181)); Units: Hour
show window time = IF THEN ELSE(shop window dressing rate = 0, 0, shop window dressing rate/hours per day); Units: Day
“staff-assisted sales time” = MAX(0, store opening time – (show window time + incoming items’ treatment time + returnable items time + item count time + price labeling time)); Units: Day
stock out = IF THEN ELSE(reorder point-store inventory >= 0, 1, 0); Units: Dmnl
store inventory = A FUNCTION OF(display actual rate, incoming items rate, initial store inventory, outgoing items rate); Units: Items
store inventory = INTEG (MAX(0, incoming items rate+display actual rate-outgoing items rate), initial store inventory); Units: Items
store opening time = IF THEN ELSE(PULSE TRAIN(0, 0.5, 1.5, 181), 0.8* (((“full-time employees”* “full-time working hours”) + (“part-time employees”* “part-time working hours”))/hours per day), (((“full-time employees”*”full-time working hours”) + (“part-time employees”*”part-time working hours”))/hours per day)); Units: Day
9.12 References
1. Akkermans H, Dellaert N. The rediscovery of industrial dynamics: The contribution of system dynamics to supply chain management in a dynamic and fragmented world. System Dynamics Review. 2005;21(3):173–186.
2. Anderson Jr EG, Morrice DJ, Lundeen G. The ‘physics’ of capacity and backlog management in service and custom manufacturing supply chains. System Dynamics Review. 2005;21(3):217–247.
3. Ashayeri J, Lemmes L. Economic value added of supply chain demand planning: A system dynamics simulation. Robotics & Computer-Integrated Manufacturing. 2006;22(5/6):550–556.
4. Bauer R, Scarborough DA, Stafford J. Avery-Dennison Leadership Forum, RFID in Fashion 2008 Conference, New York: The Fashion Institute of Technology, 13–14 August 2008. Available from: http://www.rfidjournalevents.com/pres_fashion08.php; 2008; (accessed 6 March 2009).
5. Becker J, Vilkov L, Weiß B, Winkelmann A. A model-based approach for calculating the process driven business value of RFID investments. International Journal of Production Economics. 2010;127(2):358 317.
6. Bottani E, Ferretti G, Montanari R, Rizzi A. The impact of RFID technology and EPC system on logistics processes of the fashion industry supply chain. International Journal of RF Technologies: Research and Applications. 2009;1(4):225–252.
7. Bottani E, Rizzi A. Economical assessment of the impact of RFID technology and EPC system on the fast-moving consumer goods supply chaini. International Journal of Production Economics. 2008;112(2):548–569.
8. Cagliano AC. Understanding Supply Chain Complexity: An Approach Integrating Performance Measurement and System Dynamics. Saarbrücken, Germany: VDM Verlag Dr. Muller; 2010.
9. Chang S, Klabjan D, Vossen T. Optimal radio frequency identification deployment in a supply chain network. International Journal of Production Economics. 2010;125(1):71–83.
10. Christopher M, Lawson R, Peck H. Creating agile supply chains in the fashion industry. International Journal of Retail & Distribution Management. 2004;32(8):367–376.
11. Croson R, Donohue K. Upstream versus downstream information and its impact on the bullwhip effect. System Dynamics Review. 2005;21(3):249–260.
12. Curtin J, Kauffman RJ, Riggins FJ. Making the ‘MOST’ out of RFID technology: A research agenda for the study of the adoption, usage and impact of RFID. Information Technology & Management. 2007;8(2):87–110.
13. Delen D, Hardgrave BC, Sharda R. RFID for better supply-chain management through enhanced information visibility. Production and Operations Management. 2007;16(5):613–624.
14. Disney SM, Naim MM, Potter A. Assessing the impact of e-business on supply chain dynamics. International Journal of Production Economics. 2004;89(2):109–118.
15. Doerr KH, Gates WR, Mutty JE. A hybrid approach to the valuation of RFID/MEMS technology applied to ordnance inventory. International Journal of Production Economics. 2006;103(2):726–741.
16. Forrester JW. Industrial Dynamics. Cambridge, MA: MIT Press; 1961.
17. Gaukler GM, Seifert RW, Hausman WH. Item-level RFID in the retail supply chain. Production and Operations Management. 2007;16(1):65–76.
18. Ghemawat P, Nueno JL. Zara: Fast Fashion HBS 703–497 Boston, MA: Harvard Business School Publishing; 2006; Harvard Business Online, available from: http://harvardbusinessonline.hbsp.harvard.edu; 2006.
19. Gonçalves P, Hines J, Sterman J. The impact of endogenous demand on push–pull production systems. System Dynamics Review. 2005;21(3):187–216.
20. Hardgrave BC, Langford S, Waller M, Miller R. Measuring the impact of RFID on out of stocks at Wal-Mart. MIS Quarterly Executive. 2008;7(4):181–192.
21. Ju TL. A strategic examination of radio frequency identification in supply chain management. International Journal of Technology Management. 2008;43(4):349–362.
22. Koh CE, Kim HJ, Kim EY. The impact of RFID in retail industry: Issues and critical success factors. Journal of Shopping Center Research. 2006;13(1):101–117.
23. Koschat MA. Store inventory can affect demand: empirical evidence from magazine retailing. Journal of Retailing. 2008;84(2):165–179.
24. Kumar S, Kadow BB, Lamkin MK. Challenges with the introduction of radio-frequency identification systems into a manufacturer’s supply chain: A pilot study. Enterprise Information Systems. 2011;5(2):235–253.
25. Lee H, Özer Ö. Unlocking the value of RFID. Production and Operations Management. 2007;16(1):40–64.
26. Lee I, Lee BC. An investment evaluation of supply chain RFID technologies: A normative modeling approach. International Journal of Production Economics. 2010;125(2):313–323.
27. Lee YM. A quantitative view on how RFID can improve inventory management in a supply chain. International Journal of Logistics: Research & Applications. 2009;12(1):23–43.
28. Lo W-S, Hong T-P, Jeng R. A framework of E-SCM multi-agent systems in the fashion industry. International Journal of Production Economics. 2008;114(2):594–614.
29. Loebbecke C. A competitive perspective on standard-making: Kaufhof’s RFID project in fashion retailing. Electronic Markets. 2008;18(1):30–38.
30. Loebbecke C, Huyskens C. Weaving the RFID yarn in the fashion industry: The Kaufhof case. MIS Quarterly Executive. 2006;5(4):169–179.
31. Lowson RH, King R, Hunter NA. Quick Response: Managing the Supply Chain to Meet Customer Demand. Hoboken, NJ: John Wiley & Sons, Inc.; 1999.
32. Lyneis JM. System dynamics for business strategy: A phased approach. System Dynamics Review. 1998;15(1):35–70.
33. Masson R, Iosif L, MacKerron G, Fernie J. Managing complexity in agile global fashion industry supply chains. International Journal of Logistics Management. 2007;18(2):238–254.
34. Mithas S, Tafti A, Bardhan I, Goh JM. Resolving the profitability paradox of information technology: Mechanisms and empirical evidence College Park, MD: R. H. Smith School of Business, University of Maryland; 2008; Working paper.
35. Mittelstaedt RA, Stassen RE. Shopping behavior and retail merchandising strategies. Journal of Business Research. 1990;21(3):243–258.
36. Moon KL, Ngai EWT. The adoption of RFID in fashion retailing: A business value-added framework. Industrial Management & Data Systems. 2008;108(5):596–612.
37. Ngai EWT, Moon KL, Riggins FJ, Yi CY. RFID research: An academic literature review (1995–2005) and future research directions. International Journal of Production Economics. 2008;112:510–520.
38. Özelkan EC, Galambosi A. When does RFID make business sense for managing supply chains? International Journal of Information Systems and Supply Chain Management. 2008;1(1):15–25.
39. Pardue JH, Clark Jr TD, Winch GW. Modeling short- and long-term dynamics in the commercialization of technical advances in IT producing industries. System Dynamics Review. 1999;15(1):97–105.
40. Prater E, Frazier GV. Future impacts of RFID on e-supply chains in grocery retailing. Supply Chain Management. 2005;10(2):134–142.
41. Rust RT, Moorman C, Dickson PR. Getting return on quality: Revenue expansion, cost reduction, or both? Journal of Marketing. 2002;66(4):7–24.
42. Silver EA, Pyke DF, Peterson R. Inventory Management and Production Planning and Scheduling. Hoboken, NJ: John Wiley & Sons, Inc.; 1998.
43. Sterman JD. Business Dynamics: Systems Thinking and Modeling in a Complex World. Boston, MA: McGraw-Hill; 2000.
44. Thiesse F, Al-Kassab J, Fleisch E. Understanding the value of integrated RFID systems: A case study from apparel retail. European Journal of Information Systems. 2009;18(6):592–614.
45. Ton Z, Dessain V, Stachowiak-Joulain M. RFID at the METRO Group HBS 606–053 Boston, MA: Harvard Business School Publishing; 2005; Harvard Business Online, available from: http://harvardbusinessonline.hbsp.harvard.edu; 2005.
46. Tzeng SF, Chen W, Pai F. Evaluating the business value of RFID: Evidence from five case studies. International Journal of Production Economics. 2008;112:601–613.
47. Ustundag A. The impacts of Radio Frequency Identification technology on supply chain costs. Transportation Research Part E – Logistics and Transportation Review. 2009;45(1):29–38.
48. Visich JK, Li S, Khumawala BM, Reyes P. Empirical evidence of RFID impacts on supply chain performance. International Journal of Operations and Production Management. 2009;29(12):1290–1315.
49. Whitaker J, Mithas S, Krishnan MS. A field study of RFID deployment and return expectations. Production and Operations Management. 2007;16(5):599–612.
50. White AS. Management of inventory using control theory. International Journal of Technology Management. 1999;17(7/8):847–861.
51. Winch GW. The dynamics of process technology adoption and the implications for upgrade decisions. Technology Analysis & Strategic Management. 1997;9(3):317–329.
1Note: This chapter is adapted from: A. De Marco, A. C. Cagliano, M. L. Nervo and C. Rafele (2012), Using system dynamics to assess the impact of RFID technology on retail operations, International Journal of Production Economics, 135(1), 333–44. Reproduced with permission from Elsevier.