
The role of radio frequency identification (RFID) technologies in improving distribution and retail operations in the fashion supply chain
E. Bottani, A. Volpi, A. Rizzi, R. Montanari and M. Bertolini, University of Parma, Italy
Abstract:
This chapter examines the benefits achievable when radio frequency identification (RFID) technology is implemented into the fashion supply chain, and is based on two of our earlier studies in this field. A theoretical feasibility study demonstrates how the logistics processes of a typical fashion retail store (RS) and distribution centre (DC) should be reengineered to implement RFID technology successfully, and provides a quantitative evaluation of the impact of applying RFID technology to those processes. These preliminary findings are confirmed by the main outcomes obtained from an in-field implementation, the RFID Fashion Pilot (RFP) study. The results of our economic analysis could be useful for companies operating in the RFID area or in fashion, and help to provide an economic justification for implementing RFID in the fashion industry.
Key words
radio frequency identification (RFID); fashion supply chain; feasibility study; pilot study
2.1 Introduction
The fashion industry is becoming increasingly complex and dynamic, partly due to the advent of own brands and the globalization of sourcing and supply chain decisions (Hines and McGowan, 2005). The industry has recently attracted the attention of several researchers in the area of operations and supply chain management (SCM) (Bruce et al., 2004; Christopher and Towill, 2001; Harrison et al., 1999; Lowson et al., 1999). The fashion supply chain has specific characteristics which make its management particularly complex, including short product life-cycles, high volatility and low predictability of demand (Bruce et al., 2004; Choi, 2007; Christopher et al., 2004).
Balancing production and demand is a challenge faced by all manufacturing businesses, including fashion retailers (Nair and Closs, 2006). Such industries have learned that the supply chain operates more efficiently when lead times are decreased and forecasting errors are reduced. Supply chain performance can be improved by identifying approaches and tools for automating logistics processes (thus reducing the time to market), and improving the availability of information (Choy et al., 2009).
The fashion industry has particular challenges because demand is highly variable, influenced by rapidly changing trends, and the selling season is very short (Brun et al., 2008). The fashion industry also produces a wide range of complex textile products, including casual wear, outdoor clothing, intimate apparel, fashion and interior textiles, and specialist clothing such as sportswear and work wear (Lo et al., 2008). Recently, the advent of ‘fast fashion’ has exacerbated the problem for the industry. Characterized by shorter life-cycles, quicker production responses, faster distribution, more erratic customer preferences and impulsive purchasing, this business trend places significant pressure on each segment along the supply chain and creates tremendous challenges for fashion enterprises. To maintain competitiveness in the global market, fashion manufacturers need to become faster at delivering new products to clients and responding to market changes (Jacobs, 2006).
RFID technology could improve coordination between marketing and manufacturing and thus offers an attractive way to improve supply chain efficiency (Taylor et al., 2003; Zahay and Handfield, 2004). In particular, RFID enables realtime tracking of items, safe monitoring and automation of warehouse operations, which can lead to increases in sales volumes and improved profitability for suppliers and retailers (Böse and Pal, 2005; Loebbecke, 2005). Applying RFID across a business organization has a significant impact on the entire supply chain, from suppliers to retailers (Evans and Berman, 2001; Roy et al., 2004).
In the context of fashion, RFID technology has the potential to help retailers solve several key issues. First, since the product life-cycle of fashion items is very short, it is vital to ensure that the product is delivered to the store as quickly as possible. Since RFID provides the capability to track and trace items, it could streamline many activities along the supply chain. Second, fashion retailers often need space to display products of different styles, sizes and colours; consequently, managing items efficiently at retail stores (RSs) is important. An RFID-based stock management system can help employees to identify items needed by customers more quickly and accurately (Reynolds et al., 2006). Third, RFID gives each clothing item a special identifier, which can help towards preventing or at least reducing the sale of counterfeit and illegal products (Moon and Ngai, 2008). Finally, RFID tags could replace acousto-magnetic tags or RF tags for electronic article surveillance (EAS) applications (RFID Journal, 14 October 2009).
The following discussion is based on three studies we carried out on RFID application in the fashion supply chain. In the next section, we provide a preliminary, theoretical analysis of the economic case for implementing RFID in the fashion context. Using a feasibility study, we show how the logistics processes of a typical RS and DC for fashion items should be reengineered to implement RFID technology successfully, and provide a quantitative evaluation of the impact of RFID technology applied to those processes. Section 2.3 describes the main outcomes obtained from an in-field implementation, the RFID Fashion Pilot (RFP), which was conducted to confirm the theoretical findings. The findings are useful for companies operating in the RFID field itself and in the fashion industry, and provide an economic justification for adopting RFID technology in the fashion industry.
2.2 Assessing the feasibility of using RFID technology: process reengineering
In this section, we describe how the logistics processes of a typical fashion RS and DC can be reengineered to implement RFID technology successfully, and discuss the related benefits.
2.2.1 Research methodology
The results presented in this section are based on the direct examination of 11 sites belonging to companies operating in the fashion industry, including 6 DCs and 5 RSs, in a 2-echelon supply chain, and on a detailed mapping of the related processes.
Adopting the business process reengineering (BPR) approach (Hammer and Champy, 1993), the current (AS IS) supply chain processes and related performance for each site were examined. Reengineered (TO BE) scenarios were subsequently developed, hypothesizing the adoption of RFID technology and of the Electronic Product Code (EPC) system for process automation. A detailed feasibility study was performed based on the gap between current and reengineered processes (AS IS vs. TO BE).
The supply chain analyzed was defined by a panel of experts, which included 15 members from 13 fashion companies representing both Italian and international enterprises, among them Aeffe, Branded Apparel, Dolce & Gabbana Industria, Imax, Lotto Sport Italia, Miroglio and Trussardi, all of which participate in the research activities of the RFID Lab of the University of Parma. The panel members were selected from people reporting directly to the firms’ top management and covering the key business functions where RFID technology has the potential to make a significant impact, including logistics, procurement, operations and information. Panel members were involved in monthly round-table discussions, which took place at the Department of Industrial Engineering of the University of Parma between June and December 2008.
During the preliminary meetings, panel members were asked to indicate which sections of the fashion supply chain should be evaluated for the potential impact of RFID technology. It was agreed that the analysis should start at the end of the production lines at the manufacturer’s site, and should include a DC and one or more RSs. Logistics processes at the manufacturer’s site were not considered to assess the impact of RFID in this study. The choice was motivated by the fact that it would be difficult to apply tags to clothes at the manufacturer’s site, as industrial processes such as washing and ironing may be performed at this stage.
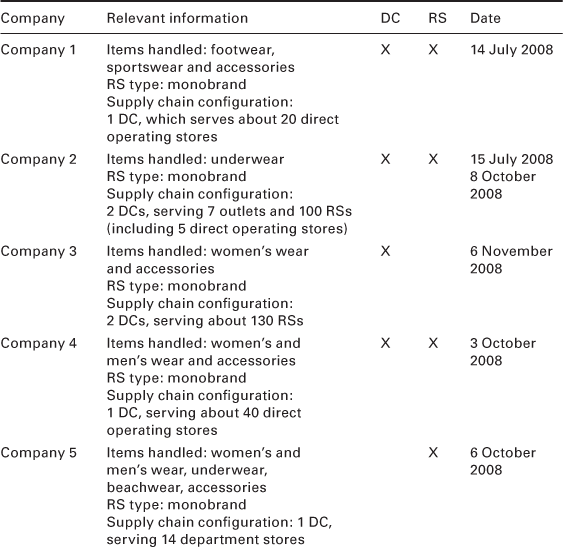
Panel members were also involved in the selection of case study sites where the internal processes could be analyzed. Seven of the companies involved agreed to be examined through site visits and direct interviews, and were invited to indicate a DC and/or a RS that would be illustrative of the company’s internal processes and suitable for direct investigation. DCs and RSs with a large flow of items, highly automated logistics processes or that had adopted advanced information systems, were preferred. Eventually, the 11 sites were identified and investigated, 6 DCs and 5 RSs. All the sites were located in Italy. Site visits and the data collection phase lasted from July to November 2008. The relevant characteristics of the sites investigated and a list of visits performed are indicated in Table 2.1 (for the purposes of confidentiality, the names of the companies involved in the research have been omitted).
Table 2.1
Summary of visits performed for data collection and main characteristics of the companies examined
The data collection phase involved questionnaires and personal interviews with the managers of the chosen sites. Two questionnaires were designed, to collect quantitative and qualitative information concerning the macro-processes characterizing the activities of the DCs and RSs, the processes examined having been suggested by the panel of experts. Specifically for the DCs, the processes investigated through the questionnaire included:
The questionnaire designed for the RS encompassed:
2. inventory management/replenishment;
5. return flows (from customers or to DCs) and shipments to other RSs.
Particular attention was paid to activities that could be automated or improved by the adoption of RFID technology. In this regard, specific questions included in the questionnaires covered the following performance parameters:
• accuracy of the processes investigated (in terms of number of errors occurring in each process);
• labour efficiency (in terms of time required to complete the process); and
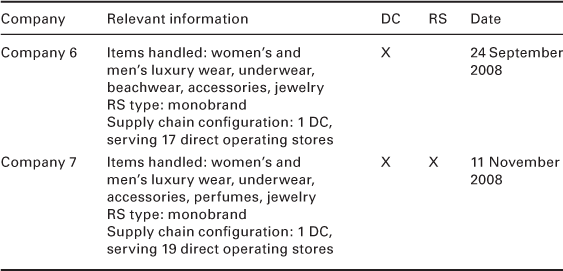
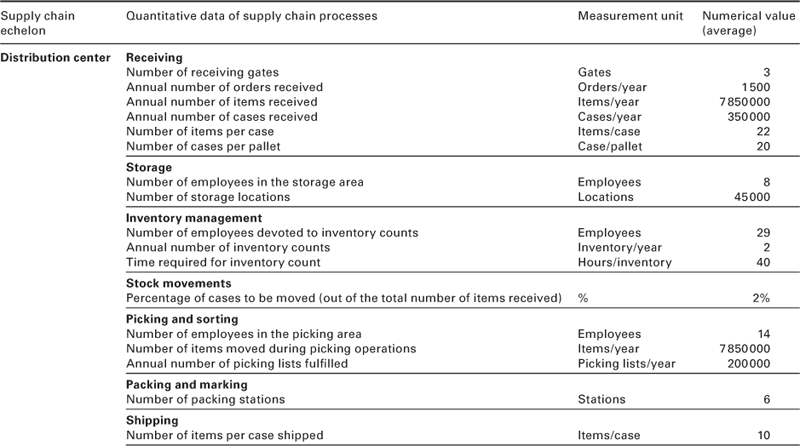
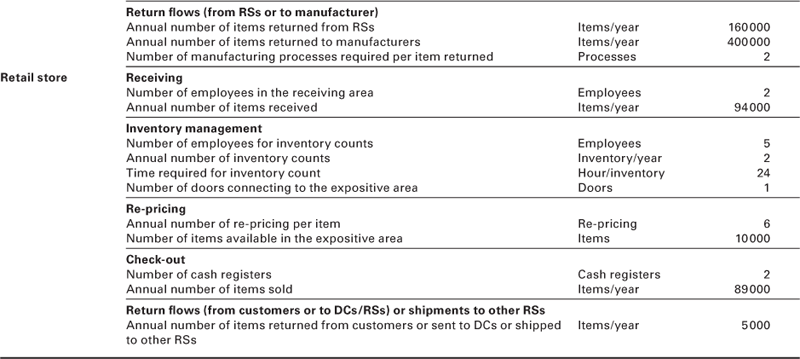
The questionnaires were completed during visits to each site. A detailed list of the average values of the quantitative parameters of supply chain processes collected during the survey phase is presented in Table 2.2.
2.2.2 AS IS analysis
The AS IS analysis examined the manufacturing and logistics processes that characterized the supply chain echelons investigated. Specifically, the aim of the analysis was to describe all of the manufacturing and logistics activities that clothing items undergo in the fashion supply chain. The results of the AS IS analysis were discussed and validated through periodic meetings with the panel of experts.
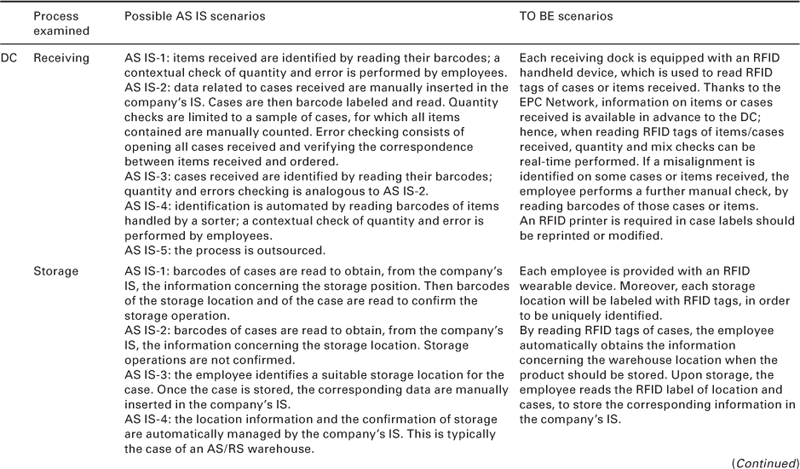
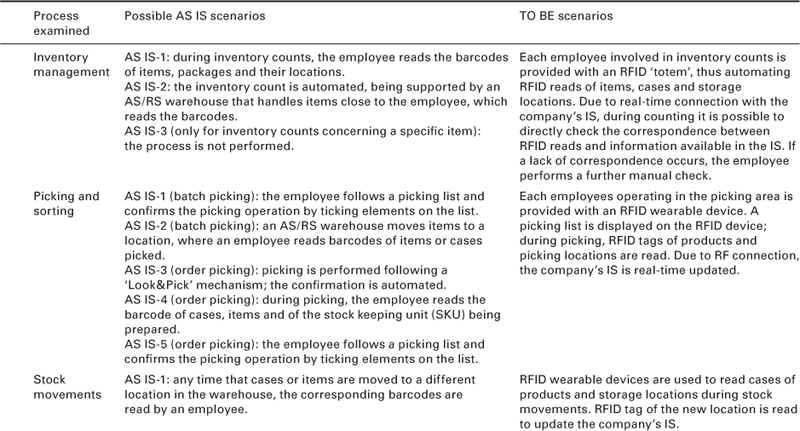
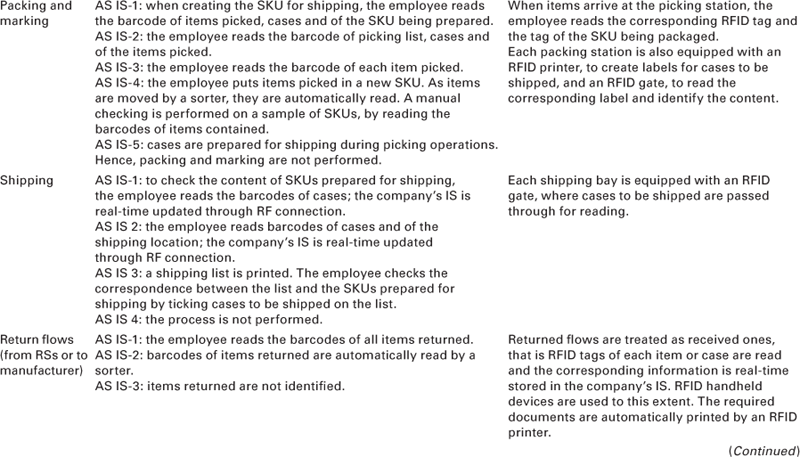
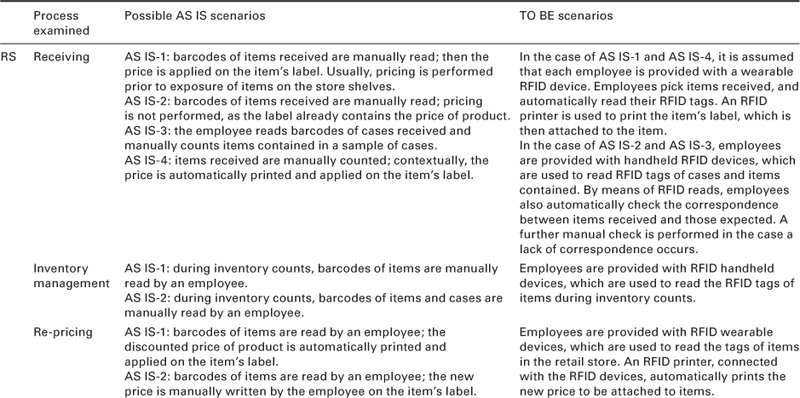
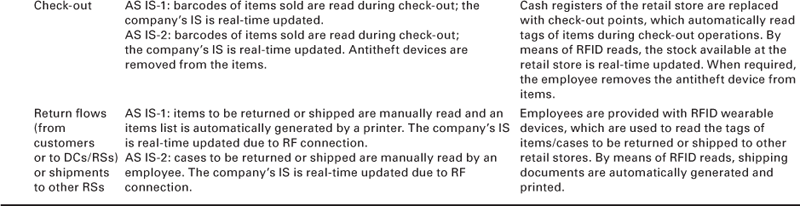
As a result of the AS IS analysis, a detailed examination of the logistics processes was derived, and it emerged that, in the case study companies analyzed, DC and RS processes could be managed in several different ways (Table 2.3). For instance, there were five possible procedures for receiving operations at the DC, ranging from manual reading of each clothing item (AS IS-1) up to fully automated reading of items handled by a sorter (AS IS-4). Depending on the AS IS scenario, the impact of RFID implementation could be different. In the case of AS IS-1, implementing RFID technology in the receiving process has the potential to substantially improve the performance of receiving operations, by removing manual reads and avoiding (or at least reducing) possible related errors; conversely where the receiving procedures are fully automated or performed efficiently (e.g. AS IS-4), introducing RFID technology would have a limited impact. Moreover, in the AS IS-5, receiving operations are outsourced; it is thus reasonable that, even if RFID is implemented in the DC, the process will still be outsourced and so there is no benefit from implementing RFID for that process.
2.2.3 TO BE reengineering
Using the results of the AS IS analysis, the TO BE reengineering developed new scenarios where RFID and EPC might optimize the processes examined. TO BE scenarios were developed to ensure:
• traceability of clothing items, and
• efficient management of manufacturing and logistics processes.
In order to be representative of real processes, the TO BE scenarios were discussed with the panel of experts, with the aim of validating the information, and operational and technological parameters of the scenarios developed. The parameters were defined for each process examined during the AS IS analysis.
The information parameters concerned pieces of information to be stored in the tag chip or EPCIS (EPC Information Services) repository (EPCglobal, 2004, 2007), as well as data to be shared between logistics processes to optimize management. The operational parameters of the TO BE scenarios encompassed the definitions of new procedures for employees, according to the BPR methodology. The technological parameters concerned the hardware and software infrastructure hypothesized for RFID deployment. Defining the hardware infrastructure required identifying tags, readers and other equipment to be used in the TO BE processes. The panel of experts suggested considering item-level tagging when designing the TO BE scenarios, as well as equipping cases and pallets (when used) with RFID tags. It was also recommended to add RFID tags to the existing barcodes of items, cases or pallets. Technological solutions were tested in the laboratory to assess their feasibility and the achievable reading performance. The resulting TO BE processes are detailed in Table 2.3.
By comparing the AS IS processes with the reengineered ones, it is immediately clear that considerable benefits can be achieved in improved automation, labour efficiency and accuracy of operations using RFID. For instance, deploying RFID at the item level in the receiving process, by reading products received through an RFID handheld device, could make this process fully automated. It also allows the correspondence between the products received and those expected to be checked, as information on items or cases received is available in advance on the EPCIS infrastructure. When a lack of correspondence occurs, the employee performs a further manual check, by reading the barcodes of cases or items. The reengineered process reduces the number of manual operations required in several receiving process AS IS scenarios (i.e. AS IS-1 to AS IS-3); conversely, as mentioned previously, no substantial benefits emerge from deploying RFID in the case of AS IS-4 and AS IS-5.
2.2.4 Cost-benefit analysis
Based on the gap between the AS IS and TO BE scenarios, a detailed analysis of costs arising (e.g. cost of manpower for additional operations required) and savings resulting from RFID implementation (e.g. removal of errors or avoidance of manual operations) was performed for each DC and RS process investigated, producing a cost/saving balance for each one. The assessment was supported by laboratory experiments, which allowed an estimate of the time required to perform both manual operations and RFID-enabled procedures on items to be derived. Experiments in the RFID lab of the University of Parma were designed to replicate such activities at full scale.
During the economic assessment, the average values of the quantitative parameters collected during the site visits and reported in Table 2.2 were used, so as to derive general results that could be considered representative of the whole fashion supply chain. The cost of investments in RFID hardware and software in the TO BE processes was also considered, with costs of equipment being obtained from available sources, namely literature, market prices, catalogues of producers and vendors of RFID equipment. The unitary tag cost was set at 0.08 € /tag, commensurate with the large number of tags purchased.
Costs and savings resulting from implementing RFID may vary depending on the specific AS IS scenario of a particular process, which means that it is not possible to provide general cost/saving outcomes for DC and RS processes. In our theoretical model, costs and savings were computed for each process as a function of the AS IS scenario. As Table 2.3 indicates, the total number of AS IS scenarios is 30 for DC and 14 for RS; such scenarios can also be combined, obtaining about 18 000 configurations for DC and 128 for RS. From a mathematical point of view, this eventually leads to 2 304 000 possible supply chain configurations. During the elaboration of the results, this number was reduced to about 1 873 920, obtained by unifying AS IS scenarios where the RFID technology has the same impact (e.g. AS IS-4 and AS IS-5 of receiving processes at the DC), and by excluding ‘unfeasible’ configurations from the analysis. For instance, AS IS-4 of storage at the DC suggests the presence of an AS/RS (automated storage and retrieval system) warehouse; this could only be combined with a similar warehouse structure in the remaining processes (e.g. AS IS-2 of picking and sorting), while other combinations are very unlikely to be found in real cases.
The economic analysis was thus performed on the resulting 1 873 920 supply chain configurations. Among them, two specific DC and RS scenarios were examined in greater detail, identified as the ‘best’ and the ‘worst’ scenarios. They respectively indicated the AS IS supply chain configurations generating the highest and the lowest cost/saving balance following RFID implementation. Investments and cost/saving balances for the ‘best’ and ‘worst’ configurations are given in Table 2.4, to provide an overview of the boundary conditions. From the table, it can be seen that some processes exhibit a negative cost/saving balance under the worst configuration; this reflects the fact that, compared with the AS IS scenario, the implementation of RFID technology requires additional costs to manage the process, while benefits are limited or nil.
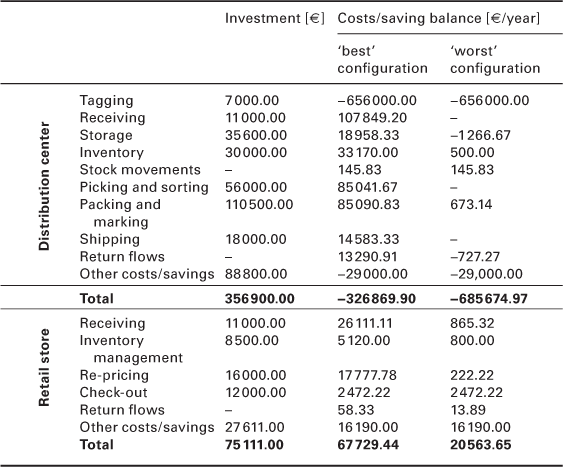
We can also see from Table 2.4 that additional processes, namely ‘tagging’ and ‘other costs/savings’, were considered in the economic analysis. The former encompasses the costs for tagging items, which involves investments in both tags purchased and the required manpower. Such costs are charged in full to the DC, while they are not considered for the RS, as it is assumed that when products are received by the RSs, they are already equipped with RFID tags. For the DC, other costs/savings mainly include costs for EPC global subscription, software integration and maintenance of the RFID system. The amounts were estimated based on commercial sources available. For RSs, besides the above cost components, other costs/savings also include benefits resulting from increased sales volume (and thus, increased turnover) as a consequence of RFID deployment.
Findings from a recent pilot project involving 280 American Apparel fashion stores showed that the implementation of RFID has the potential to improve sales volume of RSs by almost 15% (RFID Journal, 12 December 2008). However, this study lacks some information crucial to using this figure correctly; for instance, no information is available concerning the kind of shop investigated during the pilot study, or the factors causing the sale increase. Hence, trying to provide an exhaustive analysis of the turnover increase at the RS, we have examined four possible values, namely:
1. 0%, corresponding to no increase in turnover. Under some circumstances, the RFID could have no impact on the sales volume of the RS, as this depends on the specific AS IS scenario. For instance, if the inventory control at the RS is particularly efficient in the AS IS scenario, the turnover increase due to RFID would be limited.
2. 7.5%, corresponding to half the turnover increase observed in the pilot study available in the literature (referred to above).
3. and 4. 5% and 2.5%, corresponding to intermediate situations.
2.3 Assessing the feasibility of using RFID technology: profitability analysis
On the basis of cost/saving balance and investments, a detailed feasibility study was performed in order to evaluate the profitability of the RFID investment, in terms of net present value (NPV), payback period (PBP), internal rate of return (IRR) and return on investment (ROI). For computational purposes, a 5-year period and a 5% interest rate were assumed. The following selected results were derived from the economic analysis.
2.3.1 NPV of investing in RFID for the RS
The profitability for a fashion RS investing in RFID has been computed, considering all possible AS IS configurations and assuming the above-mentioned values of turnover increase. Sixty-four AS IS configurations were examined, resulting from combinations of the AS IS scenarios.
Figure 2.1 shows the NPV investing in RFID for an RS, as a function of the AS IS configurations examined and of the hypothesized value of turnover increase.
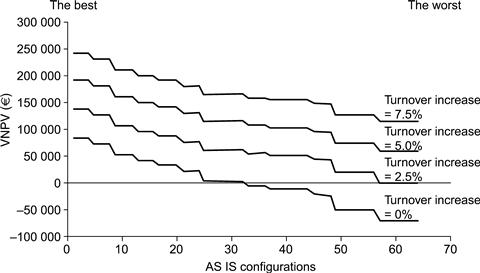
The NPV of the RFID investment exhibits a linear trend as a function of the hypothesized percentage of turnover increase, as demonstrated by the fact that the effect of different values of this parameter translates into a rise in the NPV curve. For a turnover increase of 0%, the profitability of the RFID investment depends on the AS IS configurations of the RS. Clearly, the investment is profitable (~ €80 000) under the ‘best’ RS configuration, and some 30 additional AS IS configurations exhibit a positive (or non-negative) NPV for the investment. Conversely, the RFID investment generates negative NPV under the remaining AS IS configurations.
For a turnover increase of 2.5% or higher, all AS IS configurations of the RS show a positive NPV for the RFID investment over the 5-year period. The maximum NPV accounts for about €250 000, and is obviously achieved under the best RS configuration with a turnover increase of 7.5%. Under this scenario, the NPV ranges from approximately €250 000 to €120 000 as a function of the AS IS configuration considered. The profitability of the investment decreases from €140 000 (under the best RS configuration) to about €1 700 (under the worst RS configuration) when the turnover increase is set at 2.5%.
2.3.2 NPV of the investment for a representative supply chain
The scenario for a representative supply chain is composed of a DC and several RSs, whose number could range from 5 to 50. For the DC, all possible AS IS configurations are considered while for RSs, the best configuration is assumed. As before, the turnover increase is set at 0, 2.5, 5 and 7.5%. Figure 2.2 shows the outcomes for a turnover increase of 0%.
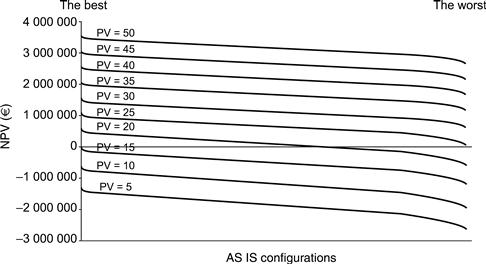
The analysis shows that economic outcomes are very different, depending on the supply chain structure examined and on the hypothesized value of turnover increase. If there is no increase in turnover (Fig. 2.2), the RFID investment generates a positive NPV when the number of RSs exceeds 25, irrespective of the AS IS configuration. This is an interesting result since, looking at Table 2.1, it can be appreciated that for 3 out of the 7 companies examined, the supply chain structure encompasses more than 25 RSs.
The achievable NPV varies substantially as a function of the number of RSs in the supply chain. A supply chain composed of 50 RSs benefits from a substantial NPV, ranging from about €3 500 000 (under the best configuration) to about €2 700 000 (under the worst configuration). Conversely, when considering fewer than 15 RSs, which is the case for one of the companies considered (Company 5), none of the AS IS configurations shows a positive NPV over the 5-year period; this result should be ascribed to the high cost of tagging incurred by the DC. For intermediate numbers of RSs, the profitability of the RFID investment depends on the specific AS IS configuration.
The number of RSs in the supply chain seems to have a significant impact on the NPV of the RFID investment; more precisely the profitability of the RFID investment becomes higher when considering increases in turnover of 2.5, 5 and 7.5%. When a 2.5% turnover increase is hypothesized, the RFID investment turns out to be always profitable if the supply chain is composed of more than 20 RSs; for turnover increases of 5 and 7.5%, it becomes profitable with more than 15 and 10 RSs, respectively. Conversely, if there are fewer than five RSs, the investment is always Unprofitable.
2.3.3 Breakeven curve (BEC) of the RFID investment
The breakeven curve has been computed as a function of unitary tag cost (€/tag) and number of RSs in the supply chain; it is derived by identifying the combination of tag cost and number of RSs which makes the NPV of the investment nil over the 5-year period. The turnover increase is set at 0, 2.5, 5 and 7.5% as before; as an example, Fig. 2.3 shows the outcomes for a turnover increase of 0%. To be consistent with the previous results, the number of RSs considered ranges from 5 to 50 and the corresponding tag cost ranges from approximately 0.01 to 0.14 €/tag.
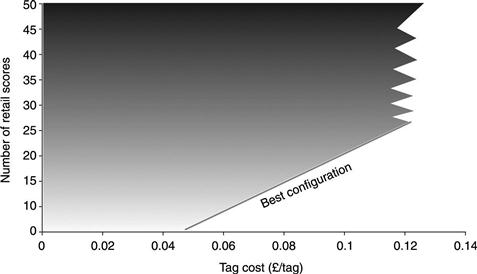
It is evident that investing in RFID is not always profitable when a turnover increase of 0% is hypothesized. Breakeven is reached under the best configuration for different values of tag cost and number of RSs. The boundaries of the BEC range from approximately 0.05 €/tag coupled with 5 RSs and 0.12 €/tag coupled with about 25 RSs. Depending on the AS IS scenario (corresponding to the internal portion of the graph), other combinations of number of RSs and tag cost allow the RFID investment to reach breakeven. Conversely, under the worst AS IS scenario, no combinations of number of RSs and tag cost allow the RFID investment to be paid back.
Results obtained when a turnover increase of 2.5% is hypothesized lead to similar conclusions. The RFID investment is again profitable under the best AS IS scenario, and the boundaries of the BEC approximate to a tag cost of 0.05 €/tag coupled with 5 RSs and 0.12 €/tag coupled with about 18 RSs. As per the previous case, under the worst configuration the RFID investment does not reach profitability for any combination of tag cost and number of RSs. Outcomes for turnover increases of 5 and 7.5% are slightly different, since the RFID investment can be reached for all AS IS configurations with a proper combination of tag cost and number of RSs.
When considering a 5% turnover increase under the best configuration, breakeven can be reached when the number of RSs ranges from 5 to 12, combined with a unitary tag cost ranging from about 0.06 €/tag to about 0.12 €/tag, respectively. Under the worst configuration, the boundaries of the BEC range from 15 to 45 RSs combined with a unitary tag cost ranging from about 0.02 €/tag to about 0.12 €/tag. For a 7.5% turnover increase under the best AS IS configuration, the boundaries of the BEC are approximately 5 to 12 RSs, combined with a unitary tag cost ranging from about 0.07 €/tag to about 0.12 €/tag, respectively. Under the worst configuration, the RFID investment reaches profitability with a minimum number of about 8RSs, coupled with a tag cost of 0.03 €/tag.
Depending on the supply chain structure, the above results also make it possible to identify the tag cost that allows the RFID investment to reach breakeven. For instance, for a supply chain composed of 25 RSs and able to obtain a 5% increase in turnover from adopting RFID, the investment is profitable if the tag cost is lower than about 0.06 €/tag, while it is not profitable if the tag cost exceeds 0.13 €/tag. For intermediate values, the profitability of the RFID investment depends on the particular AS IS configuration of the supply chain.
2.3.4 NPV, IRR, PBP and ROI of some specific case studies
The aim of this analysis is to investigate the profitability of the RFID investment under the boundary configurations (namely, the ‘best’ and the ‘worst’), with different values of turnover increase. For computational purpose, the number of RSs is set at 20. Table 2.4 shows the relevant economic indicators of investment profitability in the case of eight specific supply chains, resulting from the combination of different values of turnover increase, coupled with the best and worst configurations of DC and RS.
When considering the worst configurations of DC and RS, the RFID investment is highly unprofitable where the hypothetical increase in turnover is 5% or lower. In this situation, the supply chain experiences a relevant economic loss, ranging from about € 4.3 to 1.2 million, at the end of the 5-year period. When a higher increase in turnover is hypothesized (i.e. 7.5%), the RFID investment reaches profitability at the end of the 5-year period. In particular, the NPV of the investment accounts for about € 200 000, and the investment is paid back in 5 years.
When considering the best configurations of DC and RS, the RFID investment is always profitable over the 5-year period, and the NPV of the investment increases linearly with the percentage of turnover increase. The above results also suggest that, where the RS can benefit from a higher turnover increase (i.e. 7.5%), the RFID investment is always profitable, irrespective of the AS IS scenarios of DC and RS. In turn, this indicates that the turnover increase has a significant impact on the profitability of the investment, and should be taken into careful consideration in real cases.
2.4 Using RFID technology in practice: the RFID Fashion Pilot (RFP) project
The RFID Fashion Pilot (RFP) project was the final part of a research path started at the University of Parma RFID Lab in 2008. A group of ten companies (Benetton, Branded Apparel, Dolce & Gabbana Industria S.p.A. in partnership with DHL and TNT, Imax, Diffusione Tessile, Miroglio Fashion, Trussardi and ND Logistics) teamed up with RFID Lab academics in 2009 to start the RFP project. Although only one company provided the locations for in-field measurements and the garments (two sites of the Miroglio Fashion company), all participants shared both benefits and costs, were involved in project engineering, both from the technical and operational points of view, as well as in the experimental campaigns, and shared the resulting know-how.
A board of RFID Lab technology partners supplied state-of-the-art RFID hardware and software for the RFP project. The whole installation was fully deployed in January 2010, just in time for the 2010 spring/summer campaign. The flow of goods for spring/summer and fall/winter 2010 collections was monitored. The following garments were studied during the pilot study: jackets and coats (827 models); shirts, blouses and T-shirts (336); accessories (50); footwear and leather goods (43). Overall, 21 663 garments were tracked in the pilot supply chain, with the sites including a RS, located in a shopping district near Parma (Italy), and the corresponding supplier, a distribution centre (DC) located near Cuneo (Italy), at the worldwide logistics base of Miroglio Fashion group. Of the items monitored, 18 963 were sold. The in-field data collection for the spring/summer and fall/winter Miroglio collections started on 2 April 2010 and ended on 1 February 2011.
2.4.1 Tracking points and data collection
During the RFP project, the following processes were considered for RFID implementation:
• DC processes: packing and marking, palletizing of items, shipping; and
• RS processes: product receiving, replenishment from backroom, inventory counts, check-out.
The above processes were examined before RFID implementation (AS IS scenario) and after RFID reengineering (TO BE scenario), to assess the impact of introducing RFID technology. TO BE scenarios encompassing different RFID read points were engineered and deployed. The read points were termed ‘tracking points’, reflecting their ability to trace punctually the ‘who’, ‘where’, ‘when’, ‘why’ and ‘how’ of every item moving downstream in the supply chain. The whole deployment was based on EPCglobal standards, as well as on RFID item-level tagging, with the tag inserted in the product label. Items were tagged using EPC SGTIN product codes, and information records were captured in the EPCIS according to EPCglobal standards.
The first tracking point was located at the Miroglio Fashion DC, where individual clothing items and accessories were tagged during the packing and marking process. The price tag was printed using a converted tag, embedding an EPC Gen2 passive ultra-high frequency (UHF) RFID inlay. The price tags were applied as normal, the process being fully transparent for the operator. This process thus creates a unique association between the EPC serial and the product type, model, size, colour and price. If several items were aggregated in a case, the same association was created between the tag of the items aggregated and the tag of the case.
The second RFID tracking point was connected to the shipping process. The warehouse operator used either an RFID mobile device or a portal to cross-check every movable bin prepared for the RS in the pilot store against the list of expected items before loading it onto the truck, enabling the cases shipped by the DC to be certified.
The third RFID tracking occurred after shipping, when the products arrived at the RS, where the operator, on receiving the goods, input the bill of loading into a client terminal, and items or movable bins received at the store were thus automatically checked to make sure they corresponded with the expected delivery. This process could be performed by both the RFID handheld device and the replenishment door portal. In order to correctly input inventories, the operator needed to declare where the receiving process took place, either in the backroom or in the store. Thanks to the RFID reads, the store associate was able to punctually cross-check quantities for style/colour/size.
The fourth RFID tracking point was related to store replenishment, which consisted of restocking the items on the store shelves, and picking them from the backroom. A portal was installed in the aisle connecting the store floor with the backroom, and was equipped with four near-field antennae, in order to have a very selective reading field and avoid ghost reads. Items moved from the backroom to the store shelves were tracked when passing the RFID gate, and the corresponding inventory was moved from the backroom to the store, or vice versa, depending on the last known location of items in the store. Hence, the inventory count could provide information regarding the items available in both areas.
In the store area, four fitting rooms were equipped with RFID readers and near-field antennae, in order to be able to track what items were tried on by the customers and when. A second read point in the store area was deployed at the check-out counter. Here a fixed RFID reader read the RFID tags of items placed on the counter just before checking out. The same reader also managed a final read point deployed in a trash can, a box where the retained RFID tags of sold items were read.
RFID inventory counts were conducted regularly either in the store or in the backroom, and represented the last tracking point. A fixed RFID reader was adapted to work as a handheld device, but with a higher processing power to better handle reading large numbers of tags. Some processes typically occurred only once (e.g. tag encoding, shipping, receiving), while others could occur several times for the same item (e.g. inventory, fitting or replenishment).
2.4.2 Project results
The impact of RFID technology on the apparel supply chain can be manifold. In this section we present the many benefits that emerged from the RFP project, detailing the main numerical results obtained for every point.
Labour efficiency
An immediate benefit of RFID is the increased automation of internal processes, by enabling multiple, out-of-sight and completely automated identification of items. In the RFP project, we measured quantitatively the impact of RFID on labour productivity during the shipping process at the DC and receiving at the RS. The same savings were also assessed with respect to inventory counts.
For the shipping process at the Miroglio DC, we assessed the improvements in manpower productivity by comparing the time required for checking product cases during shipping before and after RFID implementation. In the AS IS scenario, employees used barcodes for product identification, and productivity during checks was approximately 7 to 8 barcodes checked per minute (i.e. 7–8 items/min). We found that, after RFID implementation, the time for checking decreased by 92 to 95%, resulting in a significant increase in manpower efficiency. For the receiving process in the RS, we used either the fixed RFID portal, which was also used for tracking replenishment from the backroom, or the RFID handheld devices. During receiving, we systematically measured the time required to read each movable bin using the mobile reader or the replenishment portal, and compared this value with the time needed to scan the items’ barcodes. Finally, we converted all values into productivity expressed in items/min. During the pilot study, detailed data on the reading performance of RFID were collected for both simple and hanging garments, as a function of the RFID device used for the receiving process (handheld device or receiving portal).
Manual barcode scanning recorded an average productivity of 7.35 items/min. The main factor limiting barcode productivity is that the barcode may not be visible and has to be looked for. In the TO BE scenario, a movable bin could be read without removing hangers from the z-rack 97% of times using the RFID handheld device and 95% of times using the RFID portal. With respect to the overall reading accuracy, when hanging items were received through the RFID gate, RFID correctly received 84% of the movable bins, reaching a productivity of 52 items/min. Productivity increased to 62 items/min when the handheld device was used. In the case of folded items, manual barcode productivity did not significantly differ from hanging garments. With respect to the folded items received through the RFID gate, RFID productivity reached 77.64 items/min, and RFID provided 92% complete reads of the items included in the movable bin.
Sell-in accuracy
Sell-in accuracy is paramount in order to keep accurate inventories. Wrong sell-in input can lead either to under-estimated inventories (i.e. information system inventory is lower than the real one) or, even worse, to over-estimated inventories. While the former may lead to unnecessary reorders, involving excessive holding costs, the latter could potentially lead to stock-outs, and is therefore far more critical (Hardgrave et al., 2009). During the RFP project, sell-in accuracy was evaluated through the post-processing of RFID data collected at store receiving and, in particular, by checking the correctness of the bill of loading (BoL). As already mentioned, in the AS IS receiving process, the store associates simply count the overall number of items received for every movable bin, and compare the amount with the corresponding numbers declared in the BoL.
Thanks to the deployment of RFID technology, in the TO BE process we were able to collect timely data on inbound flows received at the RS, and to compare items/quantities mix with the BoL. For each order line of BoL analyzed, we computed the resulting accuracy as the difference between the quantities in the BoL and those obtained from the RFID reads; 8 out of 46 transport documents (17%) contained errors in product quantity. The same analysis, carried out on order lines, showed that approximately 8.6% of them contained errors. It should be mentioned that, before the deployment of RFID, this issue was completely neglected by the store management, and the practice of relying on BoL data was widely accepted as not decreasing inbound productivity or inventory accuracy. Moreover, it is also important to underline that, without RFID deployment, it is difficult to detect errors in the BoL.
Inventory counts
Inventory counts are one of the principal uses driving the adoption of RFID technology in fashion and apparel. Thanks to RFID, it is possible to update physical inventories in the backroom or on the store floor and align information systems with real inventories, thus preventing stock-outs and reducing unnecessary holding costs due to inefficient replenishment.
During the project, we compared two distinct operative conditions for inventory counts:
1. A ‘slow’ (accurate) inventory count, which required 2 employees working for 30 min on average.
2. A ‘quick’ inventory count, which required an employee working for 7 min on average.
For the first option, we prioritized accuracy over productivity. We enrolled two operators: the first one holding the RFID handheld device and waving it over the items, the second one moving folded and lying garments in front of the handheld reader. This approach should have helped reduce missed reads due to tags being shielded or hidden. In the second option, we prioritized efficiency over accuracy and asked a single operator to move as fast as he could with a handheld reader and to collect as many reads as possible. We gave the operator approximately 7 minutes to complete this task.
Obviously, compared to quick inventory counts, the accurate ones are expected to reach a higher level of precision. The number of garments to be read was 4335 items. Slow counts gave an average of 4280 reads, corresponding to 98.73% accuracy and a productivity of 142 items/min. Conversely, the 3 quick inventory counts gave an average of 4168 items, corresponding to 96.16% and a productivity of 595 item/min each. By joining the 3 quick counts, we increased the accuracy to 97.83%. Finally, by joining the results of all inventory counts (i.e. 3 fast counts and the slow one), we reached a peak of 99.35% accuracy. From the figures, it is evident that the best practice for balancing accuracy and productivity is thus to encourage multiple quick inventory counts and combine the resulting RFID reads, rather than always trying to conduct accurate and slow inventory counts.
It should be stressed that, during an inventory count, it is in fact not possible to read all the ‘expected’ tags. This occurs because, for instance, items that have been stolen, while expected, cannot be read because they are not there. By cross-checking inventory data and RFID reads obtained at other tracking points, it was possible to discriminate between missed reads of items that were read somewhere else later, and missed reads of items that could not be read anymore. These latter items could have been either stolen or simply not detected by the system; whatever the reason, RFID allowed identifying some missing items, and highlighted the need for further checks. It is appropriate in this instance for an employee to verify whether the items were stolen or not detected; this could easily be done by comparing the RFID reads of this inventory count with subsequent ones.
Fitting
The RFID reader installed in the fitting rooms was equipped with a near-field antennae and put in continuous-read mode. This deployment made it possible to determine which items were selected by the customers, where those items were tried on, and how many try-ons they underwent. Before RFID deployment, such data were obviously unavailable. The analysis of the data collected indicated that 116 styles that have never been tried on were sold during the season. These styles were mainly accessories and could be considered as ‘self-selling’ items, since they did not require assistance from sales associates nor proper try-ons. Another 328 styles showed a ratio between number of sales and number of try-ons higher than 100%, meaning that more were sold than were tried on. A further 708 styles had ratios between number of sales and number of try-ons ranging from 100 to 0%. Probably such items did not fully meet the customers’ expectations. The same happened for another 60 styles, which were taken to the fitting room but remained unsold.
Turnover increase
Assessing turnover increase was a primary objective for the RFP project. Sales were compared with a control store (i.e. a store that was not deploying RFID technology) to ensure that the increase in sales volume was not determined by differences such as store policies, weather conditions or location.
Participants in the RFP project suggested that RFID helped boost sales volume by reducing the number of times customers entering the store failed to find the item they wanted (because of the lack of the right style, size or colour). A specific RFID application was designed to provide sales assistants with the information they required to answer a specific customer request. If a customer asked for a particular style in a different size or colour, the sales assistant could use a fixed RFID reader to get information on a touch screen about different sizes and colours of the item, and whether they were available in the store or in the backroom. Similarly, the sales assistant could load the unique serial number of the sample item in a RFID-enabled handheld computer, to quickly locate it in the backroom.
To assess the impact of this application on sales volume, its use was tracked during the RFP project, and cross-checked with the check-out data. The application was used 996 times, and about 144 of the items that were looked for using the application were subsequently sold. Hypothesizing that, without RFID deployment, the sales associate would be unable to find the item requested by the customer (and therefore, the sale would be lost), the use of the application generated a 0.8% increase in total sales for the store. However, not all items found can be considered as sold as a result of being found, meaning that the use of the RFID application does not directly imply that the item has been sold. Hence a correction factor was derived by correlating the moment where the sale occurs with the use of the RFID application. For instance, hypothesizing that only items sold within an hour of the interaction can be linked to the RFID application, the correction factor scores 0.66 and the estimated sales increase is 0.8 × 0.66 = 0.52%.
A second application was developed to optimize replenishment, and in particular to help store associates maintain an adequate assortment of all top-selling styles on the sales floor to counteract the problem of lost sales when popular items are not restocked quickly enough or forgotten in the backroom. Such items may end up being sold during the sales season at bargain prices instead of in season at full price. The dashboard developed showed the employees what styles, colours and sizes needed to be replenished on the store floor in real time; the application also highlighted items that were stocked in the backroom but were unavailable on the store floor. The system then tracked when the list was printed and the time when listed items were moved from the backroom to the store floor.
During the RFP, the replenishment application was used 30 times (i.e. on 30 days). On those days, sales totalled 1994 items, store associates replenished 239 items, and 221 items out of those replenished were sold. This generated an impact on sales volume of approximately 11.1%. The replenishment time should be correlated with the check-out time to identify correctly the impact of this RFID application on the sales increase. The impact of RFID on store turnover can be derived as a function of the dwell time: assuming that only items with a dwell time of a week (or less) contribute to sales volume, the increase in turnover due to RFID would be 4.91% of sales; if the dwell time is lower than 24 hours, the sales increase would be around 1%, which is still relevant to the fashion industry.
2.5 Sources of further information and advice
A complementary topic, related to efficient RFID deployment in the fashion supply chain, is the design of RFID tags specifically for fashion items. This topic focuses on the technical characteristics required of RFID technology for its successful application in the fashion context, and has been addressed by Bertolini et al. (2012). The analysis described in this chapter does not take into account the use of RFID as an anti-theft, or EAS, device. Bottani et al. (2012) explored the potential of implementing UHF Class 1 Gen 2 RFID technology to support EAS applications in the apparel supply chain. The authors analyzed the technical performance achievable using RFID technology under different theft patterns, and also the economic impact of adopting RFID for anti-theft purposes.
2.6 Acknowledgements
This chapter has been built by reprinting parts of the following publications:
• International Journal of RF Technologies: Research and Applications, 1(4), The impact of RFID technology and EPC system on logistics processes of the fashion industry supply chain, by Bottani, E., Ferretti, G., Montanari, R. and Rizzi, A., 225–52, © 2009, with permission from IOS Press.
• International Journal of RF Technologies: Research and Applications, 3(4), Experimental evaluation of business impacts of RFID in apparel and retail supply chain, by Bertolini, M., Bottani, E., Ferretti, G., Rizzi, A. and Volpi, A., 257–82, © 2011/2012, with permission from IOS Press.
2.7 References
1. Bertolini M, Bottani E, Ferretti G, Montanari R, Volpi A. Analysis of the requirements of RFID tags for efficient fashion supply chain management. International Journal of RF Technologies: Research and Applications. 2012;3(1):39–65.
2. Böse I, Pal R. Auto-ID: Managing anything, anywhere, anytime in the supply chain. Communications of the ACM. 2005;48(8):101–106.
3. Bottani E, Ferretti G, Montanari R, Rizzi A, Volpi A. Performances of RFID, acousto-magnetic and radio frequency technologies for Electronic Article Surveillance in the apparel industry in Europe: A quantitative study. International Journal of RF Technologies: Research and Applications. 2012;3(2):137–158.
4. Bruce M, Daly L, Towers N. Lean or agile A solution for Supply Chain Management in the textile and clothing industry. International Journal of Operations and Production Management. 2004;24(2):151–170.
5. Brun A, Caniato F, Caridi M, Castelli C, Miragliotta G, et al. Logistics and supply chain management in luxury fashion retail: Empirical investigation of Italian firms. International Journal of Production Economics. 2008;114:554–570.
6. Choi T. Pre-season stocking and pricing decisions for fashion retailers with multiple information updating. International Journal of Production Economics. 2007;106(1):146–170.
7. Choy KL, Chow KH, Moon KL, Zeng X, Lau HCW, et al. ARFID-case- based sample management system for fashion product development. Engineering Applications of Artificial Intelligence. 2009;22(6):882–896.
8. Christopher M, Lowson RH, Peck H. Creating agile supply chains in the fashion industry. International Journal of Retail and Distribution Management. 2004;32(8):367–376.
9. Christopher M, Towill D. An integrated model for the design of agile supply chains. International Journal of Physical Distribution & Logistics Management. 2001;31(4):235–246.
10. EPCglobal. Available from: The EPCglobal Network™: Overview of design, benefits and security 2004; http://www.epcglobalinc.org; 2004; (accessed July 2006).
11. EPCglobal. EPC Information Services (EPCIS) Version 1.0 Specification, Ratified Standard 2007; Available from: http://www.epcglobalinc.org; 2007; (accessed April 2008).
12. Evans JR, Berman B. Conceptualizing and operationalizing the business-to- business value chain. Industrial Marketing Management. 2001;30(2):135–148.
13. Hammer M, Champy C. Reengineering the Corporation. New York: Harper Business; 1993.
14. Hardgrave BC, Aloysius J, Goyal S, Spencer JG. Does RFID improve inventory accuracy? A preliminary analysis. International Journal of RF Technologies: Research and Applications. 2009;1(1):44–56.
15. Harrison A, Christopher M, van Hoek R. Creating the Agile Supply Chain London: Institute of Logistics & Transport; 1999.
16. Hines T, McGowan P. Supply chain strategies in the UK fashion industry – The rhetoric of partnership and realities of power. The International Entrepreneurship and Management Journal. 2005;1(4):519–537.
17. Jacobs D. The promise of demand chain management in fashion. Journal of Fashion Marketing and Management. 2006;10(1):84–96.
18. Lo W-S, Hong T-P, Jeng R. A framework of E-SCM multi-agent systems in the fashion industry. International Journal of Production Economics. 2008;114:594–614.
19. Loebbecke C. RFID technology and applications in the retail supply chain: The early Metro Group pilot. In: 18th Bled Conference Integration in Action. 2005:1–11.
20. Lowson RH, King R, Hunter NA. Quick Response: Managing the Supply Chain to Meet Consumer Demand Chichester: Wiley; 1999.
21. Moon KL, Ngai EWT. The adoption of RFID in fashion retailing: A business value-added framework. Industrial Management & Data Systems. 2008;108(5):596–612.
22. Nair A, Closs DJ. An examination of the impact of coordinating supply chain policies and price markdowns on short life-cycle product retail performance. International Journal of Production Economics. 2006;102(2):379–392.
23. Reynolds KE, Folse JAG, Jones MA. Search regret: Antecedents and consequences. Journal of Retailing. 2006;82(4):339–348.
24. RFID Journal. Available from: American Apparel expands RFID to additional stores 2008; http://www.rfidjournal.com/article/articleview/4510; 2008; (accessed January 2009).
25. RFID Journal. GS1 Releases Guidelines for RFID-based Electronic Article Surveillance 2009; Available from http://www.rfidjournal.com/article/pdf/5303/1/1/rfidjournal-article5303.PDF; 2009.
26. Roy S, Sivakumar K, Wilkinson IF. Innovation generation in supply chain relationships: A conceptual model and research propositions. Journal of the Academy of Marketing Science. 2004;32(1):61–79.
27. Taylor RR, Morgan RM, Morton AR. Efficient versus responsive supply chain choice: An empirical examination of influential factors. Journal of Product Innovation Management. 2003;20(6):430–443.
28. Zahay DL, Handfield RB. The role of learning and technical capabilities in predicting adoption of B2B technologies. Industrial Marketing Management. 2004;33(7):627–641.