
Measuring the impact of radio frequency identification (RFID) technologies in improving the efficiency of the textile supply chain
A. Lui and C.K.Y. Lo, The Hong Kong Polytechnic University, Hong Kong
Abstract:
The value of radio frequency identification (RFID) technology is critical for the clothing and textiles supply chain, because the fashion business is characterized by a wide assortment of seasonal items with short life-cycles, high levels of impulse-purchasing and complicated distribution and logistics operations. This study aims to test whether the adoption of the RFID system can improve supply chain performance (measured as inventory days, accounts receivable days and operating cycle). Based on the 31 clothing and textiles companies that publicly announced their RFID adoption, 18 of them were matched with comparable control firms for the testing of abnormal supply chain performance. The results show that clothing and textiles RFID adopters’ inventory days drop by about 12.89 days over the 5-year period, while other RFID adopters (other manufacturing sectors) only drop by about 2.47 days.
Key words
RFID; event study; supply chain efficiency
8.1 Introduction
Radio Frequency Identification (RFID) is an Auto-ID technology. It applies wireless radio frequencies to identify distant items from readers automatically. A RFID system usually consists of tags, readers and software for recording and analyzing information received from the readers. The tag is a microchip that is attached to a minuscule antenna. RFID was first introduced in 1948, but was not widely implemented in business operations until the 1990s (Landt, 2001). Today, RFID has become part of a commonly-adopted management system in sectors such as pharmaceuticals, logistics, fashion and retailing. Applications include assets management, payment, inventory management, customer services, production, etc. A study released by ABI Research (2010) predicted that spending on RFID products will grow at a compound annual growth rate of 15% between 2007 and 2013, becoming a US$9.7 billion industry by the end of 2013. Manufacturing sectors are rapidly adopting RFID, partly because of pressure from the major retailers such as Walmart and Marks & Spencer. These giant retailers have requested that their suppliers include RFID tags in their shipments to improve collaboration between retailer and suppliers in the supply chain.
The value of RFID technology is especially important in clothing and textiles manufacturing and retailing, because the fashion business is characterized by a wide assortment of highly seasonal products with short life-cycles, high levels of impulse-purchasing and complicated distribution and logistics operations (Moon and Ngai, 2008). In fashion and clothing retailing industries, item-based RFID implementation is an emerging trend. The RFID tagging of clothing by multinational clothing manufacturers and retailers such as American Apparel and Marks & Spencer is now in roll-out phase, with 200 million RFID labels used for clothing globally in 2009 (Das and Harrop, 2009). Clothing manufacturers are also under pressure to adopt RFID, due to mandates from giant retailers such as Walmart.
Except for a few suppliers, such as P&G, Unilever and Kimberly, which have declared benefits from adopting RFID, most suppliers still complain about high cost, unstable technology and limited benefits (Yang et al., 2008). These complaints contradict the rapid growth of the RFID market and the benefits claimed by retail giants and RFID vendors. Some scholars argue that adopting RFID might only benefit retailers (downstream supply chain members) but not manufacturers (upstream supply chain members) (Whang, 2010), and that the rapid diffusion and market growth of RFID are due largely to institutional pressure (Barratt and Choi, 2007; DiMaggio and Powell, 1983; Lai et al., 2006). Therefore, there is an urgent need to investigate and compare the true impact of RFID adoption on firm performance in different industries.
However, the impact of adopting RFID on operating performance has not yet been objectively estimated in written publications, and discussions on its impact remain unclear. Most previous studies focusing on RFID are either simply based on subjective judgments of its benefits from respondents or a few case studies focusing on a particular industry (Barratt and Choi, 2007). A thorough investigation of the longitudinal impact of RFID and comparative analysis between various industries have yet to be completed. There has only been one published RFID work based on objective financial data (Chang, 2011), with a sample size of only 65 manufacturing firms. Chang (2011) found adopting RFID improved firms’ financial performance. However, because RFID technology itself is still unstable and the accuracy of reading the RFID tags subject to a number of constraints (i.e. the packaging, the angle of the reader toward the tags, and radio frequency absorptive material such as metals on the product packaging and its nearby environment), those financial benefits may only be due to improved sales performance after adoption.
The purpose of this study is to fill these gaps by addressing three research questions:
1. Does adopting RFID technology help firms improve their supply chain efficiency measured as inventory days, accounts receivable days and operating cycle time?
2. How does the impact of adopting RFID vary across the clothing industry (wholesalers and retailers vs. manufacturers)?
3. Do clothing and textile fi rms benefit most compared to other industries? The details of the measurement of supply chain efficiency will be discussed in the following section.
8.2 Methodology
8.2.1 Data collection
This study analyses all retailing and textile-related firms listed on the US stock market. The company list was generated from Standard and Poor’s COMPUSTAT database. News articles on RFID investment announcements over the period from 1990 to 2012 were searched from periodical databases such as Factiva by using keywords such as RFID or radio frequency identification. Standard Industrial Classification (SIC) codes were used to classify the industries of the sample firms in this study. There were 520 companies in retailing industries and 83 of those companies were clothing retailers. We also included 97 companies from textile-related industries, making a total of 617 companies. Based on the standard practice of previous event studies (Corbett et al. 2005; Hendricks and Singhal, 2008), we focused on the first announcement among multiple announcements made by individual firms that adopted RFID. After screening we obtained 410 publicly listed firms that adopted RFID from 1990 to 2012.
8.2.2 Event study methodology
To investigate a firm’s abnormal operating performance following its RFID investment announcements, this study uses event-study methodology recently employed in the IT and supply chain literature (Corbett et al., 2005; Hendricks and Singhal, 2008). We followed the guidelines of Barber and Lyon (1996) for detecting abnormal operating performance. The event year (year 0) is defined as the year of RFID announcement (or successful implementation). To successfully implement RFID, the average preparation time is 6 to 12 months prior to complete operation. Therefore, year –2 is taken as the year before any RFID implementation. We are interested in comparing the operating performance before and after RFID implementation. As a result, the event period in this research is the time spanning the year of RFID implementation (year –2 to year 0) and the year of post-implementation (year 0 to year 3).
We matched sample and control pairs based on three matching criteria (pre-event performance, industry type and firm size) to minimize the effects of confounding factors in a particular industry or the effects of the overall state of the economy. Barber and Lyon (1996) suggested that matching pre-event performance is the most critical factor for event studies. They found that matching industry type and 90 to 110% pre-event performance created the most appropriate matching groups between sample and control firms. Therefore, we generated the sample-control pairs based on the following steps used by Barber and Lyon (1996). We first matched each sample firm to a portfolio of control firms based on at least a 2-digit SIC code, 90 to 110% of firm performance (e.g. inventory days) and 50 to 200% of the firm’s total assets in the 2 years prior their adopting RFID. If no control firm was matched in Step 1, we relaxed the requirement of a 2-digit SIC code to one as our matching criteria. If no control firm was matched in Step 2, we used only 90 to 110% of performance and 50 to 200% of the firm’s total assets as the matching criteria. Finally, if no comparable control firm existed after the above three steps, we chose the firm with the closest performance.
We calculated abnormal performance as the difference between sample post-event performance (i.e. actual performance in year 2) and expected performance (in year 2). We estimated expected performance as the sum of sample pre-event performance (i.e. in year − 2) and change in the median performance of control firms during that period (i.e. from year –2 to year 3). The formulas are as follows:
![]() [8.1]
[8.1]
![]() [8.2]
[8.2]
• PS – performance of sample firms;
• PC – median performance of control firms of k number of control firms;
• t – year of RFID announcement;
• a – starting year of comparison (i = − 2, –1 or 0);
We present three statistical tests that are commonly used in event studies, namely the non-parametric Wilcoxon signed-rank (WSR) and sign test and the parametric t-statistics. The three statistics in the tables show similar results. We consider WSR as the most appropriate test for our study (Barber and Lyon, 1996), and the discussion below is based on the WSR statistics.
8.3 Industry distribution of RFID adoption in North America
Among the 410 RFID announcements that we collected from the Factiva and RFID journals, Fig. 8.1 presents the number of RFID announcements among the publicly listed manufacturers in North America. It shows that Food Products (SIC code: 2000) and Chemicals (SIC: 2800) are the two industries with most RFID adoption announcements. Clothing and textiles-related industries (SIC: 2200, 2300, 3100, 5600) have 31 announcements. The distribution shows that although RFID technology could provide significant benefits to the fashion and textiles-related companies, it is still not commonly adopted in those industries. The figures need careful interpretation as the listed firms are mainly larger publicly listed firms, therefore the industry distribution of RFID adoption might not be the same for the small and medium enterprises (SMEs). Table 8.1 shows the specific number of announcements and the corresponding SIC code. Table 8.2 shows the year of distribution of the announcements and that the majority of the RFID adoption announcements came in the years 2004, 2005 and 2006. We believe that is mainly due to mandates from Walmart in 2003 requesting their top 200 suppliers to ship their products with RFID tags by the end of 2006.
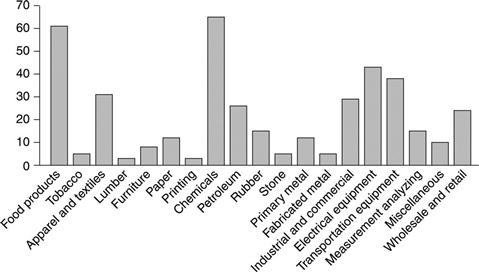
Table 8.1
| Industry | SIC (2 digit) | Sample no. |
| Food products | 2000 | 61 |
| Tobacco | 2100 | 5 |
| Apparel and textiles | 2200, 2300, 3100, 5600 | 31 |
| Lumber | 2400 | 3 |
| Furniture | 2500 | 8 |
| Paper | 2600 | 12 |
| Printing | 2700 | 3 |
| Chemicals | 2800 | 65 |
| Petroleum | 2900 | 26 |
| Rubber | 3000 | 15 |
| Stone | 3200 | 5 |
| Primary metal | 3300 | 12 |
| Fabricated metal | 3400 | 5 |
| Industrial and commercial machinery | 3500 | 29 |
| Electrical equipment | 3600 | 43 |
| Transportation equipment | 3700 | 38 |
| Measurement analyzing | 3800 | 15 |
| Miscellaneous | 3900 | 10 |
| Wholesale and retail | 5000–5900 | 24 |
| Total | 410 |
Table 8.2
| Year | Sample no. |
| 1990 | 1 |
| 1992 | 1 |
| 1994 | 1 |
| 1996 | 2 |
| 1997 | 2 |
| 1998 | 7 |
| 1999 | 2 |
| 2000 | 7 |
| 2001 | 14 |
| 2002 | 8 |
| 2003 | 24 |
| 2004 | 65 |
| 2005 | 134 |
| 2006 | 63 |
| 2007 | 42 |
| 2008 | 20 |
| 2009 | 9 |
| 2010 | 5 |
| 2011 | 2 |
| 2012 | 1 |
| Total | 410 |
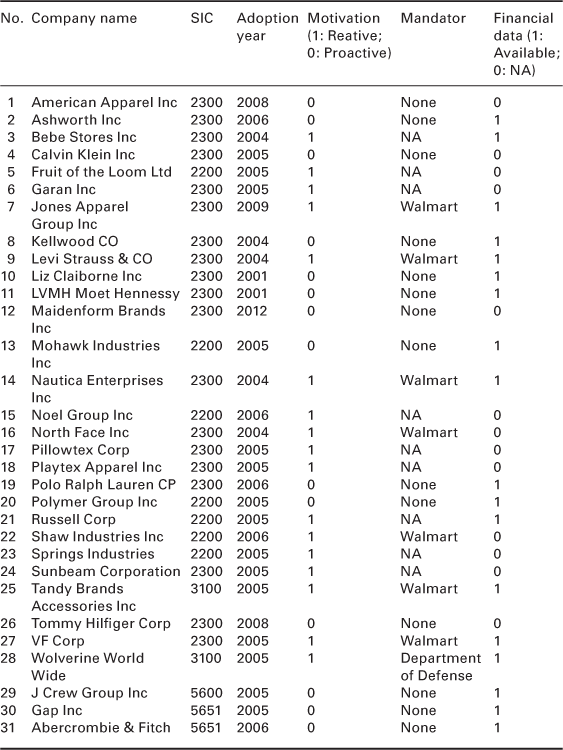
8.3.1 Details of clothing and textiles firms which have adopted RFID
Table 8.3 shows all the announcements of RFID adoption in the clothing and textiles-related companies. The table contains the industry classification code (SIC code), the motivation of the adoption stated in the announcement, and whether they were Walmart suppliers who faced pressure from adoption mandates. Some firms became publicly listed after they adopted RFID, therefore no financial data is available for longitudinal analysis (that requires financial data for the company two years prior to their adoption of RFID); we have put a remark for those records in the last column of Table 8.3. The data also shows that a number of famous fashion brands had already adopted RFID in their operations. There were 18 clothing and textile-related firms with financial data from year − 2 to year 3 of RFID adoption.
8.4 Comparison of clothing and textiles RFID adopters with other RFID adopters
Table 8.4 shows the characteristics between clothing and textiles firms adopting RFID and other firms adopting RFID. It tries to address the issue of whether more productive or profitable firms tend to adopt the technology. We compared firm characteristics, such as size, profitability, R&D intensity, etc. of the clothing and textiles RFID adopters to other RFID adopters. We found that clothing and textiles RFID adopters are significantly smaller than other firms adopting RFID. The labour productivity and R&D intensity of clothing and textiles RFID adopters are also significantly lower than other RFID adopters.
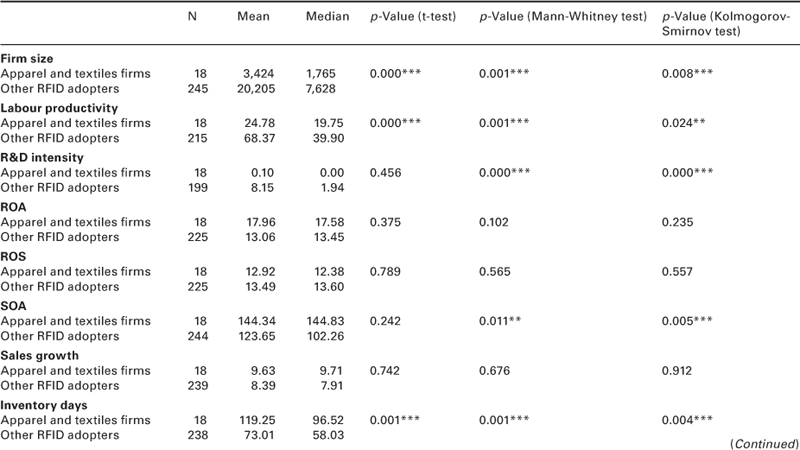
We also investigated the financial performance between clothing and textiles RFID adopters and other RFID adopters. We conducted t-tests on the return on assets (ROA), return on sales (ROS), sales over assets (SOA) and sales growth between the two sets of adopters. We only found a difference in SOA between clothing and textiles RFID adopters and other RFID adopters. Clothing and textiles RFID adopters show significantly higher SOA than other RFID adopters, which means that clothing and textiles RFID adopters can generate more revenue with the same amount of firm assets compared to other RFID adopters. However, the overall profitability (ROA) and profit margin (ROS) show no difference. Therefore, clothing and textiles RFID adopters have great potential to improve profit margin and productivity, as they are able to mark higher prices for their products compared to other industries.
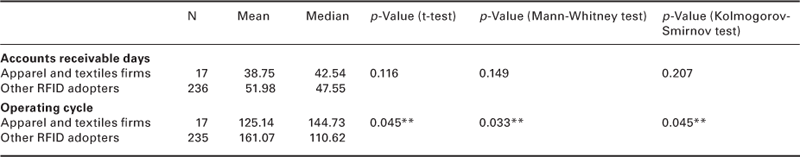
To further investigate the missing link between the higher SOA and lack of difference in ROA, we looked into the supply chain efficiency indicators. We compared inventory days, accounts receivable days and operating cycle between clothing and textiles RFID adopters and other RFID adopters. Inventory days and accounts receivable days are calculated by dividing 365 days by the inventory turnover ratio (or accounts receivable turnover) from Standard and Poor’s COMPUSTAT database. The results show that clothing and textiles RFID adopters’ median inventory days is 96.52 days, while other RFID adopters are just 58.03 days in year − 2, a difference of nearly 40 days, indicating that clothing and textiles RFID adopters have huge room for improvement in supply chain efficiency. We also compared the accounts receivables days, but saw no significant difference. Finally, the operating cycle time of clothing and textiles RFID adopters is 144.73 days, while other RFID adopters is 110.62 days, which shows that the major difference is in the inventory days. This finding suggests that if RFID can improve clothing and textiles-related firm performance, the most likely indicator would be an improvement in inventory days.
8.5 Supply chain performance differences between apparel and textiles RFID adopters and general manufacturing RFID adopters
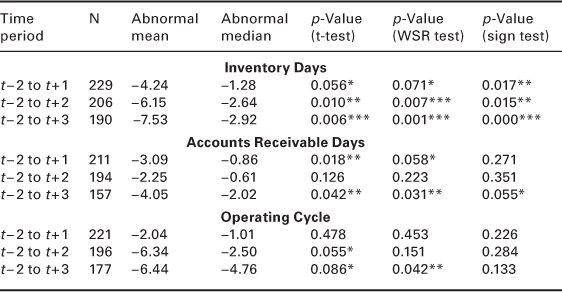
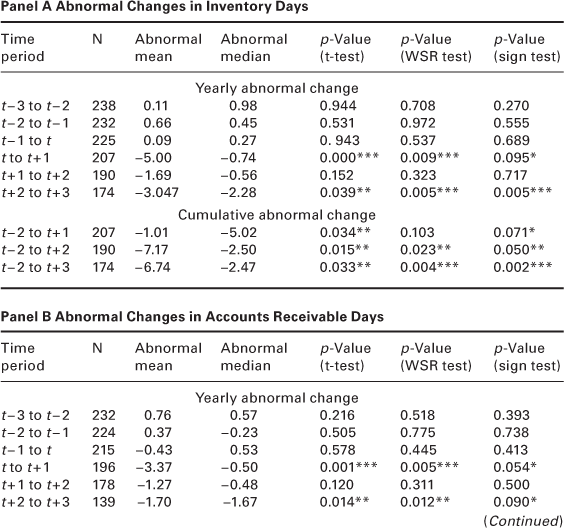
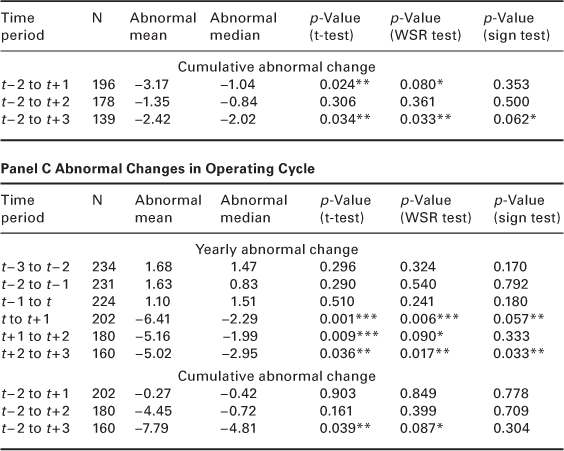
To test whether inventory days, accounts receivable days and the operating cycle of the clothing and textiles-related RFID adopters actually improved after adopting RFID, we conducted a long-term event study analysis of the firms’ supply chain efficiency indicators. We first analysed the impact on supply chain performance (e.g. inventory days) of clothing and textiles RFID adopters over a 5-year period (i.e. 2 years prior to RFID adoption and 3 years after RFID adoption). We then compared clothing and textiles RFID adopters and other RFID adopters in general. Table 8.5 presents the results of the cumulative abnormal changes in inventory days, accounts receivable days and operating cycle.
Table 8.5
Cumulative abnormal changes in inventory days, account receivable days and operating cycle

The data clearly shows that both clothing and textiles RFID adopters and other RFID adopters can improve the inventory days over the 5-year period. Clothing and textiles RFID adopters’ inventory days drop by about 12.89 days over the 5-year period, while other RFID adopters only drop by about 2.47 days. Although both groups show significant changes, the clothing and textiles RFID group has clearly shown much stronger changes over the period. The abnormal changes in accounts receivable days and operating cycle time of clothing and textiles RFID adopters are also significant in some tests, but the changes are less obvious compared to the changes in inventory days. The difference in these two indicators between clothing and textiles RFID and other RFID adopters also show that the clothing and textiles RFID adopter group experienced a much greater improvement in their operations. Tables 8.6 and 8.7 give the results of the whole sample and manufacturing firms, respectively, which consistently show firms experience improvement on supply chain performance.
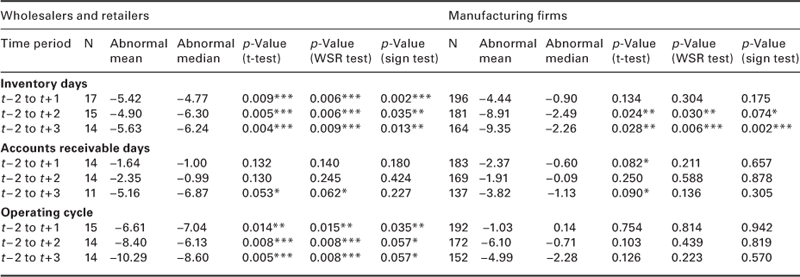
Finally, we compared the changes between wholesaler and retailer samples with the manufacturing sample. As shown in Table 8.8, although the wholesalers and retailers is a much smaller sample size, the abnormal changes in inventory days and operating cycle time are clearly statistically significant. In contrast, manufacturing firms only experienced significant changes in inventory days but not the operating cycle. This finding corroborated the discussion in the RFID literature that retailers reap more benefits than manufacturers (Whang, 2010).
8.6 Conclusion
The present long-term event study is the first attempt to provide a thorough review and quantitative evidence examining and comparing the impact of RFID adoption on supply chain efficiency across the fashion, retail and manufacturing industries. According to the data collected from 410 firms adopting RFID in the US from 1990 and 2012, RFID adoption clearly has a positive impact on the supply chain efficiency in the long term, and clothing and textiles firms in particular can benefit more in their operations than other adopters in general. The results suggest that RFID technology is a key factor to enhance competitive advantage in supply chain performance for clothing and textiles firms. These results are also important to managers in the clothing and textiles industry, as they face increasing pressures from supply chain partners to adopt RFID.
8.7 References
1. ABI Research.com. In: New York: ABI Research; 2010; RFID Market to Reach $5.35Billion this Year. vol. 2011.
2. Barber BM, Lyon JD. Detecting abnormal operating performance: The empirical power and specification of test statistics. Journal of Financial Economics. 1996;41(3):359–399.
3. Barratt M, Choi T. Mandated RFID and institutional responses: Cases of decentralized business units. Production and Operation Management. 2007;16(5):569–585.
4. Chang Y. Does RFID improve firms’ financial performance? An empirical analysis. Information Technology and Management. 2011;12(3):273–285.
5. Corbett CJ, Montes-Sancho MJ, Kirsch DA. The financial impact of ISO 9000 certification: An empirical analysis. Management Science. 2005;51(7):1046–1059.
6. Das R, Harrop P. In: IDTechEX 2009; RFID Forecasts, Players and Opportunities 2009–2019. vol. 2011.
7. DiMaggio PJ, Powell WW. The iron cage revisited: Institutional isomorphism and collective rationality in organizational fields. American Sociological Review. 1983;48(2):147–160.
8. Hendricks KB, Singhal VR. The effect of product introduction delays on operating performance. Management Science. 2008;54(5):878–892.
9. Lai K, Wong CWY, Cheng TCE. Institutional isomorphism and the adoption of information technology for supply chain management. Computers in Industry. 2006;57(1):93–98.
10. Landt J. Shrouds of Time: The History of RFID. An AIM Publication 2001.
11. Moon KL, Ngai WT. The adoption of RFID in fashion retailing: A business value-added framework. Industrial Management & Data Systems. 2008;108(5):596–612.
12. Whang S. Timing of RFID adoption in a supply chain. Management Science. 2010;56(2):343–355.
13. Yang X, Kishore R, Liu Z. The Institutional Facets of Innovation Diffusion Initiating: The Case of Wal-Mart’s RFID Campaign. In: Paper presented at the ICIS 2008 Proceedings. 2008.