Brownian models require an explosion in decision points, data points, and transfer functions. Learn how Very Large-Scale Flow (VLSF) models leverage computing technology with decision algorithms. Discover how to build Internet of Things (IoT) driven streaming data models that emphasize—nX data point multiplication, data latency, and decision latency. Focus on the four decision making capabilities—data tracking capability, cloud capability, action capability, and modeling capability.
Numbers, numbers, and numbers—The quants will rule the business: Let me repeat, the quants will rule the business. Yes, visionary leaders with great management skills will always be at the forefront of great companies. But at the tactical and operational level, decisions will increasingly be numbers-driven and strategic initiatives must leverage a quantitative decision paradigm. One may well argue that the quantitative view is nothing new—just a recycled cliché! Business school textbooks are filled with chapters on statistical analysis and quantitative modeling. Project teams across industries routinely build and integrate Excel graphs in their PowerPoint presentations and use data analytics to prove their conclusions. Many will counter that quants are already widely participating in business management and the emphasis on numbers only states the obvious. The previous chapter identified four catalysts driving the Brownian dispersion of customers: (i) An unbounded selection, (ii) crowdsourced information, (iii) end of the normal distribution, and (iv) random is the new normal. The net result of these four catalysts is that the existing quantitative view and strategy are simply insufficient to drive an efficient fulfillment process. Why? Without precise flow control, Brownian flows can quickly get chaotic, inevitably leading to fulfillment failures. The incoming data flow are fast and furious, requiring time-sensitive optimization. Most traditional decision models, though, have a planning perspective or long view and are simply not capable of handling the fast-flowing decision needs of a Brownian business. The planning view expects that good frontline managers will make immediate decisions from real-time data. But this only works when the data changes are small or infrequent. In a fulfillment environment with significant uncertainty in order flows, only a series of computerized decision models will maintain orderly flow.
A Brownian flow system will have many intersections between competing flows, and if these intersections are not efficiently controlled you are going to have a multicar pileup. The number of must control intersection points explodes as we transition from a streamlined enterprise view to a Brownian view. The exploding number of decision points requires decision and control systems to undergo an order of magnitude increase in the use of quantitative methods, data analysis, transfer functions, and decision-making models. These are the building blocks of AI, machine learning, and the digital intelligence-driven world being described by futurists. At first glance, the utility of many decisions is clear, and it would be simpler to make it a fixed parameter. But these micro decisions often have macro effects. At first glance, none of this seems any different from current practice, decision models, and optimization algorithms are widely used in business. To explain the difference, we need to first revisit the enterprise view of business and then propose the Brownian view. In classical process flow analysis, there are a series of value-adding activities or tasks, which together represent what the fulfillment process delivers to a customer. We are all familiar with what a business activity entails, but here is a generic definition:
Activity: Execution of a business task that requires resources (such as labor, materials, space, and equipment) and may involve an activity execution time. In some instances, a purely digital activity may have an execution time of zero. From a modeling perspective, an activity represents the time, effort, and resources required to move from a starting to end event.
The operational goal of a business is to manage all enterprise activities such that operational performance is optimized, and the business goal is achieved. Two identical businesses may differ considerably in how activities are described and managed, and as a result, one business could be considerably more profitable and efficient. The previous chapters proposed that fulfillment machines experience high levels of uncertainty and a Brownian view of managing activities can accelerate the process flow rates. In the context of order fulfillment, the transition from an enterprise to Brownian views will require the adoption of several physio-digital innovations. Let us compare the two views in the next sections.
The Enterprise View
The enterprise view of business is salient to the application of large-scale software systems which run 90 percent of Fortune 500 companies today. These systems have been evolving over the last three decades, and in most cases are sourced from established software companies, the most well-known of which are SAP or Oracle. Two critical technology enablers for these enterprise systems have been, first, large relational databases that provided the capability to track all transactions, and second, communication networks, which allowed users in all global locations to access the same enterprise system. An enterprise view streamlined process flows by minimizing the number of decision points, and their surrogate pain and pressure points. This allowed managers to build and implement process flow decision models that very effectively used archived data to achieve productivity and efficiency gains. Two standard elements in the modeling of process flow in the enterprise view are business objects and business processes.
Business Object (B-Objects): An identifiable entity in the business, these could be time static (Employee, Resource, Customer, and Product SKU) or transient (customer order, purchase requisition, and invoices). Objects are typically characterized by one or more attributes (Customer order—Date, Customer, and Delivery Date).
Business Process: A set of co-ordinated tasks and activities performed by one or more resources and involving one or more business objects. The process is intended to achieve a specific operational goal (on-time shipment of a customer order).
Both definitions are well-known to those involved in the design and operation of enterprise systems. The enterprise model drives higher efficiencies by standardizing business objects and processes. Several examples of large-scale enterprise view fulfillment models are household names. In the physical space, FedEx and UPS are exemplary, while in the digital space Visa and MasterCard are widely used. ERP systems are a popular and effective way of institutionalizing the enterprise view across an organization. Such systems have been the underlying software infrastructure for achieving the fulfillment productivity gains in the last 30 years.

Figure 9.1 Enterprise process flow and entities in an online customer order
To illustrate the streamlining efficiency of the enterprise view, let us consider the process flow of an online customer order for two to three items (Figure 9.1). The fulfillment business process involves three activities and three business objects are required to track the order through the process. The process can be designed with no operational decisions. After confirming the items are in stock, the order is first released to a picker/packer queue (resource-1), and then to a transport queue (resource-2). The ERP system tracks all business objects and guarantees fulfillment within the target date. It’s efficient, it’s transparent, it’s simple, and it works. Everyone wins, everyone is a hero, and there are no errors. Managers go to the SAP Sapphire convention in Orlando, drink a few margaritas, high-five other attendees, and are convinced they are at the frontier of operational excellence and technological innovation. I hate to be the iceberg alert guy, but the fulfillment machine has either already sped past you (more than likely!), or is right behind you on a highway six miles to the west (not in your rearview mirror!!). The enterprise view is yesterday’s celebrity, the cloud and AI is here, and you need to explore the risks and opportunities of the Brownian view.
Consider a system where every business object entering the system can follow any one of several paths to fulfillment. Furthermore, the business is characterized by a high degree of uncertainty in demand arrival (customer orders), deliverables (products/services), pricing and priority, and delivery points (addresses/locations). A stationary perspective is that the situation is efficiently modeled with an enterprise or planning view. A more aggressive perspective is that a Brownian view will allow the business to leverage the uncertainty into business advantage and optimize process flows. In Chapter 3, we discussed the case of Norwegian and Spirit Airlines who model each seat on each flight as a differentiated item. This allows them to create a Brownian capacity utilization model and serve shifting and highly random demand arrivals. The approach is to implement decision control of every resource and activity, thereby eliminating process flow waste by leveraging streaming data. Remember the Lean Principle78 of waste minimization, this remains valid in the Brownian flow model.
Since every business and its associated fulfillment machine and different, we do not propose here a general modeling solution. Rather we introduce modeling elements and then recommend using readily available modeling tools and skills to develop a model for your specific case. The Brownian view expects that every entering order or object is managed like a project, and every activity has a network or chain effect on fulfillment performance. The good news is that project management is an important subject in the business school curriculum, and in many engineering and computer science programs as well. Many of you are familiar with Project Evaluation and Review Technique/Critical Path Method (PEERT/CPM). Using a work breakdown structure approach, PERT/CPM creates a network flow model in which arc represents an activity. Using activity time estimates and resource availability, PERT/CPM allows a manager to create a project fulfillment schedule and make associated decisions to meet the performance goals. Typically, PERT/CPM has been used very effectively to manage a single project or a small group of projects that share activities and resources.
The Brownian view proposes that every object entering the business be managed as a project. Given the effort to manage a single project, this may sound ludicrous, the business would require an enormous amount of resources to project manage the tens of thousands of entities entering and flowing through to delivery. The solution is to develop very large-scale flow (VLSF) models that leverage computing technology with decision algorithms using immediate data. For every flowing entity, VLSF models can control a series of time-sensitive decisions. The following modeling concepts and data strategies facilitate the successful development of VLSF models.
• 100 percent Digital Models: Chapter 5 listed six innovative differentiators of an Amazon warehouse, ID#5 was High Transaction Volumes and Total Digital Control. This differentiator is a necessary condition for Brownian flow modeling and companies must be prepared to invest in the knowledge, skills, and capital equipment to design-build a 100 percent digital control model. It does not have to be a central model and could easily be a distributed architecture. Why this condition? It is not humanly possible to record and make decisions for every activity in a Brownian flow, they must be transferred to an algorithmic decision process. Digital organization and algorithms allow physical flows and arrangements to be disorganized. The digital models have an SQL-style relationship map that links the disorganized physical entities. This eliminates the underlying constraint of streamlined flows—organize and configure the operations to meet the requirements of the normal distribution customer. Today advances in computing and communication technology coupled with economic availability make 100 percent digital modeling doable, achievable, and necessary. It is the weapon of choice for most disruptors.
• Fulfillment Object (F-Objects): The end goal of each flow entering the business system or the last tracked stop or terminating node in the fulfillment flow. Example—Delivery of parcel to a customer address. This is equivalent to the points where the company’s supply chain control terminates. If a company has 1,000 customers and makes a single annual delivery to each customer, then the flow model has 1,000 F-Objects. If instead, it makes weekly deliveries, then there are 52,000 F-Objects. If each customer has on average 10 delivery locations, and now demands daily drops to each location then the fulfillment flow expands to 3,650,000 F-Objects. Create a data structure that can handle a very large number (millions) of F-Objects.
• Origin Object (O-Objects): One or more triggers that initiate the flow. Example—Customer places an online order on the website. Each O-Object is uniquely associated with an F-Object. Often multiple O-Objects will link to a single F-Object for an M:1 relationship. When the relationship is 1:1, then the O and F-Objects can be the same.
• Pinball Objects (P-Objects): Each O-Object will generate one or more physical/digital objects that flow through a series of activities and finally converge into an F-Object. In a fulfillment machine with Brownian flows, a very large number of pinballs are flowing through and being processed by a series of activities. To ensure the fulfillment objectives are achieved, the pinball-activity pair must be monitored and continuously optimized.
• Flowtime Metric: Flowtime is a common metric in process optimization and is defined as the interval between the arrival of an O-Object and the completion of the associated F-Object. Minimizing the flowtime must be a priority objective in the design-build of a fulfillment machine. A common cause of longer flow times are resource queues, but simply adding resources is a shortsighted and frequently uneconomical solution. VLSF models must use a data and decision strategy to reduce flow times. What decisions must be made and when so that queues are minimized and possibly eliminated?
A comparison of the Enterprise and Brownian view flow models provides several insights. We revisit the process flow of an online customer order for two to three items and redraw the process flow diagram in Figure 9.2. Several major differences are evident; first, the order is split into suborders for each item in the order, so that each could potentially be fulfilled from a different warehouse. Items are stored in many locations within the same warehouse, so the systems could generate unique picklists and item-bin pairs. Since an order could be split over multiple picklists, we need to direct picklists to a specific packer for shipping efficiency. Finally, there are multiple shipping options and the systems need to select a specific vehicle for the completed order package. Comparing the enterprise and Brownian views, the differences are summarized as follows:
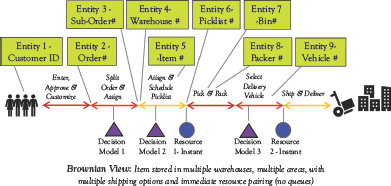
Figure 9.2 Brownian process flow of an online customer order
• The number of business objects jumps from three to nine.
• The number of controlled activities doubles from three to six.
• Three decision models are needed in the Brownian flow whereas the enterprise flow had none.
• The decision models combined with the detailed flow control eliminate queues and target instant resource pairing with pinball objects.
• Pinballs—Initially there is only one, but after the second activity there are several pinballs for each suborder.
Streaming Data Models
In the enterprise view, data are transactional. What does this mean? The database is updated whenever events related to a business object are processed. When decisions are made, models use current and historical data to predict the future. In a Brownian flow, the system status changes at a high rate, and the fulfillment performance transfer function is highly sensitive to the immediate data. Historical data become less relevant and an increasingly unreliable predictor of the immediate future. Early decision making on P-Objects can and will be suboptimal. A streaming data model focuses instead on making decisions closer to the execution point, with the expectation that this is more likely to generate optimal performance.
Order flows are often competing with each other for the same resources. Streaming data let decision models allocate resources closer to the point of use or need, and achieve faster fulfillment. In Chapter 5, we discussed the impact of the Internet of Things (IoT) on businesses and how it was being leveraged by the disruptors. IoT allows a business to stream data from all points within and outside the business. Smartphones are ubiquitous in society today and are an effective and immediate pathway for seamless tracking of endpoints in the consumer fulfillment supply chain. The advantages of a streaming data model can be measured by data and decision latency, and we define these next.
nX Data Points: How many data points, relative to a business process or activity, are being tracked. In a streaming data model, the detailed or granular view of the process or activity increases the associated datasets by severalfold or nX times. This is needed to make the many decisions for the multiple P-Objects.
Data Latency: How old are the data relative to the time when decisions are being made. Generally, decision-making models use two datasets: (i) Passive Data—Archived data that change infrequently and (ii) Active Data—Streaming data that change frequently. The active/passive data ratio is contextual to the problem or industry. In the old or enterprise, datasets are frozen much earlier, the assumption is that fresher data have very little performance value. The enterprise view active/passive data ratio is likely to be quite low.
Figure 9.3 compares the active and passive data flows between old and new view decision models. In a fulfillment machine or new view, the data latency is much shorter. Transitioning from the old view to the new view, not only do we see an nX Data multiplication but also a shift to a higher active/passive data ratio. Possibly, even the passive-new data component has a shorter latency than the active-old data. Here are four new-old view data questions for the fulfillment machine design-build team to evaluate:
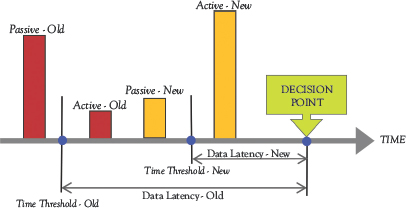
Figure 9.3 Old and new views of data latency
Data Latency Streaming Model Questions:
1. Old View: What is the current time threshold? What is tracked in the active dataset?
2. New View: What should be the target time threshold to achieve optimal data latency?
3. New View: What is the nX data required to control the Brownian flow?
4. New View: What active data are critical to achieving fast fulfillment performance?
Decision Latency: The time delay between the arrival of an O-Object and the generation of decisions that ensure timely delivery of the associated F-Object. In a fast fulfillment machine, decisions would be made immediately and the decision latency or delay is zero (Figure 9.4). Commonly, businesses will operate with either (i) negative decision latency—customers are required to submit O-Objects earlier than preferred, basically a preorder or (ii) positive decision latency—actionable decisions are made later, and F-Objects are delivered late or on time with a penalty. The optimal state is zero decision latency, providing customers with full O-Object and F-Object time freedom.
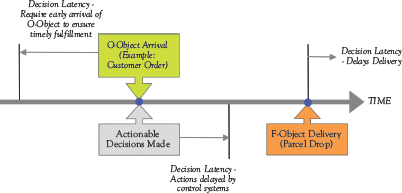
Figure 9.4 Modeling view of decision latency
Some will argue that decision latency is a business requirement, making it possible for management to plan for the optimal use of business resources. They are partially correct, but an innovative disruptor knows this and builds a competing zero decision latency process. Let’s say you have a flight this evening and would like to book a car to pick you up at 5 p.m. today. You call the local limo service and they respond that you should have booked it two days ago (negative decision latency), but that they can arrange it for a $20 premium (positive decision latency). Now let’s take the Uber view, you are ready at 4:46 p.m. and enter your order on the Uber App, decisions are made immediately, and you are matched to a driver who arrives at your doorstep at 4:58 p.m. The Uber model is designed with zero decision latency, making it impossible for a traditional taxi or limo service to just build a convenience app and match the Uber service level. Here are three decision questions for the fulfillment machine design-build team:
Decision Latency Streaming Model Questions:
1. What is the O-Object to F-Object interval or optimal flow time that represents zero decision latency? In the Uber example, the latency is a few minutes, while for a same-day delivery order it could be four to six hours.
2. What is the fulfillment value of zero decision latency to the customer?
3. What design aspects of the current resource configuration are roadblocks to zero decision latency?
To illustrate how streaming data models are already being used by innovative disruptors, we take a brief look at three examples:
Uber: A simplistic view of Uber is that it’s just an app for calling rides, and possibly in its early years that’s what it was. But today it’s a highly engineered data-driven ride-fulfillment machine. A static view of the Uber machine shows a set of ride requests and a set of available drivers. It is relatively easy to create a matching algorithm to create an optimal set of rider–driver pairs to minimize travel times. But the problem is not static, the drivers are moving, and new/free drivers are entering the space, similarly, new ride requests are continuously entering the space. Moreover, a rider may not accept a match for either price or waiting time reason, likewise a driver may also reject a match. Its classical Brownian flow, so one way to gain control is to take the view of a flowing particle.
Uber uses the Rider Session State Machine79 to link the multiple event and data streams from the rider opening the Uber app to ride completion. In lower Manhattan, there may be hundreds of sessions active at any time and they are competing for rides. The session machine allows sequential data streaming models to be efficiently activated at intersecting points in the session. To run their 100+ Petabytes data flow platform, Uber uses many tools, including Marmaray, Kafka, Hudi, and Spark. These are complicated systems requiring deep talent and technology, but they allow the Uber team to create and visualize the active data for optimal instant decision making.
Waze: Finding the shortest route from an origin location to a destination is a common problem in mathematical modeling and commonly called the network routing problem. The applicable map is converted into a weighted network graph, where arcs represent streets and nodes represent intersection points. A well-known and widely applied solution is Dijkstra’s Shortest Path First80 algorithm. In a static view, the weights represent the arc distances and the best routes can be predetermined and stored in a database. But the problem is not static and the traffic flow rate on any street is constantly changing and at each node the previous best route may no longer be valid. A key challenge is where to get the streaming data from. One source could be data partners that provide automatically sensed information, these would include smartphones of other travelers, local traffic feeds, and weather reports. A second source is manually entered data from other travelers.
Waze uses a participatory sensing system (PSS)81, whereby each traveler is a virtual sensor and periodically transmits contextual information on road conditions through a mobile interface. The PSS data stream is cleansed and validated to be useful. The route network quickly becomes a Brownian flow with every day and every instance being quite different for millions of different origin/destination pairs. Since the route can be updated, a key design issue in the data streaming model is how often data should be reassessed. Waze divides each arc into segments with mini-nodes (small intersections). The streaming data are used to estimate the time slice, or the time for a Wazer to enter and exit the slice. These data are then used to frequently update route travel times.
Ulta Beauty: Here’s an amazing statistic, the company’s Ultamate loyalty program has 33 million members.82 Wow! That is 10 percent of the U.S. population. So is this just a bunch of people who signed up for the program or is it a key part of Ulta’s growth strategy? Here’s amazing statistic number two, more than 95 percent of Ulta’s sales go through its loyalty program. The fair question is what’s the big deal with Ulta’s loyalty program? I get my haircut at Great Clips, and they have a loyalty program that gives me a free cut after 10 cuts stamped on a little card. Ulta, takes this simple activity to an advanced level, it uses a data streaming model to maximize the customer experience and dollar spend at Ulta. Ulta’s chief marketing officer states that’s the loyalty program that allows them to track all sold items back to an individual, providing the company with a deep understanding of purchasing behavior.
Ulta is leveraging technology to build an innovation ecosystem that is focused on personalization and connecting online and offline experiences to tailor its communications and help consumers navigate the beauty space. Each Ulta customer is unique and needs specific value-adding information and promotions that lead to a sale. Ulta has leveraged the loyalty program with data streaming models that provide promotional e-mails with greater product and time precision. Its Brownian precision is not mass marketing, the model predicts the most suitable mascara for Janice in the East Village, not Jane Doe in Main Street, USA. For each customer, Ulta tracks, product selection, product retention rate, sales volume, frequency of purchases, and average sales ticket for every customer. All these data are used to increase a specific customer’s store visits, the average sales per visit, and most importantly the customer satisfaction after each visit. It’s a data-driven fulfillment machine.
Building Decision Capability
You cannot design-build a Brownian decision model if you do not have the skills repository and capital resources to build the required decision capability. Brownian models are not free! If they were, we would all be FANG83 millionaires. The required decision capability is a function of the complexity of the VLSF model the business plans to build. Certainly, the required complexity of a takeout restaurant is quite different from that of a large online retailer or a 700-bed hospital. To assess the complexity and estimate the required decision capability, the design-build team should first ideate what the Brownian view of the business will be. From this initial idea, the team can estimate the modeling complexity in the following six dimensions:
• Frequency: The rate at which O-Objects arrive at the fulfillment machine and the size or content of each arriving object. Set the reference time unit (hourly, daily, weekly, etc.) appropriate for the business and then specify the mean rate for the business times. Example—A restaurant taking online orders through GrubHub expects 25 orders/hour with a mean value of $14/order.
• Variance: The variance and 80 percent percentile levels of the O-Object arrival rate and the size/scale variance. Example—The restaurant order arrival rate ranges from 15 to 38 orders/hour and the order value ranges from $11 to $18/order.
• Fulfill Locations: The number of different locations (address zones) to which the associated F-Objects are delivered. Example—The restaurant has two locations, but delivery is made by GrubHub to 30 local zones, so from the restaurant’s perspective the number of order fulfill locations is only 2. If the restaurant decides not to use GrubHub and instead takes over the delivery process then the fulfill locations would be 30. In another example, a hospital organized into 25 patient care departments, the fulfill locations would be 20.
• Entity Count: The average number of pinball entities or P-Objects that will flow through the business to fulfill an F-Object. Example—The restaurant operates in a short-order flow model and the entity count is 1/F-Object. The restaurant updates to a parallel flow model with partial batch processing of menu items in each order, the entity count jumps to 6/F-Object.
• Resource Load: The average capacity utilization rate for the top three bottleneck resources in the business process. If the loads are low, then the decision models are less stressed since flow performance is less sensitive to nonoptimal decisions.
• Flowtime Slack: The time gap between the cumulative processing time for an F-Object and the targeted flowtime. The target flow is what the team estimates are required for business success. Example—The restaurant direct order prep time is 16 minutes, and it promises GrubHub a 60-minute pickup time, the slack time then is 44 minutes. Longer slack times reduce complexity, and possibly a streamlined enterprise view can meet the fulfillment needs.
Brownian complexity increases with increasing levels of each of the previous dimensions except for flow time slack. With increasing complexity, a larger number of decision control points will be needed. Relative to an enterprise view, a VLSF model may require 20 to 100 multiplication in decision control points. Companies need to build a physio-digital system that can monitor and control all these decision points. We call this the fulfillment machine decision capability. It’s the difference between a future expectation of what can be controlled, and the ability to optimally make and execute decisions today. Decision capability is the critical component of the digital infrastructure in a physio-digital system, and the design-build team needs to prioritize this in all their activities and initiatives.
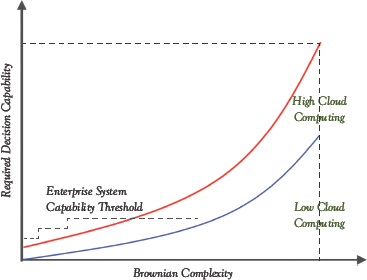
Figure 9.5 Required decision capability increases with Brownian complexity
The required decision capability increases exponentially with Brownian complexity (Figure 9.5). Initially, as complexity increases a business can upgrade its enterprise IT systems and meet the required capability. But after a few iterations, this strategy will hit a threshold and the associated resource costs and staffing needs are longer economically feasible. Cloud computing has been growing rapidly for over a decade now, and it is a necessary condition for building a complex Brownian model. Amazon Web Services (AWS) was born from the cloud computing capability the company built to support its fulfillment machine.84 Today’s innovator and disruptor are blessed, they have readily available technologies from AWS and Microsoft Azure. This provides them with efficient and immediate access to the needed cloud computing technology to build the required decision capability.
Let’s be realistic, not every business is going to require high model complexity. Nor are they going to see a steep increase in the associated decision capability. For these, a low cloud computing technology is sufficient. There is no explicit boundary but low cloud and high cloud computing. But here is an operational threshold—high cloud computing requires the company to have a significant in-house computing technology skills repository. This means the company needs to have an IT team with deep knowledge of machine learning, data-driven optimization, which implies the team includes several computer scientists with advanced Computer Science degrees. Companies and teams must determine early on whether they are looking to design-build a high or low cloud solution, and then partner with enabling vendors accordingly.
From the initial VLSF idea, the team should sketch out the needed data and decision flows. From these flows, the team should estimate four needed capabilities, and plans and initiatives to build these capabilities must be started.
1. Data Tracking Capability: The VLSF model will require constant tracking of the streaming nX data points that drive the model. Ensure that the data flow process can achieve the target time threshold and minimizes data latency. Capability must include data sourcing, action to data immediacy, and data flow to decision associated repositories. In general, you want to minimize human input dependency since that is often a critical source of data latency.
2. Cloud Capability: Significant computing infrastructure will be required, further, it will be quite different, both in size and structure, from your existing enterprise capabilities. Ensure that the databases and computing resources are configured to meet the needs of the decision models that will form the VLSF backbone. Capability must include data manipulation, access to enabling software, machine learning, and AI tools, and network access. Accessing cloud resources from one of several ready to serve vendors can enable the business to leapfrog the technology learning curve, reduce dependency on consultants, and overall reduce the capital expenditures.
3. Action Capability: Implementing a much larger number of decisions than what the business currently implements, and achieving very low decision latency, is going to require the ability to make decisions, transmit them to the decision point and execute the needed action. This is the decision-to-action chain is a necessary condition for the physio-digital innovation to succeed. Identify the actions that are likely to occur, and what capability is needed to link them to an operating environment where each action is controlled by a streaming flow of decisions engineered for a specific P-Object.
4. Decision Modeling Capability: Numbers, numbers, and numbers—VLSF models are going to be hardcore quantitative businesses, a team of skilled people who can understand the natural law mathematics that rule the physio-digital physics of the operations. Capabilities must include transfer function modeling and build skills, multidimensional querying of data, formulating performance equations that can be mathematically linked to decision optimization. Either your models must match your decision capabilities, or you need to expand your capabilities to meet the model complexity.
A good exercise is to visit the career websites of companies at the forefront of building fulfillment machines, the Amazons, Ubers, and Teslas of the world, and investigate what skill sets they are looking for in new hires. Your business needs the same skills to build the needed decision capability. Table 9.1 shows some skills collected from several openings for decision-modeling engineers at Amazon. Read the list and do an audit to confirm what skills the team has and what it needs to match the leaders. For the most part, these are hard skills requiring specific knowledge and training. They are not necessarily very sophisticated, nor do they always require advanced degrees.
Table 9.1 Skillsets of an Amazon decision sciences engineer
• Leverage the wealth of Amazon’s information to build a wide range of probabilistic models, set up experiments that ensure that we are thriving to reach global optimums and leverage Amazon’s technological infrastructure.
• Instituting processes to reduce redundancy and improve data acquisition and data quality at scale.
• Scale econometrics through Amazon and beyond by incorporating science into internal facing tools and making it easier for others to do so as well.
• Creating analytical services and products that solve business problems and drive effective decision making at scale.
• Comfort dealing with ambiguity and work backward from the customer to solve their problems.
• Track record of building either analytical OR reporting/visualization solutions using standard business intelligence tools: Tableau, PowerBI, QuickSight (Reporting); R, Python (Analysis).
We end this chapter with three examples of Brownian flows and streaming data models that integrate physio-digital innovation. For all three ideas, IoT is a prerequisite. The first (Peloton) has gone through the design-build cycle and already a proven success. The second (Healthcare) is going through the design cycle and we should see build-out in the not-sodistant future. The third (Hospitality) is just an idea, but a disruption that adds value to both guests and businesses.
Interactive Exercising (Peloton)—People all over the world enjoy exercising and they do so one of two ways, either they visit a Gym, or they make a trip to their basement where they have their treadmill/bike. Gyms have become a fast-growing business and people love going there. They are an interactive and social place, where you can get a trainer, attend classes, and be motivated to workout. The downside you need to follow the gym’s schedule and you need to go there. Could we, instead, build a digital solution that brings the gym to the home and fulfills your class requirements anywhere, anytime, and with hundreds of instructors and multiple levels of difficulty? Yes! Peloton is already doing it by live streaming workouts and on-demand classes to a special IoT exercise machine in your home. Their innovative equipment and software infrastructure give every rider, no matter what their profile, the feeling they are in a gym class of peers. A key part of the model is the built-in social-interactive competitive element delivered through a leader board. It collects streaming data of everyone in the class and provides the user with real-time feedback. Their logic models deliver targeted motivation to each customer via verbal and onscreen messages.
Hospital Patient Stay (Healthcare)—Patient care is a highly Brownian flow process. The progression of a disease, the response to medical treatment, the physical and psychological characteristics, and social support are unique for every patient entering a hospital. Hospitals, though, have a streamlined design that directs patients into treatment classified channels. A common measure for hospital performance is Length-of-Stay (LOS), and for each channel, there is a target LOS. A big challenge of hospitals is the large variety of resources a patient will access during their stay. Patients in a hospital are often waiting for test results, insurance approvals, physicians, a bed, or surgical facilities. All of this leads to delayed patient care, longer LOS, and higher costs. This fulfillment system is ripe for data streaming and Brownian modeling. It’s going to happen, and we should see transformative changes in health care within the next decade. This example also illustrates the frequent battle between enterprise solution vendors and the disruptive Cloud/App-based vendors. In a recent battle (Add CNBC Ref) between Epic (the largest hospital enterprise system in the US) and the cloud kings (Amazon, Microsoft, and Google), Epic CEO Judith Faulkner e-mailed hospital CEOs urging them to oppose proposed regulation which would make it easier to share patient data. Her key argument is that interoperability and data sharing will result in patients losing control of their confidential health information, basically, privacy issues. The counterargument is that streaming data would spawn a broad range of application programming interface (API) apps that would increase patient control, analytics-driven patient care models, and better utilization of health care resources.
Continuous Time Room Bookings (Hospitality)—The are a little over five million hotel rooms in the United States alone, and every day millions of people check-in and check-out of these rooms. The streamlined hospitality industry limits your check-in/out times, typically 3 p.m. for check-in and 11 a.m. for checkout. Why? Hotels need to clean rooms between guests and the check-in/out window allows for efficient staff scheduling. Additionally, enterprise booking systems can provide reliable room availability to customers. The reality, though, is that customer arrivals/departures are widely dispersed throughout the day and each customer has a unique travel plan. Front desks will frequently receive requests for early check-in and late check-outs and depending on loyalty status they may occasionally accommodate these requests. A Brownian model can use streaming data to project arrival/departure time behavior on a future date. An incoming booking query, with preferred arrival departure times, could be uniquely processed against these projections to provide a custom quote providing price and time ranges. Hotel management systems will also need to follow a Brownian model, with staff getting continuous time room clean instructions. Assuming there are 25 million daily booking queries, then we need very large-scale models to efficiently respond to all these queries. Enterprise models with daily room price data repositories will become a thing of the past.
The challenge for all businesses and organizations is to have their innovation lookout teams constantly surveying the technology landscape, and identify how the disruptors are using modeling and optimization ideas to achieve process innovation. Ideas are not trends, they are precision interventions, which means magazines and advisery consultant are only going to give you latent information. Extend the innovation lookout teams to your existing employees. Employee of the Month programs have outlived their utility, and we need to transition to an Idea of the Month culture culminating with the Annual Grand Slam Idea.
Chapter Summary
• The incoming data in Brownian flows are fast and furious. The exploding number of decision points requires decision and control systems to undergo an order of magnitude increase in the use of quantitative methods, data analysis, transfer functions, and decision-making models.
• A Brownian view leverages uncertainty into a business advantage. Very large-scale flow (VLSF) models control every resource and activity. VLSF modeling concepts and data strategies were presented.
• Introduced streaming data models that make decisions closer to the execution point. Data and decision latency are defined.
• Six dimensions by which the design-build measures model complexity is defined: Frequency, variance, fulfill locations, entity count, resource load, and flow time slack.
• The required decision capability increases with complexity. Four capabilities are needed: data tracking, cloud, action, and decision modeling.