
Creating a new Catalyst project
Using the Selection, Direct Select, Hand, and Zoom tools
Using the Drawing tools
Using the Transform tool
Understanding layers
Working with blend modes
Adding wireframe components
Running a project
Saving a project
Catalyst provides a few basic drawing tools. These are not designed to provide you with a complete drawing application; rather, they allow you to wireframe an application.
Wireframing is the process of visually laying out the basic framework of your application. In Catalyst, you can draw shapes and add common Flex components such as buttons and datagrids — features that the other Adobe design tools may lack.
The wireframe tools allow you to create an initial visual representation of your application. From there, you can move to Illustrator, Photoshop, or Fireworks to finalize the design before returning to Catalyst to create the actual project.
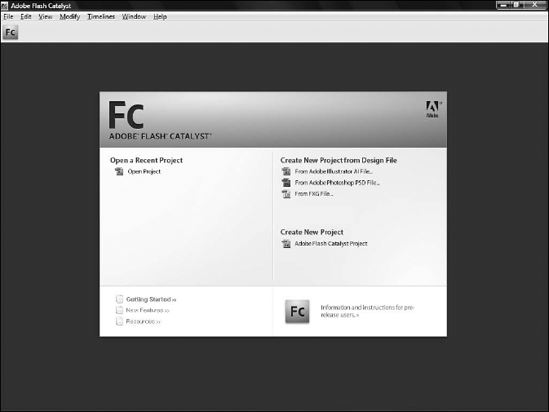
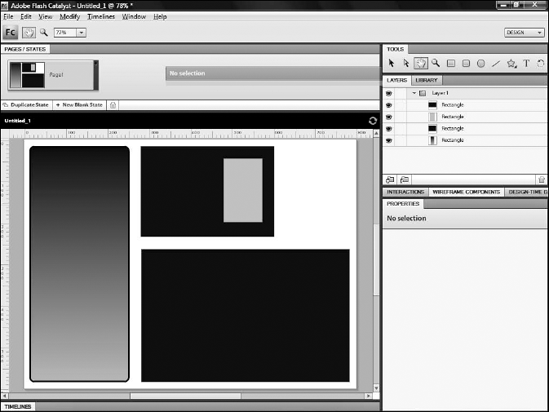
When you first launch Catalyst, you are presented with the Start screen (see Figure 4.1). If you want to wireframe your application, follow these steps:
Select the Create New Project option in the lower-right corner. A dialog box appears.
In this dialog box, give the project a name (see Figure 4.2). This will eventually be the name of the FXP file that Catalyst creates for the project, so be sure that it is a memorable name.
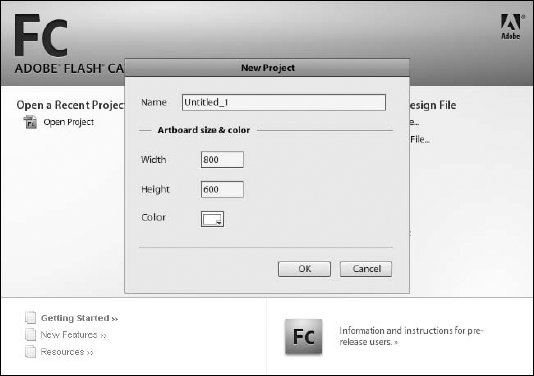
You can also set the size of the artboard. The artboard determines the size of your project. All Catalyst projects use a fixed size. If you want to have your project scale to your user's browser window or screen size, you need to manually alter the application's settings in Flash Builder. You cannot choose to create a scalable project in Catalyst.
You can also set the background color of the project by clicking the Color Picker and selecting a color. The Catalyst Color Picker differs from those in other tools. You can either select from one of 40 preset swatches, or pick any color you want by selecting a base color from the spectrum and then setting the tint of that color.
To create a new Catalyst project, follow these steps:
From the Start screen, click Adobe Flash Catalyst Project.
Type a name for your project.
If desired, set a width and height for the project.
If desired, click the Color Picker and select a background color.
Click OK.
The first four tools in the Tools panel allow you to select objects and navigate within your project.
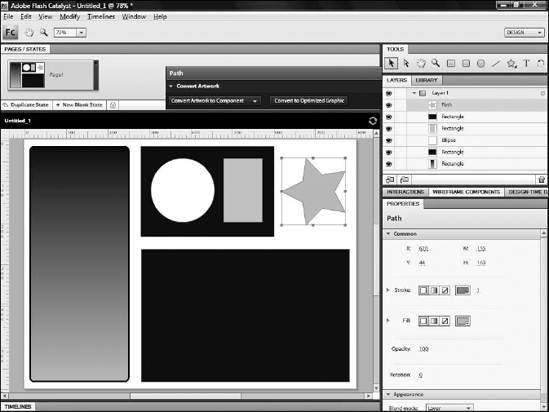
The first tool on the panel, whose icon is a black arrow, is the Selection tool (see Figure 4.3). Use this tool to select objects on the stage so that you can modify their properties and to move objects on the artboard.
The white arrow to its right is the Direct Select tool. This tool does not do anything different from the Selection tool when dealing with shapes you draw directly in Catalyst; its primary purpose is to allow you to select items within a group.
Note
For more information on using groups, see the section Grouping Objects.
The Hand tool lets you move the artboard on your screen. This tool does not move or select objects on the artboard as the Selection tool does; it simply repositions the artboard. The tool's usefulness becomes apparent once you zoom in on your project and need to view a different section of the artboard without first zooming out (see Figure 4.4).
The Zoom tool lets you zoom in and out to either get a more detailed look at small objects or to view your entire project. You can zoom in to get a closer look by simply selecting the tool and clicking a spot on the artboard. Press and hold the Alt (Option) key to zoom back out. You can zoom in to 1000 percent and out to 25 percent.
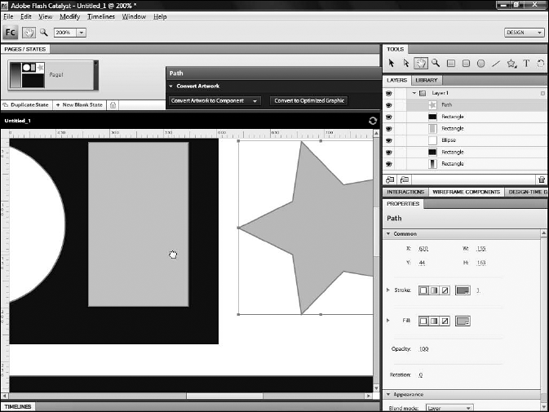
Figure 4.4. The artboard has been zoomed to a magnification of 200 percent, and the Hand tool is being used to move to a different part of the artboard.
Catalyst Shortcuts
Photoshop and Illustrator users will be familiar with those programs' tool selection shortcuts and happy to find that the same shortcuts exist in Catalyst. With any tool selected, press and hold the Ctrl (
Most tools also have single-key selectors. Catalyst again uses the shortcuts with which Photoshop and Illustrator users are familiar. Press V at any time to get the Selection, or letter M to get the Rectangle tool. These shortcuts appear in the tooltips when you mouse over the tool on the Tools panel. Note that some tools, such as the Rounded Rectangle and the various polygons, do not have these shortcuts.
The Catalyst Tools panel includes eight drawing tools that allow you to draw rectangles, rounded rectangles, ellipses, lines, triangles, hexagons, octagons, and stars. A Text tool is also available.
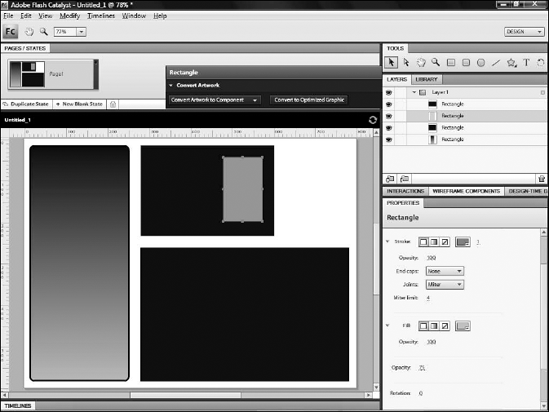
You can draw simple rectangles using the Rectangle tool. As with other applications, you simply click the tool, then click and drag on the artboard to create a rectangle. Once you've drawn them, you can modify the rectangles using the Properties panel.
Rectangles with rounded corners can be drawn using the Rounded Rectangle tool (see Figure 4.5). Press and hold the Shift key while you drag with the mouse to create a perfect square using either tool.
Tip
The values on the Properties panel such as the X and Y position, or the width and height, can be adjusted by clicking and typing a new value or by scrubbing the value. To scrub a value, simply click and drag. Dragging to the left decreases the value; dragging to the right increases it.
Note
The 0,0 point on the artboard in Catalyst, as in other Adobe design tools, is the top-left corner. X values count left to right, while Y values count top to bottom. A negative X value moves the object off the artboard to the left, while a negative Y value moves it above the artboard.
To create a new rectangle, follow these steps:
Click the Rectangle tool.
Click and drag on the artboard to draw a rectangle.
On the Properties panel, click and drag to scrub the X or Y value to move the rectangle on the artboard.
Click on the width property's value and type a new value.
Press Tab to move to the height property and type a new value.
Each object you draw can have a stroke and a fill. Strokes are the outlines around objects, while fills place colors within it. Either strokes or fills can use solid colors or gradients. You can also set either the stroke or the fill to nothing.
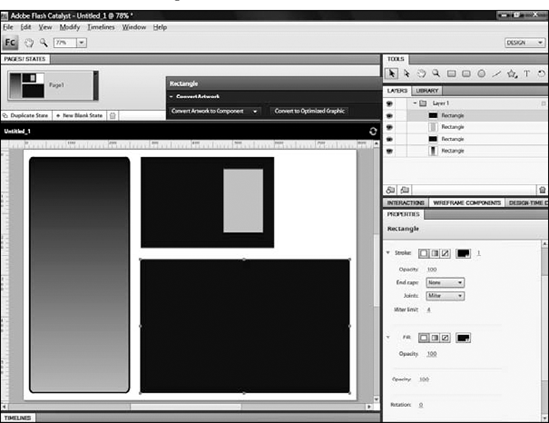
On the Properties panel (see Figure 4.6), you will see three small boxes to the right of Stroke. The first sets the stroke to a solid color, the second a gradient, and the third removes it altogether.
A color picker appears to the right of these buttons when you select the solid-stroke option. Just as with the project's background color, this Color Picker (see Figure 4.7) presents 40 preset swatches and a spectrum from which you can select any other color. You can also enter a hexadecimal value for the color.
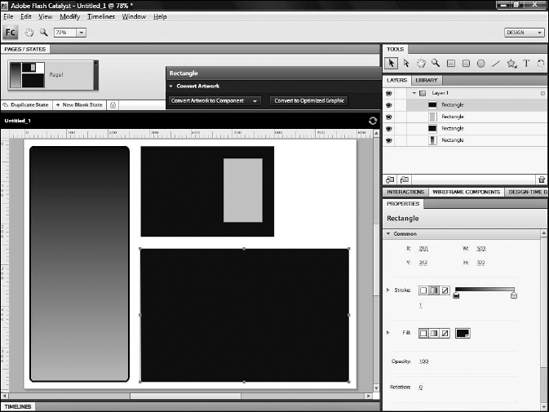
When you select the gradient stroke, you see a gradient map, which allows you to customize the gradient (see Figure 4.8). Color stops appear at either end just below the map. You can click on the colored square on the stop to change its color.
Dragging the stop sets its position within the gradient. You can add additional colors to the gradient by clicking the area below the map to add a new color stop. Drag a color stop away from the map to remove it.
When you select a solid color, a small number appears to the right of the Color Picker. Scrubbing this number allows you to create a thicker stroke. The stroke-width setting moves below the stroke buttons when you use a gradient.
Additional settings for stroke are available by clicking the Stroke drop-down menu. From here, you can set the stroke's opacity, creating a transparent stroke on an otherwise opaque shape. The End caps settings have no effect on rectangles and are only used for lines. The Joints setting has three options:
Round
Bevel
Miter
Round creates slightly rounded corners on the rectangle, in essence converting it to a rounded rectangle. Bevel creates hard diagonal corners, while Miter, the default, creates square corners. The Miter limit setting determines the appearance of a stroke at its joins. It will only be visible if you draw a star or triangle, set a very thick stroke, and then a very low miter limit. The setting primarily exists to allow you to alter a miter limit on artwork imported from Illustrator.
You can set fills in the same manner as strokes. You can use solid colors or gradients and create gradients using the same techniques as outlined previously for strokes. Only one additional setting is available when you click the triangle next to Fill: Opacity.
Below the Fill setting is another opacity property. Strokes and fills can have opacity set individually. If you want instead to have one opacity setting for the entire object, set it here (see Figure 4.9). Note that opacity settings are cumulative, so if you set stroke opacity and fill opacity individually and then modify the main-shape opacity, the fill and stroke become more transparent.
The Rotation setting, directly below Opacity, lets you rotate objects by scrubbing its value or typing a value of your own. Modifying the Corners property controls the roundedness of the corners of the rectangle.
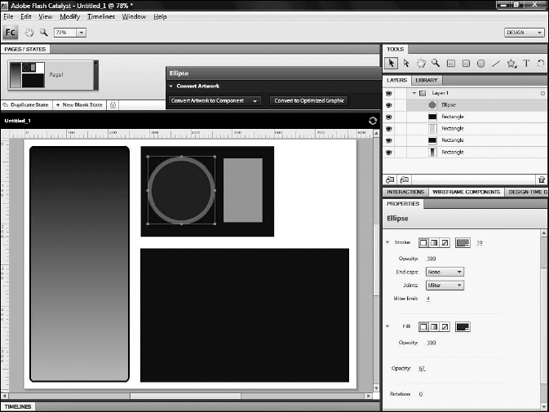
You can draw either ellipses or circles with the Ellipse tool. As with the rectangle tools, you click the Ellipse tool and then click and drag to draw the shape. Press and hold the Shift key to draw a perfect circle.
Tip
All shapes are surrounded by a rectangular bounding box. When you click and drag to draw any shape other than a rectangle, you are technically drawing the bounding box, which then contains the shape. Therefore, when drawing ellipses or circles, you need to imagine a spot outside the circle — the corner of the bounding box — as your starting point.
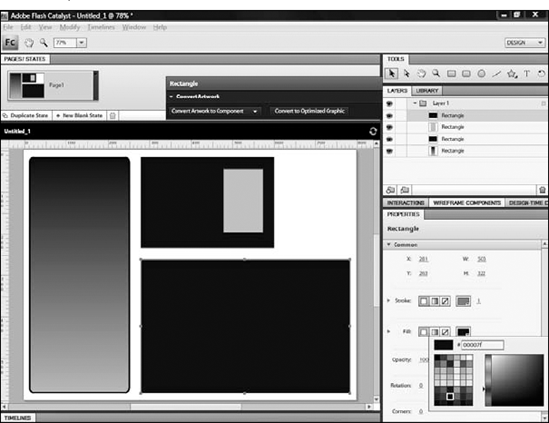
The Properties panel displays most of the same settings for ellipses and circles as it does for rectangles. Therefore, you can set solid or gradient strokes and fills, as shown in Figure 4.10.
While the End caps, Joint, and Miter limit settings are still available when drawing ellipses, they do not have any effect on the shape and can be ignored. As with rectangles, you can set opacity for strokes, fills, or the entire shape. You can also set a rotation for ellipses.
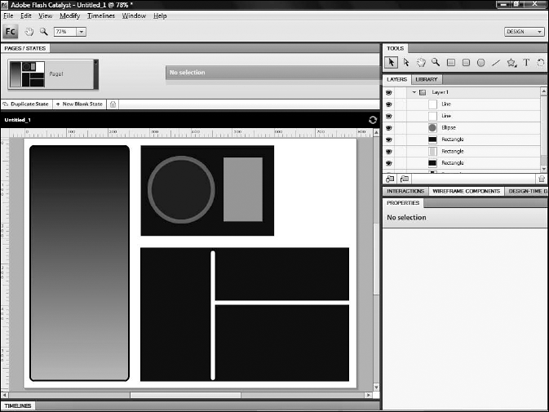
You can draw lines using the Line tool. You can create lines at any angle, but holding the Shift key while you drag constrains the line to 45-degree increments.
Lines do not have fills, so you will notice that only the stroke settings are available. As with other shapes, the stroke can be a solid color or a gradient. The End caps setting changes the ends of the line to round or square (see Figure 4.11). Selecting None for the End caps removes them from the line, in effect making it slightly shorter. Neither the Joints nor Miter limit have any effect on lines.
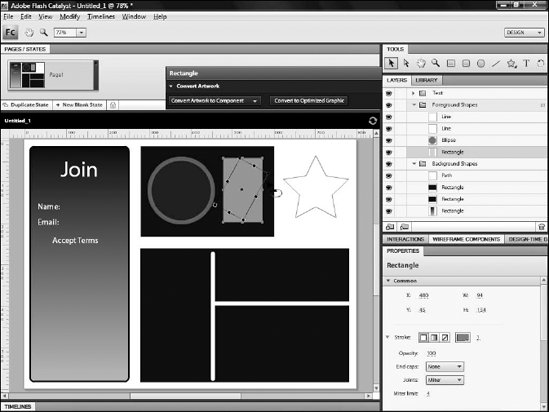
The remaining shape tools share a space on the Tools panel to the right of the Line tool. The default tool is the Triangle, but you can click and hold your mouse on the tool to see a menu of other shapes such as Hexagon, Octagon, and Star (as shown in Figure 4.12). All four tools have the same setting options.
Like other shapes, you can set strokes and fills and adjust opacity. On the stroke, the End caps and Miter limit have no effect. Rounded joints round off the sharp edges on corners; you can further round the joints by adjusting the Corners setting.

Add text to your project with the Text tool. Click on the artboard and type to create a text box. After you finish typing, you can switch to the Selection tool and select the text frame to access the Properties panel for the text (see Figure 4.13).
From here, you can select a font, scrub, or type to set the font size, set a color, and make the text bold or italic. Note that Flash and Flex projects use embedded fonts. Therefore, you are free to select any font on your system to use in your project. At the bottom of the Properties panel are settings to add Strikethrough and underlining to your text.
In HTML, you should not underline text on your page, as this text will likely be confused with a hyperlink. The same theory should keep you from underlining text merely for emphasis in Catalyst. Hyperlinked text in Catalyst will not automatically become underlined; therefore, it can be useful to inform the user that a particular block of text is a hyperlink.

The Transform tool allows you to rotate shapes. You can select a shape on the artboard and click and drag either directly on one of the corner handles or anywhere outside the shape to rotate it, as shown in Figure 4.14.
The point around which the shape rotates is by default its center. However, you can use the Transform tool to move this point to any other location on the artboard, even if that location is outside the shape, as shown in Figure 4.15. Rotating the shape after you have repositioned this point will cause it to rotate around the new axis.
Like other design tools, Catalyst organizes the various objects on its artboard with layers. You can think of using layers as similar to drawing a picture using sheets of clear plastic, rather than drawing on a piece of paper. If you draw each piece of the picture on a new sheet of plastic, you can stack them together and view it as a single image or take the individual sheets and manipulate them without affecting the others. You can also rearrange the sheets, thus controlling which elements appear above or below other elements.
Catalyst layers most closely resemble those in Illustrator. In both programs, each layer is merely a container, with each item drawn on the layer placed into a new sublayer. Each time you draw a new object in Catalyst, it is automatically placed on a new sublayer within the currently selected layer. Each new object's sublayer is placed above the prior layer, so the most recent addition is on the topmost layer.
Note
The Rounded Rectangle tool is nothing more than the Rectangle tool with a preset value on the Corners property. Therefore, when you draw a rounded rectangle, the sublayer is still called Rectangle.

Sublayers are automatically named based on the shape you draw, so drawing a rectangle creates a sublayer called Rectangle, while drawing a circle creates a sublayer called Ellipse (see Figure 4.16).
This automatic naming of sublayers is in some ways nicer than the method employed by other design tools such as Photoshop, which simply names each layer Layer1, Layer 2, and so forth. You do need to note that in Catalyst you can have multiple sublayers with the same name, so if you draw two rectangles, the result is two Rectangle sublayers.
Because a normal project contains many, many layers and sublayers, you should get in the habit of renaming layers. Here again, the Catalyst team consciously mimicked the process from the other design tools. You can simply double-click the existing layer name and then type a new, more descriptive name.

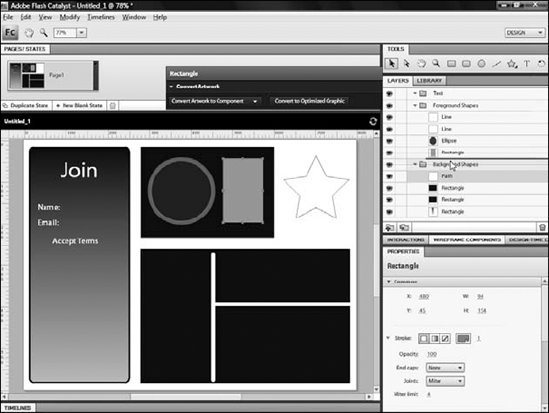
Figure 4.16. The Layers panel in a Catalyst project. Layers have been logically named, and some of the sublayers are visible.
You can further help keep yourself organized by creating new layers, so that all of your objects do not end up in one massive layer. To create a new layer, follow these steps:
Click the layer above which you want to create a new layer.
Click the Create New Layer button at the bottom of the panel.
Double-click the new layer and rename it.
Note
Because layers hold zero or more sublayers, Catalyst depicts layers with a folder icon.
You can change the stacking order of layers and sublayers by simply dragging them up or down in the Layers panel, as shown in Figure 14.17.
Sublayers can be moved from one layer to another by dragging them below the desired layer, as shown in Figure 14.18.

Blend modes allow you to control how pixels on one layer interact with those on the layer or layers below it. Blend modes are common throughout the Creative Suite. In addition to being available in Photoshop, Illustrator, and Fireworks, they are also present in Flash Professional, InDesign, Premiere Pro, After Effects, and now Catalyst. The exact list of blend modes varies from one product to the next.
Catalyst does not have nearly as many blend modes as Photoshop, but all of the most commonly used modes are available. Blend modes are available in a drop-down list on the Properties panel when a shape is selected. With almost all shapes, it is the last or next-to-last option on the panel.
When you have an object on a layer whose pixels overlap those of an object on a lower layer, the upper object normally obscures the lower. You can make the lower object appear by decreasing the opacity of the upper object, but this merely allows you to see through the top object. Many times, what you actually need is to blend the top pixels with the lower pixels (see Figure 4.19).
Tip
The blend modes available in Catalyst are the same as those found in Flash Professional, as those are the modes supported by Flash Player.
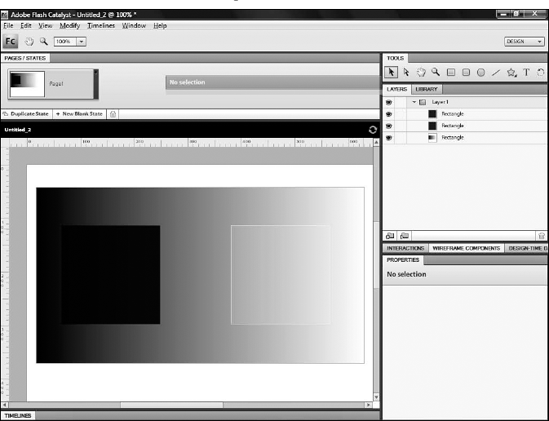
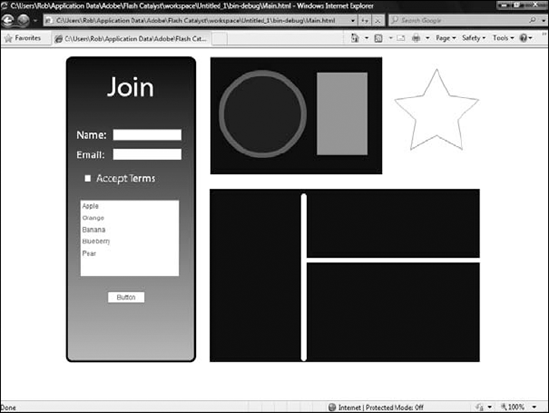
Figure 4.19. The shapes shown here have been blended. On the left, the top layer is using the Multiply blend mode, while Screen has been used on the right.
The most-used and most useful blend modes are Multiply and Screen. When you blend with Multiply, you are mixing the darkest pixels of the upper layer with the darkest pixels of the layers below. Therefore, if you take a black shape and attempt to blend with Multiply nothing appears to happen, as you have only very dark pixels.
Conversely, a white object will seem to disappear, as there are no dark pixels available, so only the dark pixels below — which would be any pixel, as everything is darker than white — will show through. However, take a shape with any other color fill, and you will see the blending. Multiply therefore makes the shapes darker through the blend.
Note
Color values on computers are expressed numerically. The Multiply blend mode is so named because you are performing multiplication: The color values of the top layer are multiplied by the values of the lower layers. The same is true with the Difference, Add, and Subtract modes: Each result in the mathematical operation is described by its name.
Screen is the opposite of Multiply. The lightest pixels of the top layer blend with the light pixels of the layer or layers below. Thus, a black shape blended with Screen seems to disappear as there are no light pixels, while nothing seems to happen with a white shape. Any colors in between will blend, with the result being something lighter than before.
Table 4.1 lists all of the blend modes available in Catalyst.
Table 4.1. The Catalyst Blend Modes
Mode | Result |
|---|---|
Normal | No blending occurs. |
Layer | No blending occurs; in practice, Normal and Layer do the same thing. |
Multiply | Dark pixels from the layer being blended mix with the darker pixels in the lower layers. No part of the blended layers gets lighter when using Multiply. |
Screen | Light pixels from the layer being blended mix with the lighter pixels in the lower layers. The mode actually multiplies the inverse values of the colors to result in a lightening of the image. No part of the blended layers will get darker when using Screen. |
Darken | Each of the pixels with the blended layer is compared to the pixel directly beneath, and the darker of the two remains. |
Lighten | The opposite of Darker; the lighter of each set of pixels is retained. |
Difference | Difference divides the color values of the blended layer from those of the layers below. Large differences between the colors result in lighter colors, while small differences result in dark colors. Any pixels with the same value become black. The mode generally results in something that resembles a negative from film, although a true negative effect is available with the Invert mode (see below). |
The color values of the pixels of the blending layer are added to those of the layers below. The effect is often very similar and at times indistinguishable from Lighten. | |
Subtract | The color values of the pixels are subtracted from one another. The result is usually similar to Difference, but some variations in the resulting colors are evident. |
Invert | Each of the lower layer's pixels is inversed, resulting in a film negative effect. |
Alpha | The blended layer's alpha value, which defines its transparency value, is used to determine its appearance. Flex developers using ActionScript 3 can use this blend mode to create interesting effects, but as you do not have direct access to ActionScript in Catalyst, it is of little use other than to preset it for the developer. The result in Catalyst will always be that the object being blended becomes invisible. |
Erase | Like Alpha, this has little use in Catalyst. ActionScript 3 developers can use this blend mode to erase the pixels of the background layer, but in Catalyst it has the same effect as Alpha: the object being blended becomes transparent. |
Overlay | Each pixel is adjusted based on the color value of the lower layer. If the lower layer is lighter than 50 percent gray, the pixels are screened. If the lower layer is darker than 50 percent gray, the pixels are multiplied. |
Hard Light | Hard light multiplies the dark colors and screens the light colors, very much like Overlay. |
When creating a Flex application, you have complete freedom to create buttons, lists, scrollbars, and other common application components to look how you want. For example, as you learn in later chapters, you can design your own scrollbars in Illustrator and make that scrollbar look any way that you want.
There are times that you may want to use standard components instead of drawing your own. You may have a client or boss who simply wants the application to look like those to which she is accustomed. The primary idea behind Catalyst is that you will begin your project in Photoshop or Illustrator, which implies that all of the design is done there and further implies that you are creating custom components. Neither Photoshop nor Illustrator contains any tools that allow you to add a standard browser button or scrollbar or other common component.
Note
The exception is Fireworks, which does contain a library of standard Web page and Flex components.
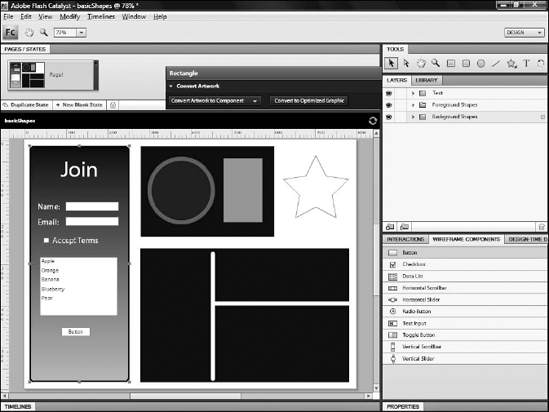
Fortunately, Catalyst contains these items. The Wireframe Components panel contains ten of the most common user interface components from the Flex framework, so adding them to your project is as simple as clicking and dragging.
Table 4.2 lists the Wireframe components included with Catalyst and briefly describes each.
Table 4.2. Wireframe Components
As you add wireframe components to your application (see Figure 4.20), keep in mind that you are only building a design comp. Much of the functionality of these components is not designed to work directly out of Catalyst. You will be able to allow Buttons to go to external Web sites or change states within an application.
You can add sample data to a data grid, but you will add most of the functionality of the components later in Flash Builder.
Note
Some of the components have customizable parts. For example, you can modify the appearance of the various pieces that make up a horizontal scrollbar. See Part IV for details on customizing component parts.
The design view in Catalyst shows you exactly what your final project will look like. Because your project will run in Flash Player, which also renders projects in exactly the same way regardless of the operating system or browser through with it is playing, you can be sure that the design you see in Catalyst is what your users will see.
Despite this, you will still want to run your project and view it in Flash Player in a browser. Primarily, this allows you to test interactive elements. Scrollbars, for example, don't work in the Catalyst design view; you must run the project in order to test them.
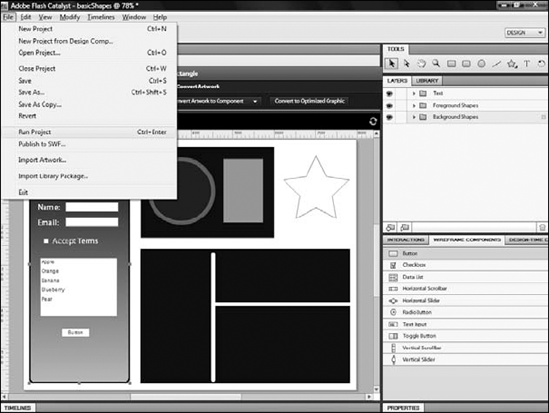
You can run a project by choosing File
Note
Flash Professional users will be familiar with running or testing projects using the Ctrl+Enter (
Tip
Catalyst doesn't provide a means by which users can control which browser is used to launch the project; it simply opens the computer's default browser. If you want to test your project in another browser, copy the project's URL from your default browser and paste it into a different browser, but keep in mind that as the project runs in Flash Player, there will not be any difference when viewing the page between browsers.
Warning
The minimum required version of Flash Player should have been installed when you installed Catalyst, but if for some reason it was not, you can download and install the latest version of the player from Adobe's Web site at www.adobe.com.
As with any file on your computer, you should be in the habit of saving often. Catalyst does not have an auto save feature, so if your computer crashes or you experience a power outage, you will lose any work you have done so far.
You can save your project by choosing File
Note
See Chapter 2 for details on FXP files.
Catalyst is not a graphics design tool. However, it does include a number of basic drawing tools that enable you to create basic page designs without the assistance of another product, such as Photoshop or Illustrator. Using Catalyst, you can draw rectangles, rounded rectangles, ellipses, lines, triangles, hexagons, octagons, and stars. You can also create solid or gradient strokes and fills and change the transparency of objects. Artwork in Catalyst is organized into layers, and graphics on one layer can be blended with those on other layers.
Catalyst also provides a set of wireframe components to which you can add common user interface elements such as scrollbars, sliders, data grids, and text input boxes.