
Root Cause Analysis
Troubleshooting refers to the methods used to resolve problems. People who troubleshoot a lot come up with a set of habits, methods, and tools to help with the process. These provide a standard approach for gathering the necessary information to zero in on the cause of a problem. This standard approach is known as a methodology.
Methodologies save time while troubleshooting. They allow us to organize our efforts to devote every available resource to resolving the problem.
But a methodology only saves time when applied intelligently. It is possible to become so devoted to the process that we forget the purpose of the whole exercise—fixing the problem. It makes no sense to spend all our time writing logs and no time testing hypotheses.
Good methodologies contain tools for coordinating efforts and organizing the troubleshooting process. The key is to focus our time and resources, minimize the cost of the problem, and find and fix the root cause. The effectiveness of these tools has been studied and verified (see, for example, Doggett in “Further Reading”).
Unfortunately, many otherwise good technical people try to minimize the time spent resolving a problem by ignoring the process structure and documentation. Structure keeps us from going in circles. Documentation provides useful information for avoiding wasted effort, fixing future problems, or evolving the design of our data environment.
Proper documentation also allows less experienced staff members to duplicate our methods and procedures. This is a key concern where these junior staff members are the primary support staff for vacation coverage or disaster recovery operations. (Who wants to get called off a beach in Florida to resolve a problem in the home office? Some short-sighted administrators regard this scenario as job security. More mature admins regard it as a nuisance.)
Our techniques need to be seen as tools to be used to solve a problem. Not every home repair involves a wrecking bar and sledgehammer, and not every problem requires a full Ishikawa diagram and formal set of probability calculations. With experience and maturity comes the judgment to decide which tools are appropriate for a particular problem. We have to practice the techniques so that we know how and where they will be most useful. Short-cutting the process unduly just causes problems in the long run.
In broad outline, troubleshooting consists of three phases: Investigation, Analysis, and Implementation. Presentations of troubleshooting methodologies sometimes present these steps with slightly different names, or emphasize slightly different aspects of the process, but the steps in Table 9-1 are one way to organize the process.
Table 9-1. The Troubleshooting Process
| Step | Comments |
|---|---|
| Investigation phase | |
| Problem statement | A clear, concise statement of the problem |
| Problem description | List the symptoms of the problem, including what works and what doesn’t; identify the scope and importance of the problem |
| Identify differences and changes | What has changed recently? How does this system differ from working systems? |
| Analysis phase | |
| Brainstorm | Gather hypotheses; what might have caused the problem? |
| Rank the likely causes | How likely is each hypothesis? |
| Test the hypotheses | Schedule testing for the most likely hypothesis; perform nondisruptive testing immediately |
| Implementation phase | |
| Apply the fix | Complete the repair |
| Verify the fix | Make sure the problem is really resolved |
| Document the resolution | Save the troubleshooting information; get a sign-off from the service owner |
In this chapter, the examples will be centered around troubleshooting computer system errors, which is something that technical teams need to do fairly often. The same techniques can be used to troubleshoot any type of problem, including organizational problems.
The Investigation phase consists of steps to identify the nature of the problem, gather information describing it, and find distinctions between working and nonworking states of the system. The defining characteristic of the Investigation phase is the collection of facts, not opinions.
For nontrivial problems, we save time over the long run by not jumping immediately to Analysis or Implementation. There is usually a lot of pressure to “just do something.” Unfortunately, that is not the most effective use of time or resources. There is a universe of harmful or irrelevant actions that we can take, and only a very few actions that will improve or fix the situation.
Problem Statement
At the beginning of the process, we need to name the problem. A good problem statement defines the problem in a broad enough way that it accurately portrays the effects of the problem, but is narrow enough to focus our problem analysis.
Value judgments have no place in a problem statement. The goal of a problem statement is to produce a concise, correct, high-level description of the problem. To do this, focus on what did happen versus what should have happened.
Ideally, the problem statement will specify a defect in a particular object or service. The problem statement should answer the questions, “Where is the problem?” and “What is wrong?”
Once we have named the problem, we need to list as many symptoms as possible without becoming redundant. In particular, we should list dissimilar symptoms—their juxtaposition allows us to look at common threads between them.
It may even be helpful to list the things that are working fine, as contrasted with items that do not work.
The start and end times of an outage should be nailed down as accurately as possible. This allows us to ask “What changed?” on a precise time window. We need this information for the next stage of the troubleshooting process.
We also need to get a handle on the scope and importance of the problem. Although these might not be directly related to the root cause of the problem, they will determine the types of tests and resolutions that we might consider to resolve the problem.
The importance of the problem will also determine how many resources we can spend in troubleshooting it. IT abounds with problems too expensive or too trivial to resolve. The role of IT is usually to notify the decision makers with appropriate estimates of costs and consequences of a problem or its resolution. Business requirements and resources will determine which of the universe of problems will get our full attention.
Identify Differences and Changes
If we can compare the broken system to one that is not broken, we can see what is different. If we can identify what changed just before it became broken, that is important information too.
The Analysis phase is focused on taking the facts from the Investigation phase and explaining them. In this phase, we generate hypotheses from the information we have gathered, test the hypotheses, and report the results.
This stage of the troubleshooting process is all about the scientific method. Intuition and experience focus the investigation by identifying which possibilities are most likely to provide a solution.
The Brainstorming step is where we try to identify all possible causes of the problem. We use the facts from the Investigation phase to generate hypotheses about the cause of the problem.
The symptoms and problem statement can be turned around to provide hypotheses. We ask ourselves questions such as “How can this item have caused this problem?” The answers can be added to our list of hypotheses.
It is sometimes useful to have a system diagram or other mental model of the system before thinking about possible causes. Each component of the system should be considered as a possible cause.
(A common example of such a mental model is the Open Systems Interconnection (OSI) network stack in Table 9-2. Some network troubleshooting methodologies focus on eliminating portions of the stack as the cause of the problem.)
Table 9-2. OSI Network Reference Model—Example of a System Model
| Level Name | Description |
|---|---|
| Application layer | Application programs using the network |
| Presentation layer | Data presentation to the applications |
| Session layer | Manages sessions between cooperating applications |
| Transport layer | End-to-end error detection and correction |
| Network layer | Manages connections and addressing on the network |
| Data Link layer | Reliable data delivery across physical network components |
| Physical layer | Network physical media |
In this context, “components” need to be considered at an appropriate level of abstraction. Depending on the nature of the problem, a diode, a computer, a network service, or the Internet may be considered to be components. For our purposes, we define a component as an entity that we can test and then eliminate as the source of the problem.
If we can eliminate a component, it makes no sense to spend time eliminating subcomponents. The level of abstraction can make a huge difference in the amount of time spent in a troubleshooting exercise. (In an idealized situation where we can eliminate half of the system at each step, for example, we can narrow a problem down to one component out of a million in only 20 steps.) Figure 9-1 illustrates several different levels of abstraction that might be used to examine a problem.
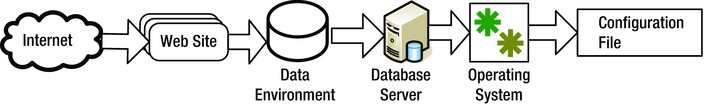
Figure 9-1. Levels of abstraction
There are several tools to help organize brainstorming sessions. One such tool is the Ishikawa cause-and-effect diagram (see the “Ishikawa Cause-and-Effect Diagrams” sidebar). A key to a successful brainstorming session (especially one involving a team of people) is that everyone focuses on identifying possible causes rather than starting to drill down on a particular hypothesis. Ishikawa diagrams help to make sure that each system component is examined as a possible cause of the problem.
ISHIKAWA CAUSE-AND-EFFECT DIAGRAMS
Ishikawa cause-and-effect (or “Fishbone”) diagrams are tools that allow us to focus a brainstorming session. We generate an Ishikawa diagram by drawing a “backbone” arrow pointing to the right at a rectangle containing our problem statement. Then attach four to six “ribs,” each of which represents a major broad category of items that may contribute to the problem. Each of our components should fit on one or another of these ribs.
The next step can be done by the troubleshooting team leader or by the whole team. Specific causes are attached to the appropriate rib, and more detailed potential causes are listed as branches of their related causes.
Figure 9-2 shows an example of an Ishikawa diagram. The four categories chosen for this diagram were “Computer System,” “Computing Environment,” “People and Procedures,” and “Application.” Several secondary potential causes have been attached to each of the main categories.
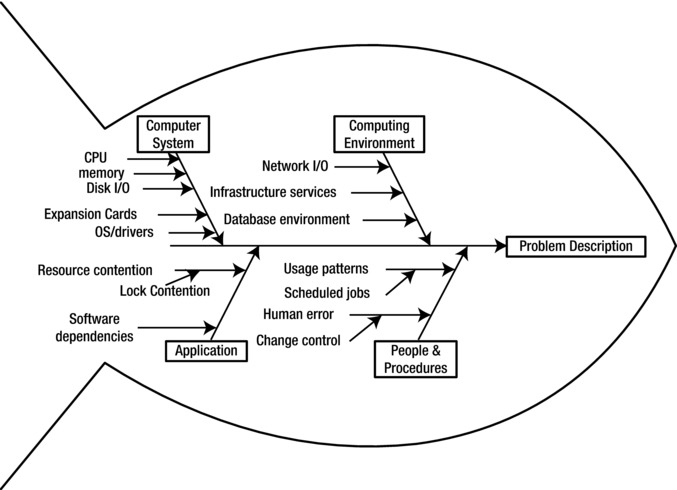
Figure 9-2. Ishikawa cause-and-effect diagram
Appropriate primary categories for the diagram may be different from situation to situation. Common paradigms presented in the literature include “materials, methods, machines, and manpower” or “people, procedures, plant, and parts.” Whatever we choose, our major categories should represent the universe of issues that may have caused our problem.
The main advantage of an Ishikawa diagram for our purposes is that it can organize the brainstorming process so significant hypotheses are not ignored. A well-organized diagram can focus the troubleshooting team’s attention on each potential issue to help avoid the problem of overlooked hypotheses.
Remember that your goal is not the production of a pretty diagram. The Ishikawa diagram is a tool to facilitate brainstorming. The goal is to make sure to cover all the possible causes of our stated problem.
Not every problem requires anything as formal or organized as an Ishikawa diagram. There is no point in trying to swat a fly with a sledgehammer. But when a problem is big enough to involve multiple people and several different areas of inquiry, something similar to an Ishikawa diagram provides needed structure to a brainstorming session.
Rank the Likely Causes
Once we have a list of possible explanations for the problem, we need to decide which of them are most likely to be correct. We also need to look into any assumptions that are implicit in the hypothesis statements.
Only eliminate hypotheses when they are absolutely disproved. This step is about ranking the probabilities of the different hypotheses being the correct explanation. Unlikely hypotheses should not be discarded, though they may be characterized as “very unlikely” or “corner cases.”
In some cases, the best way to test the hypotheses is by looking at information gathered during the Investigation phase. For example, a bug report may closely match the symptomology of your problem. If this is the case, we should look closely at that bug report.
For more complex problems with more moving parts, it may be useful to use formal tools to help identify which potential causes are more important than others. Interrelationship diagrams (see the “Interrelationship Diagrams” sidebar) are tools developed to help organize and think about the relationships between these potential causes. They are useful in looking for ultimate versus proximate causes.
(Ultimate causes are the “root” causes of the problem. While they may not be directly indicated by the symptoms, we will continue to have these problems until we address the ultimate causes. Proximate causes are the causes of the problem that are immediately, directly responsible for the symptoms.)
As with the Ishikawa diagrams, not every problem will require the use of this sort of formal technique. On the other hand, complex problems with lots of moving parts may benefit from their use.
INTERRELATIONSHIP DIAGRAMS
Interrelationship diagrams (IDs) are tools used to look at a collection of possible explanations and identify which of them might be a root cause. IDs are particularly useful when hypotheses are interrelated in nontrivial ways. Their purpose is to identify which of several interrelated items are causes and which are effects.
IDs use boxes containing phrases describing the potential causes. Arrows between the potential causes represent influence relationships between the issues. Each relationship can only have an arrow in one direction. (Where the relationship’s influence runs in both directions, the troubleshooters must decide which one is most relevant.) Items with more “out” arrows than “in” arrows are causes. Items with more “in” arrows are effects.
Figure 9-3 shows a simple example of an Interrelationship diagram. The real benefit of an ID comes when we are looking at the relationships between the possible causes. In particular, they are helpful in distinguishing between the apparent (proximate) causes and the root (ultimate) causes.
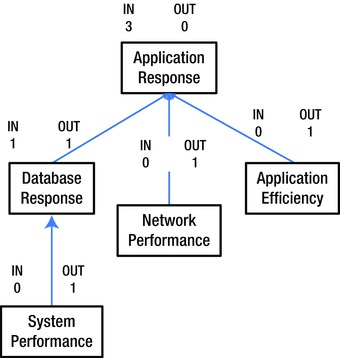
Figure 9-3. Interrelationship diagram
Researchers provide several suggestions for using IDs effectively:1
- Collect information from multiple distinct sources.
- Phrases with a noun and a verb are recommended in each box.
- Diagrams must reflect a group consensus.
- Redo diagrams several times if necessary.
- Don’t get distracted by intermediate factors.
A common way to use IDs is to write each box’s description on a Post-It note, arrange them on a white board, and draw in the arrows. This can be a useful way to deal with a large number of interrelated hypotheses.
In more complicated implementations, arrows may be weighted to try and rank the causes in order of importance. As a practical matter, that is probably overkill for most troubleshooting exercises of the sort that system administrators face.
Usually, the diagram’s main benefit is in helping the troubleshooting team to focus on the issues and their relationships. In particular, it helps distinguish between the causes and symptoms of a problem. The relative importance of the competing hypotheses and the relationships between them are often a side-benefit of this discussion.
Test the Hypotheses
Once we have identified which hypotheses are most likely to be correct, we need to schedule them for testing immediately. This does not necessarily mean that they can actually be tested immediately. Some hypotheses require disruptive testing, which may need to be scheduled during a maintenance window. Nevertheless, testing should be scheduled immediately for any hypotheses that are considered likely to be the cause of the problem.
Other hypotheses do not require disruptive testing. Those tests should be carried out immediately, from most likely to least likely.
As with doctors, the rule for troubleshooters is “First, do no harm.” Our testing should be the least disruptive possible under the circumstances. We need to minimize costs associated with downtime, service instability, time, money, and technical resources. We should never do anything without knowing how to reverse the change.
If a fail-over solution exists, we should fail over. At a minimum, service outages should be confined to scheduled maintenance windows where possible. Data needs to be backed up to prevent data loss. In particular, configurations should be preserved before they are changed. No test should be carried out that cannot be reversed.
In some cases, it may be possible to test the hypothesis directly in some sort of test environment. This may be as simple as running an alternative copy of a program without overwriting the original. Or it may be as complex as setting up a near copy of the faulted system in a test lab. If a realistic test can be carried out without too great a cost in terms of money or time, it can assure us that we have identified the root cause of the problem.
Depending on the situation, it may even be appropriate to test out the hypotheses by directly applying the fix. If this approach is used, it is important to only perform one test at a time, and back out the results of each failed hypotheses before trying the next one. Otherwise, you will not have a good handle on the root cause of the problem, and you may never be confident that it will not re-emerge at the worst possible moment.
As we design tests, we should try to have a “smoking gun” level of certainty about whether we have nailed the cause (or at least narrowed it down).
It is frequently best to start with the most likely cause for the failure, based on the troubleshooting team’s understanding of the system. The history of similar faults may also indicate the most likely problem. The “most likely first” approach is especially valuable if one of the possible causes is considered to be much more likely than the others.
On the other hand, if investigating the most likely cause requires disruptive or expensive testing, it makes sense to eliminate some of the possibilities that are easier to test. This is particularly the case if there are several easily testable hypotheses.
The best approach is to schedule testing of the most likely hypotheses immediately. Then start to perform any nondisruptive or minimally disruptive testing of hypotheses. If several of the most likely hypotheses can be tested nondisruptively, so much the better. Start with them.
The key is to start eliminating possibilities as soon as possible. It makes no sense to waste time arguing about the most likely cause. Prove it. At this stage, the troubleshooting team has spent a lot of time thinking about the problem. Don’t start with the corner cases, but start narrowing the list down.
Intermittent problems are especially difficult to troubleshoot. See the “Dealing with Intermittent Problems” sidebar for suggestions on handling this type of problem.
DEALING WITH INTERMITTENT PROBLEMS
Intermittent problems are extremely difficult to troubleshoot. Any reproducible problem can be troubleshot, if for no other reason than that each false possibility can be disproved. Problems that are not reproducible cannot be approached in the same way.
We will not know that a problem is not reproducible until after we have tested the available hypotheses. Hopefully, we will have been able to definitively eliminate some of the areas of concern with our testing regime. The first thing that we need to do is to see if we can knock out other possible causes with additional testing.
Problems present themselves as intermittent for one of two reasons:
We have not identified the real cause of the problem.
The problem is being caused by failing or flaky hardware.
The first possibility should be addressed by going back to the brainstorming step. It may be helpful to bring a fresh perspective into the brainstorming session, either by bringing in different people, or by sleeping on the problem.
The second problem is tougher. There are hardware diagnostics tests that can be run to try to identify the failing piece of hardware. The first thing to do is to perform general maintenance on the system. Re-seat memory chips, processors, expansion boards, and hard drives. Use an approved vacuum cleaner to clean the dust out of the case. Look for cracked traces or stress fractures on the system boards.
If OS patches are out of date, it also makes sense to apply a current patch set to resolve driver issues that may have since been fixed. Keep track of which patches are applied when so that we can back them out if new problems emerge.
Once general maintenance has been performed, test suites can perform stress-testing on a system to try to trigger the failure and identify the failing part. Ideally, we want to pull the failing system out of production long enough to be able to run the tests and perform the repair. Perhaps this can be done during a maintenance period or the system can be replaced temporarily with a piece of failover hardware.
It may be the case, however, that the costs associated with this level of troubleshooting are prohibitive. In this case, we may want to attempt to shotgun the problem.
Shotgunning is the practice of replacing potentially failing parts without having identified them as actually being flaky. In general, parts are replaced by price point, with the cheapest parts being replaced first. (See Litt in “Further Reading” section) Though we are likely to inadvertently replace working parts, the cost of the replacement may be cheaper than the costs of the alternatives (as in the downtime cost associated with stress testing).
When parts are removed during shotgunning, it is important to discard them rather than keep them as spares. Any part you remove as part of a troubleshooting exercise is questionable. (After all, what if a power surge caused multiple parts to fail? Or what if there was a cascading failure?) It does not make sense to have questionable parts in inventory; such parts would be useless for troubleshooting, and putting questionable parts into service just generates additional downtime down the road.
Shotgunning may violate your service contract if performed without the knowledge and consent of our service provider. (To get consent, it may be necessary to apply leverage to the service provider by speaking candidly with a manager about the impact of the problem and whether the provider’s usual strategies are working. It may even be necessary to purchase the parts ourselves to perform shotgunning.)
Regardless of the methods used to deal with an intermittent problem, we must keep good records. Relationships between our problem and other events may only become clear when we look at patterns over time. We may only be confident that we have really resolved the problem if we can demonstrate that we’ve gone well beyond the usual re-occurrence frequency without the problem re-emerging.
The Implementation phase is where we finally resolve the problem. Here is where we recover the system to a working state. This is also the phase where we make sure that we have really fixed the problem and where we document our results.
Once our testing has identified the source of the problem, we need to fix it. This includes fixing any required documentation or similar configurations on other systems.
A key concern in applying the fix is that we do so in the least-disruptive, lowest-cost manner possible. (Lowest cost means that we have to consider all the costs. This includes the cost of downtime on the affected service, the cost of continued instability on the system prior to the fix, as well as direct costs associated with the repair.)
Ideally, we want to carry out the fix in a way that we can verify that the problem is actually resolved. Especially where reboots are required, it is sometimes hard to tell whether the problem has actually been fixed, or whether the reboot just cleared up the symptoms.
We need to make sure that we have actually resolved the problem. We also need to verify that we have not introduced any new problems.
In a well-organized environment, each service should have a test procedure or test suite associated with it to identify when the service is working properly. Test suites will never be 100% complete, but they can evolve into extremely useful tools. As new failure modes emerge, tests for them must be integrated into the suite.
Part of this step may be a root cause analysis to make sure that we have nailed the cause of the problem, as opposed to applying a bandage to a symptom. Root cause analyses are discussed in more detail later in this chapter.
Information on troubleshooting incidents needs to be stored in a central repository. This doesn’t mean that we have to go nuts (though there are vendors who would be happy to sell us an expensive solution). In many environments, it is enough to have a shared directory with an appropriate subdirectory structure and file naming scheme.
A key document that needs to be included in this repository is a sign-off from the service owner agreeing that the problem has been resolved. This may seem like “administrivia,” but the discipline of getting a sign-off ensures that we have understood and addressed the end-user complaint. It also ensures that the end-user spends the time to check it out (or at least takes some ownership for future occurrences of the problem). We don’t have to write up a contract that requires approval from Legal. In many environments, a copy of a thank you email from the service owner is good enough.
At a bare minimum, the problem resolution documentation needs to include the following:
- Problem statement.
- Problem description documents, including dates and times of occurrences.
- Any vendor service order or correspondence associated with the problem.
- Information about the hypotheses generated during brainstorming, including any diagrams or documents used to organize them. (If a white-board discussion has been a central part of the process, take a digital photo of it and save it as part of the problem history.)
- Descriptions and results of testing. (This may be as simple as a checklist or a collection of saved emails.)
- A confirmation and acceptance document from the service owner.
At the very least, archive copies of the emails between members of the troubleshooting team. The key thing is that they be organized in a way that they can be found if we need to reference them in the future.
Over time, the collection of data on resolved problems can become a valuable resource. It can be referenced to deal with similar problems. It can be used to track recurring problems over time. Or it can be used to continue the troubleshooting process if it turns out that the problem was not really resolved after all.
Here is how we would apply these techniques to the familiar scenario of a system crash.
Soltest, a Solaris server, crashed on Thursday morning at 1:32 am. Fortunately, this system is part of a high-availability cluster of web servers, so services were not interrupted. We have the freedom to work on soltest immediately, rather than having to try to bring the system online by any means necessary to limp through to a maintenance window.
Problem Statement
Our problem statement in this case is very straightforward: “soltest panicked on Thursday morning at 1:32am.” Note that this problem statement does not include any value judgments about difficulties caused by the system panic, it does not include any hypotheses as to the cause, and it does not include a list of immediately observable symptoms.
Problem Description
Our next task is to fully describe the problem by collecting as many symptoms as possible. We end up with the following:
A core file was generated by the system panic. A quick examination of the core file shows that httpd was active at the time of the panic.
POST reports “Hypertransport Sync Flood occurred on last boot.” The vendor web site identifies this as a memory error.
BIOS and service processor System Event Log information report errors on the DIMM at CPU0, slot 1.
The fault LEDs are lit for CPU0, slots 0 and 1.
Identify Differences and Changes
Our records for the system show that memory was upgraded six months ago.
Brainstorm
The obvious conclusion is that the cause of the problem is a bad DIMM. Rather than jumping immediately to replacing the DIMM, we take the time to think through the Ishikawa diagram in Figure 9-4.
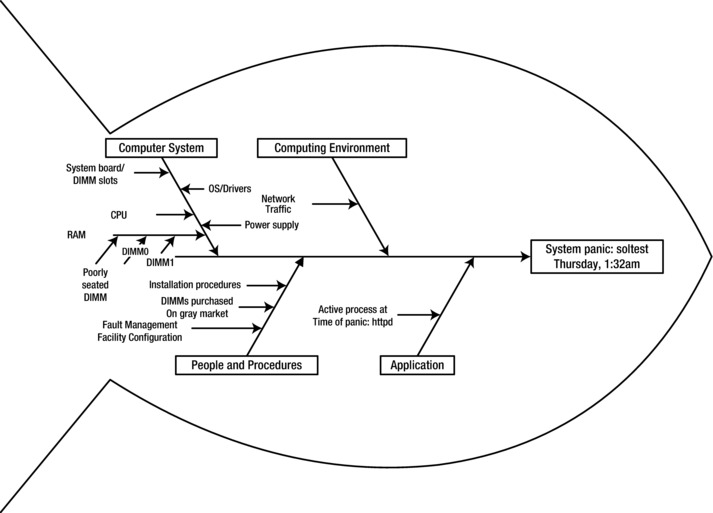
Figure 9-4. Ishikawa diagram; memory error
(Note that some of the items on the diagram are extremely low probability events. The purpose of a brainstorming exercise is to generate possible explanations, not to filter them. We want to encourage hare-brained speculation in this step. Sometimes those oddball hypotheses end up being the real cause or at least triggering a thought that leads to the root cause.)
Because we are disciplined enough to think through each aspect of the system, we make several interesting observations:
- 1. Experience has shown that sometimes an error reported on one DIMM is actually a result of a bad memory chip elsewhere in the same bank. Hardware manufacturers have gotten better at identifying the failing part, but we should consider the possibility that the other DIMM in the bank is the bad part.
- 2. The DIMM may be poorly seated, not failed. This can be due to a faulty slot on the system board, or it may be due to a poorly installed DIMM.
- 3. CPU or CPU cache errors sometimes manifest as “memory errors.”
- 4. Could an OS or driver bug be at fault? We can certainly check SunSolve’s bug database against our current patch level.
- 5. Bad power supplies can sometimes cause failures of other components.
- 6. Could high network traffic have caused the problem?
- 7. We sometimes purchase gray market DIMMs. Perhaps they sent us a bad part? Maybe we should be more careful about choosing our suppliers?
(Here, gray market refers to a legitimate but unapproved vendor who sells refurbished parts or new parts purchased through other than a manufacturer-approved VAR. Gray market parts may void your service contract or warranty. If you’re dealing with parts that “fell off the back of a truck,” you are dealing with black market parts, and you deserve whatever ill fortune comes your way. Shame on you.)
- 8. Can we configure the Fault Management Facility to handle memory errors more gracefully?
- 9. The httpd process was active at the time of the panic. Could this have generated the error?
Rank the Likely Causes
We have generated quite a few hypotheses. It makes sense to look for possible relationships to make sure that we examine any possible root causes.
In the real world, IDs are frequently generated by writing the various proposed causes on Post-It notes on a white board, then rearranging them and drawing relationship arrows between them. Working through this process in this case yields a few observations, which are illustrated in Figure 9-5.
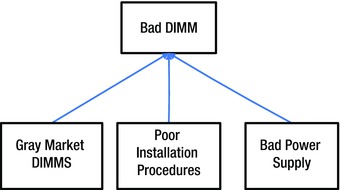
Figure 9-5. Memory error interrelationship diagram
One relationship that jumps out is the possibility that our purchasing policy (gray market DIMMs) may have led to an installation of a bad part. In this case, we have a possible ultimate cause (purchasing policy) and a possible proximate cause (bad DIMM) that both need to be examined.
Another possible relationship is that our installation procedure may have damaged a DIMM during the upgrade. In this scenario, our ultimate cause would be poor installation procedures and our proximate cause would be the resulting bad DIMM (Since the upgrade was six months ago, we can rank this as a low probability hypothesis.)
A bad power supply may have led to a failing DIMM.
High network traffic or some activity of httpd may have resulted in exercising the bad piece of memory, but they can’t reasonably be considered to be the “cause” of the problem in any meaningful sense.
- Based on this, the ranking of the most likely hypotheses are the following:
- The DIMM in slot 1, CPU 0 is faulty. (The most obvious candidate is usually the right one.)
- The DIMM in slot 0, CPU 0 is faulty.
- The DIMMs in the bank are improperly seated or have a bad DIMM slot.
- CPU 0 has a problem.
- An OS or driver problem is improperly reporting a memory error.
In addition, we need to examine the possible ultimate causes of the gray market parts or the poor installation procedures. Both of these are possible problems with broad ramifications, and they should be examined.
Test the Hypotheses
The hardware vendor outlines a procedure for investigating memory errors in the diagnostics manual for these servers. When investigating a hardware error, we should always check vendor documentation for their recommendations about how to proceed with testing. Sometimes there are built-in testing facilities that we are unfamiliar with, and sometimes there are hardware-specific issues that we don’t know about.
The vendor can recommend a procedure for identifying whether it is a bad DIMM, a mis-seated DIMM, a system board problem, or a CPU problem.
In addition to the fun with hardware, we need to take the time to examine the other two potential root causes. (We can do this while the memory stress test is running.)
We can examine the quality issues with our gray market vendor by looking at the repair history of parts purchased through them. We may also want to consider whether we may have voided service contracts or system warranties by purchasing nonapproved parts, and whether the extra costs and risks associated with our decision are justified by our cost savings.
And our installation procedures should be reviewed in any case. Everyone should be reminded to take proper antistatic and hygienic precautions (wash hands, clean work area, etc.) and to install parts in a manufacturer-approved manner.
The power supply should also be investigated, because power supply problems can be very difficult to track down. General practice is to start looking at the power supply as a possible culprit when there have been multiple part failures over a relatively short period of time. Unless there is actually a fault light on the power supply, it is difficult to pin down power supply problems, especially intermittent ones.
The steps outlined by the vendor can be very involved. In some cases, (with the concurrence of our service vendor, if any), it might make sense to shotgun the problem by replacing suspected parts one at a time. After each replacement, diagnostics (including a stress test) should be run. Parts removed during a shotgunning session should always be discarded, even if we don’t think they are bad to avoid intermittent problems with that part in the future. The usual practice when shotgunning is to replace parts in order of cost (cheapest first), rather than likelihood. Individual cases may be handled differently.
Apply the Fix
In this case, our failed part has been replaced as part of our testing regime. The ultimate cause, however, may still be out there. Any changes to our purchasing and installation procedures also need to be implemented.
Verify the Fix
In this case, stress tests, are a good way to validate our fix. Procedural changes also need to be verified and approved by the relevant managers.
Document the Resolution
In some environments, it is enough to bundle together the logs and documents generated during the troubleshooting session and put them in a directory share with a defined structure. In this case, for example, perhaps we could create a directory for the soltest server, with a subdirectory named according to the date and a brief problem description (yyyymmdd-ProblemDescription). Our diagrams, notes, and emails can be saved to this directory. We should also include a document containing any service order numbers created with our service provider.
In larger environments, it may be worthwhile to set up a problem resolution database to allow searches of problem resolution information.
We also need to include a sign-off document from the system owner verifying that the problem is resolved.
Root Cause Analysis
Too often we see people who think that they have “fixed” the problem because the immediate emergency is over. In fact, people who don’t resolve the root problem are condemned to a continual break/fix treadmill. The discipline of root cause analysis was invented to help us break the firefighting cycle and actually get the problem fixed for once and for all.
Systems administration is not the only discipline to have problems that need us to dig down to the ultimate causes. Fortunately, root cause analysis is general enough to be applied to a broad range of problems.
5 Whys
The simplest version of root cause analysis is sometimes called the “5 Whys” method developed by Toyota Motor Corporation. This method proposes that for most problems, by asking “why” a problem occurs, and asking “why” each successive explanation occurs, we can arrive at the root cause within 5 iterations. There is nothing magical about the number 5; the exercise should be repeated until we get to something that is recognizable as a root cause. Example 9-1 illustrates
EXAMPLE 9-1. 5 WHYS
Problem Statement: The system crashed. (Why?)
A memory chip failed. (Why?)
The machine room temperature exceeded recommendations. (Why?)
The HVAC unit is undersized given our heat load. (Why?)
Our projections for heat load were lower than what has been observed. (Why?)
We did the heat load projections ourselves rather than bringing in a qualified expert.
There are some serious weaknesses to the 5 Whys method:
- The results are not repeatable. We may well end up with different results depending on who runs the exercise. For example, what if we had answered the second “why” with some other plausible explanation—such as, “The chip was installed improperly” or “The manufacturer’s quality control is inadequate”?
- We are limited to the participants’ knowledge of the system. In particular, we aren’t going to find any answers that the participants don’t already suspect.
- We may not ask “why?” about the right symptoms of the problem.
- We may stop short and not proceed to the actual root cause of the problem. For example, people may stop at the point about the HVAC unit being undersized, run the estimates themselves, and promptly purchase a larger (but still undersized) unit.
These problems can be addressed, usually by reaching a group consensus about the appropriate answer for each “why” and by performing rigorous testing wherever possible.
Current Reality Tree
Eliyahu Goldratt presented a Theory of Constraints to resolve issues with organizational problem solving.2 One of the cornerstones of the Theory of Constraints is a type of diagram known as a Current Reality Tree (CRT).
The Current Reality Tree has a number of similarities with the Interrelationship diagram. As with the ID, the CRT’s primary components are boxes describing symptoms and arrows representing relationships between them. There are several key distinctions between an ID and a CRT:
- Arrows may flow in both directions if necessary. In particular, this allows us to identify a negative feedback loop.
- Symptoms are divided into undesirable effects (UDE) and neutral effects (NE). This allows us to recognize the effects of things in our environment that are not viewed as undesirable, but which may contribute to a UDE.
- Two or more symptoms may have their arrows combined with an ellipse. In a CRT, this means that the combination of those symptoms is sufficient to provoke the following UDE, but that all of them are required to ensure that the following UDE occurs. (In other words, the combination of UDEs and NEs is both necessary and sufficient to provoke the following UDE.)
- Because of the emphasis on identifying combinations of effects that are both necessary and sufficient, CRTs can sometimes flush out symptoms that are not obvious at first glance. As a result, CRTs can be better at getting to a real root cause than either Ishikawa diagrams or Interrelationship Diagrams (IDs).3
Building a CRT
Building a CRT has a lot in common with building Ishikawa and Interrelationship diagrams. First, we ask a key question with our Problem Statement. The question will usually be of the form “Why is this happening?” or “Why did this happen?”
Next, we need to create a list of several undesirable effects that are related to the key question. Each of these UDEs gets a box (or perhaps a Post-It note on a white board). These are arranged from top to bottom, where the top symptoms are the result of the symptoms from lower rows.
Wherever we can say something like “If A, then B,” we would draw an arrow from A to B. Where we can say something like “If A is combined with B, then we get C,” we would draw arrows from A and B to C, then group the arrows with an ellipse. (See Figure 9-6.)
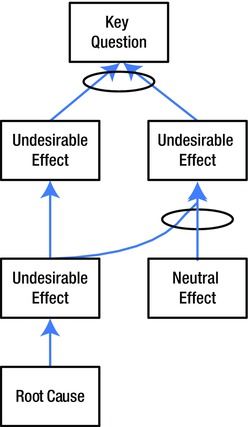
Figure 9-6. Basic current reality tree
We may also identify a feedback loop, where an effect has a direct impact on one of its own causes. Figure 9-7 illustrates such a loop.
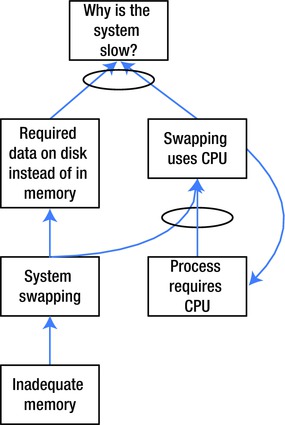
Figure 9-7. Feedback loop in a CRT
In Figure 9-7, we consider the case of a CPU-bound service on a system with inadequate memory. The system starts to swap, which slows down the process because data is stored in swap space rather than memory, and CPU resources are required to run the page scanner and perform swapping.
During this exercise, we may find it necessary to add more symptoms, either undesirable effects or neutral effects. We should not add UDEs or NEs that are not part of a key causality chain, or that are simply “facts of life.” We want to try to keep the diagram clean enough that it can be used to spur thinking about how to resolve the root causes; it doesn’t make sense to put in items that are tangential or environmental.
We will likely have two or more branches of the tree. Wherever possible, we should try to identify connections between the branches, such as symptoms that would cause the lowest-level effects of both branches.
At the lowest level of the CRT, we should ask “Why?” and continue to build the tree down until we are at the Root Causes, also known as Problems. If the lowest-level boxes are still just symptoms of an underlying problem, build down as far as possible by asking “Why?” at each stage.
It is possible to have more than one root cause for a problem. In this case, we would want to identify which of the causes is predominant. If one of the root causes is responsible for more than 70% of the UDEs, it is designated the Core Problem; it should receive our attention first. (Pareto diagrams, discussed in the final section of this chapter, may help us to identify the Core Problem.)
In Figure 9-8, for example, the Core Problem is that we have inadequate memory. We could argue that an alternative root cause is that we don’t have enough CPU resources to swap efficiently, but a reasonable system administrator would have to admit that more than 70% of the problem is due to the memory shortage.
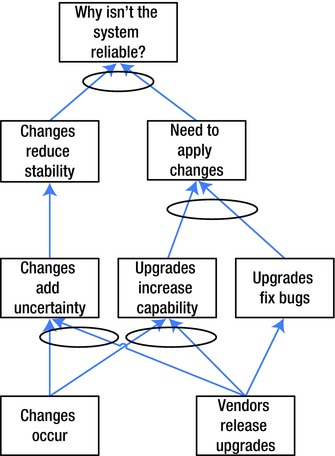
Figure 9-8. Core conflict in a CRT
It is also possible that at the lowest level, we will end up with a Core Conflict between two or more otherwise neutral effects. The combination of these two NEs, or the conflicts between them may end up causing the UDEs further up the diagram.
The Evaporating Cloud refers to Goldratt’s method for dealing with conflicts. In particular, Goldratt discusses the Core Conflict Cloud representing the Core Conflict in our CRT.
The cloud metaphor describes the sense of unease we feel when faced with a seeming choice between two necessary conditions. Most of the time, we feel that we are caught in a situation where the best we can do is get away with some sort of unsatisfactory compromise.
In an Evaporating Cloud diagram, the end goal (aka the Systemic Objective) is placed in a box on the left. The two conflicting Prerequisite Conditions are placed in boxes at the right hand side of the drawing, with a lightning bolt arrow between them. The Necessary Conditions for the Systemic Objective are placed in boxes next to their respective conflicting prerequisite conditions. See Figure 9-9, for an example.
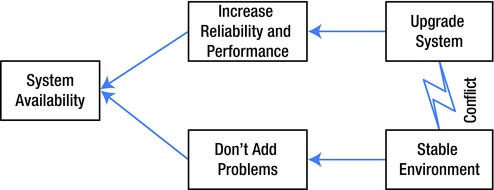
Figure 9-9. Evaporating cloud
Many conflicts can be resolved by defining the Necessary Conditions as narrowly as possible to reach the Systemic Objective, then seeing if this allows a redefinition of the Prerequisite Conditions that eliminates the conflict. The goal of a Theory of Constraints thinking exercise is to reach a win/win solution to a problem that leverages constraints rather than viewing them as obstacles.
Figure 9-9 illustrates the age-old conflict between upgrades and system stability. On the one hand, upgrades will increase the system reliability and performance. Neglecting upgrades for too long will eventually result in system problems. On the other hand, changes always carry some risk, so there is a strong desire to avoid the pain of changes, including upgrades.
In this case, we need to recognize the end goal of providing a reliable service. Upgrades need to be performed, but should be performed in a way that allows for adequate planning and testing to avoid introducing problems to a working system.
This sort of solution “evaporates” the cloud. In the Theory of Constraints, we can now build a Future Reality Tree, which is like a Current Reality Tree, except that it will represent the system with the changes we recommended to evaporate the cloud. These additional changes are called injections. Figure 9-10 includes an example of a Future Reality Tree with our injections.
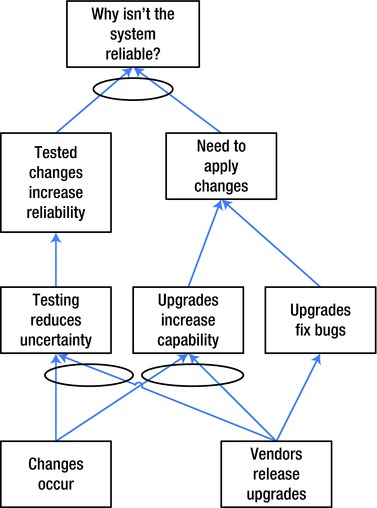
Figure 9-10. Future reality tree
Pareto diagrams are designed to help us identify which of several items is responsible for most of the problems we face. The Pareto Principle is an observation that states that in many real-world cases, 80% of the problems come from 20% of the components.
We would create a Pareto diagram by identifying “buckets” of factors into which we will sort incidents. Each incident is assigned to only one bucket. Based on which buckets are responsible for the most incidents, we know where we should focus our efforts. In the case of buckets assigned to different root causes in a CRT, the Pareto diagram tells us which cause is the Core Problem.
In Figure 9-11, the numbers on the left side of the graph indicate the raw number of incidents associated with each bucket in the bar graph. The numbers on the right side indicate the cumulative percentage of incidents reflected by the buckets to the left of each point on the upper line graph.
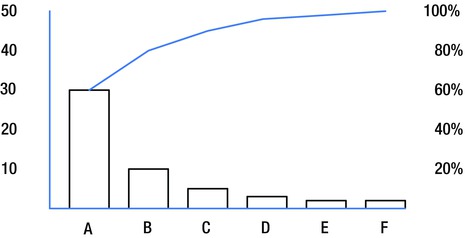
Figure 9-11. Pareto diagram
One way to interpret Figure 9-11 is that cleaning up cause A will eliminate 60% of the problem occurrences. Eliminating A and B will eliminate 80% of the incidents.
Analyses such as Pareto analysis are only possible if information on past incidents have been collected. This is an example of why it is so important to document incidents.
Summary
There are a number of tools available to assist in troubleshooting and root cause analysis exercises. Historically, these have been used more by business people, especially on production floors. But where these methods have been applied in IT settings, they have been successful in helping identify and resolve issues.
Discussion Questions
Think of a problem in your environment.
- Draw an Ishikawa diagram to help identify possible causes.
- Draw Interrelationship diagrams to help rank the most likely causes.
- Draw a Current Reality Tree showing the environment. Use an Evaporating Cloud to identify possible solutions.
- What possible resolutions have you found for the problem?
Further Reading
Cromar, Scott. “Troubleshooting Methods,” SysAdmin Magazine 16, no. 8 (2007): 33–38.
Cromar, Scott. Solaris Troubleshooting Handbook. North Charleston, SC: CreateSpace, 2008.
Doggett, Anthony Mark. “A Statistical Analysis of Three Root Cause Analysis Tools.” Journal of Industrial Technology 20, no. 2 (2004): 1–9, www.nait.org/jit/Articles/doggett010504.pdf.
Litt, Steve. “Shotgunning,” Troubleshooting Professional Magazine 9, no. 4 (2005). www.troubleshooters.com/tpromag/200510/200510.htm.
Mizuno, Sigeru, ed. Management for Quality Improvement: The Seven New QC Tools. Cambridge: Productivity Press, 1988.
Mosley, Henry. Current Reality Trees: An Action Learning Tool for Root Cause Analysis. Baltimore, MD: Strategic Leadership Seminar for Population and Reproductive Health, 2006. www.jhuccp.org/training/scope/starguide/toc/rootcauseanalysis.ppt.
Ohno, Taiichi. Toyota Production System: Beyond Large-Scale Production. Portland, OR: Productivity Press, 1988.
Patrick, Francis S. Taking Advantage of Resistance to Change (and the TOC Thinking Processes) to Improve Improvements. Hillsborough, NJ: Focused Performance, 2001. www.focusedperformance.com/articles/resistanceslides.pdf.
Schwalbe, Kathy. Information Technology Project Management. Boston, MA: Thompson, 2006.
Shelford, Thomas J., and Gregory A. Remillard. Real Web Project Management. Boston, MA: Addison-Wesley, 2002.
U.S. Department of Energy. DOE Guideline: Root Cause Analysis Guidance Document (Report No. DOE–NE–STD–1004–92). Washington, DC: U.S. Department of Energy, Office of Nuclear Energy, 1992.
Youngman, Kelvyn. A Guide to Implementing the Theory of Constraints (TOC) website, 2007. www.dbrmfg.co.nz.
1 Sigeru Mizuno, ed., Management for Quality Improvement: The 7 New QC Tools. Cambridge, England: Productivity Press, 1988.
2 Eliyahu M. Goldratt, Essays on the Theory of Constraints. Great Barrington, MA: North River Press, 1987.
3 See Anthony Mark Doggett, “A Statistical Analysis of Three Root Cause Analysis Tools,” Journal of Industrial Technology 20 (Feb.-April 2004): 5. www.nait.org/jit/Articles/doggett010504.pdf.