
Chrome has built-in Developer Tools (commonly known as “DevTools”) that are among the best available for testing styles, layouts, and more on the fly. Using the DevTools is much more efficient than trying things out in code. The DevTools are very powerful and will be your constant companion as you do front-end development.
You will start using the DevTools in the next chapter. For now, open the window and familiarize yourself with its major areas.
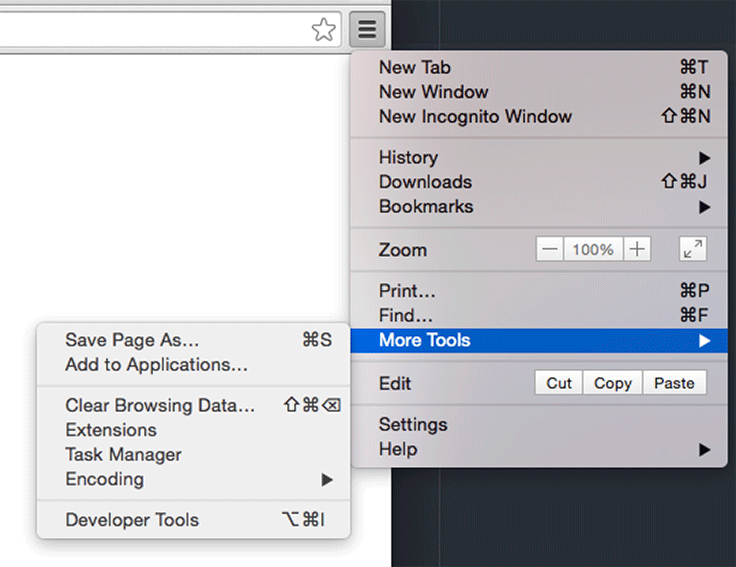
To open the DevTools, click the ![]() icon to the right of the address bar in Chrome. Next, click More Tools → Developer Tools (Figure 2.16).
icon to the right of the address bar in Chrome. Next, click More Tools → Developer Tools (Figure 2.16).
Chrome displays the DevTools to the right by default. Your screen will look something like Figure 2.17.

The DevTools show the relationship between the code and the resulting page elements. They let you inspect individual elements’ attributes and styles and see immediately how the browser is interpreting your code. Seeing this relationship is critical for both development and debugging.
In Figure 2.17, you can see the DevTools next to the web page, displaying the elements panel. The elements panel is divided into two sections. On the left is the DOM tree view. This is a representation of the HTML, interpreted as DOM elements. (You will learn much more about DOM, which stands for “document object model,” in upcoming chapters.) On the righthand side of the elements panel is the styles pane. This shows any visual styles applied to individual elements.
Having the DevTools docked on the right side of the screen while you are working is usually convenient.
If you want to change the location of the DevTools,
you can click the ![]() button near the upper-right corner. This will show you a menu of options, including buttons for
the Dock side, which will change the anchor location of
the DevTools (Figure 2.18).
button near the upper-right corner. This will show you a menu of options, including buttons for
the Dock side, which will change the anchor location of
the DevTools (Figure 2.18).

With your otters and markup in place and the DevTools open, you are ready to begin styling your project in the next chapter.